
|
|||||
|
 | |
| |
| |
| |
| |
| |
|
Gene: ASH2L |
Gene summary for ASH2L |
| Gene information | Species | Human | Gene symbol | ASH2L | Gene ID | 9070 |
| Gene name | ASH2 like, histone lysine methyltransferase complex subunit | |
| Gene Alias | ASH2 | |
| Cytomap | 8p11.23 | |
| Gene Type | protein-coding | GO ID | GO:0002376 | UniProtAcc | Q9UBL3 |
Top |
Malignant transformation analysis |
| Identification of the aberrant gene expression in precancerous and cancerous lesions by comparing the gene expression of stem-like cells in diseased tissues with normal stem cells |
| Entrez ID | Symbol | Replicates | Species | Organ | Tissue | Adj P-value | Log2FC | Malignancy |
| 9070 | ASH2L | LZE4T | Human | Esophagus | ESCC | 1.29e-09 | 2.19e-01 | 0.0811 |
| 9070 | ASH2L | LZE24T | Human | Esophagus | ESCC | 1.47e-13 | 2.72e-01 | 0.0596 |
| 9070 | ASH2L | P1T-E | Human | Esophagus | ESCC | 3.37e-04 | 2.94e-01 | 0.0875 |
| 9070 | ASH2L | P2T-E | Human | Esophagus | ESCC | 8.15e-25 | 3.84e-01 | 0.1177 |
| 9070 | ASH2L | P4T-E | Human | Esophagus | ESCC | 6.83e-13 | 2.81e-01 | 0.1323 |
| 9070 | ASH2L | P5T-E | Human | Esophagus | ESCC | 3.83e-07 | 7.23e-02 | 0.1327 |
| 9070 | ASH2L | P8T-E | Human | Esophagus | ESCC | 1.82e-06 | 1.86e-01 | 0.0889 |
| 9070 | ASH2L | P9T-E | Human | Esophagus | ESCC | 4.99e-07 | 8.50e-02 | 0.1131 |
| 9070 | ASH2L | P10T-E | Human | Esophagus | ESCC | 6.59e-24 | 2.67e-01 | 0.116 |
| 9070 | ASH2L | P11T-E | Human | Esophagus | ESCC | 2.30e-12 | 3.82e-01 | 0.1426 |
| 9070 | ASH2L | P12T-E | Human | Esophagus | ESCC | 1.02e-12 | 2.91e-01 | 0.1122 |
| 9070 | ASH2L | P15T-E | Human | Esophagus | ESCC | 1.14e-53 | 1.15e+00 | 0.1149 |
| 9070 | ASH2L | P16T-E | Human | Esophagus | ESCC | 1.81e-16 | 2.38e-01 | 0.1153 |
| 9070 | ASH2L | P17T-E | Human | Esophagus | ESCC | 1.70e-04 | 2.59e-01 | 0.1278 |
| 9070 | ASH2L | P20T-E | Human | Esophagus | ESCC | 4.26e-20 | 3.62e-01 | 0.1124 |
| 9070 | ASH2L | P21T-E | Human | Esophagus | ESCC | 1.28e-23 | 1.78e-01 | 0.1617 |
| 9070 | ASH2L | P22T-E | Human | Esophagus | ESCC | 9.65e-08 | 1.15e-01 | 0.1236 |
| 9070 | ASH2L | P23T-E | Human | Esophagus | ESCC | 4.98e-16 | 3.67e-01 | 0.108 |
| 9070 | ASH2L | P24T-E | Human | Esophagus | ESCC | 2.11e-13 | 2.05e-01 | 0.1287 |
| 9070 | ASH2L | P26T-E | Human | Esophagus | ESCC | 1.18e-08 | 1.82e-01 | 0.1276 |
| Page: 1 2 3 4 5 |
| Tissue | Expression Dynamics | Abbreviation |
| Esophagus | 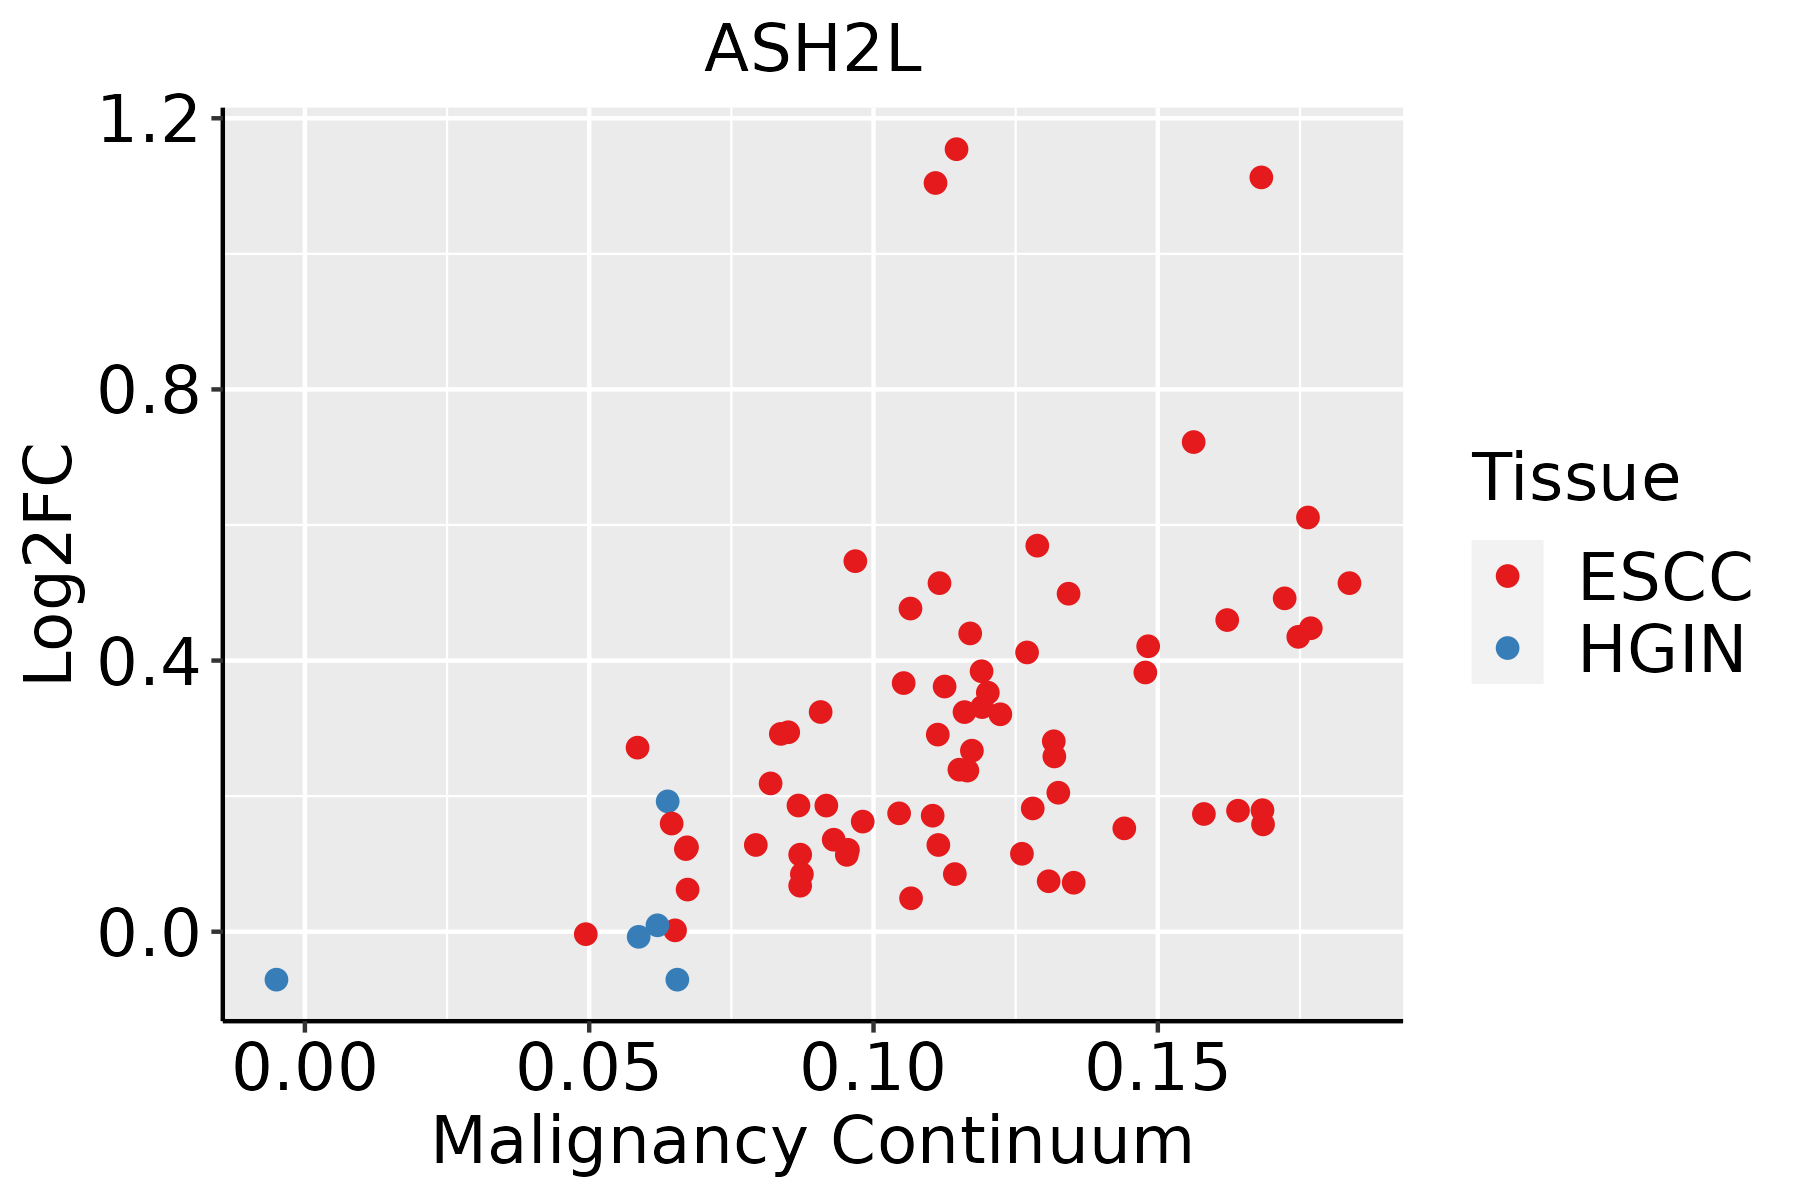 | ESCC: Esophageal squamous cell carcinoma |
| HGIN: High-grade intraepithelial neoplasias | ||
| LGIN: Low-grade intraepithelial neoplasias | ||
| Oral Cavity | 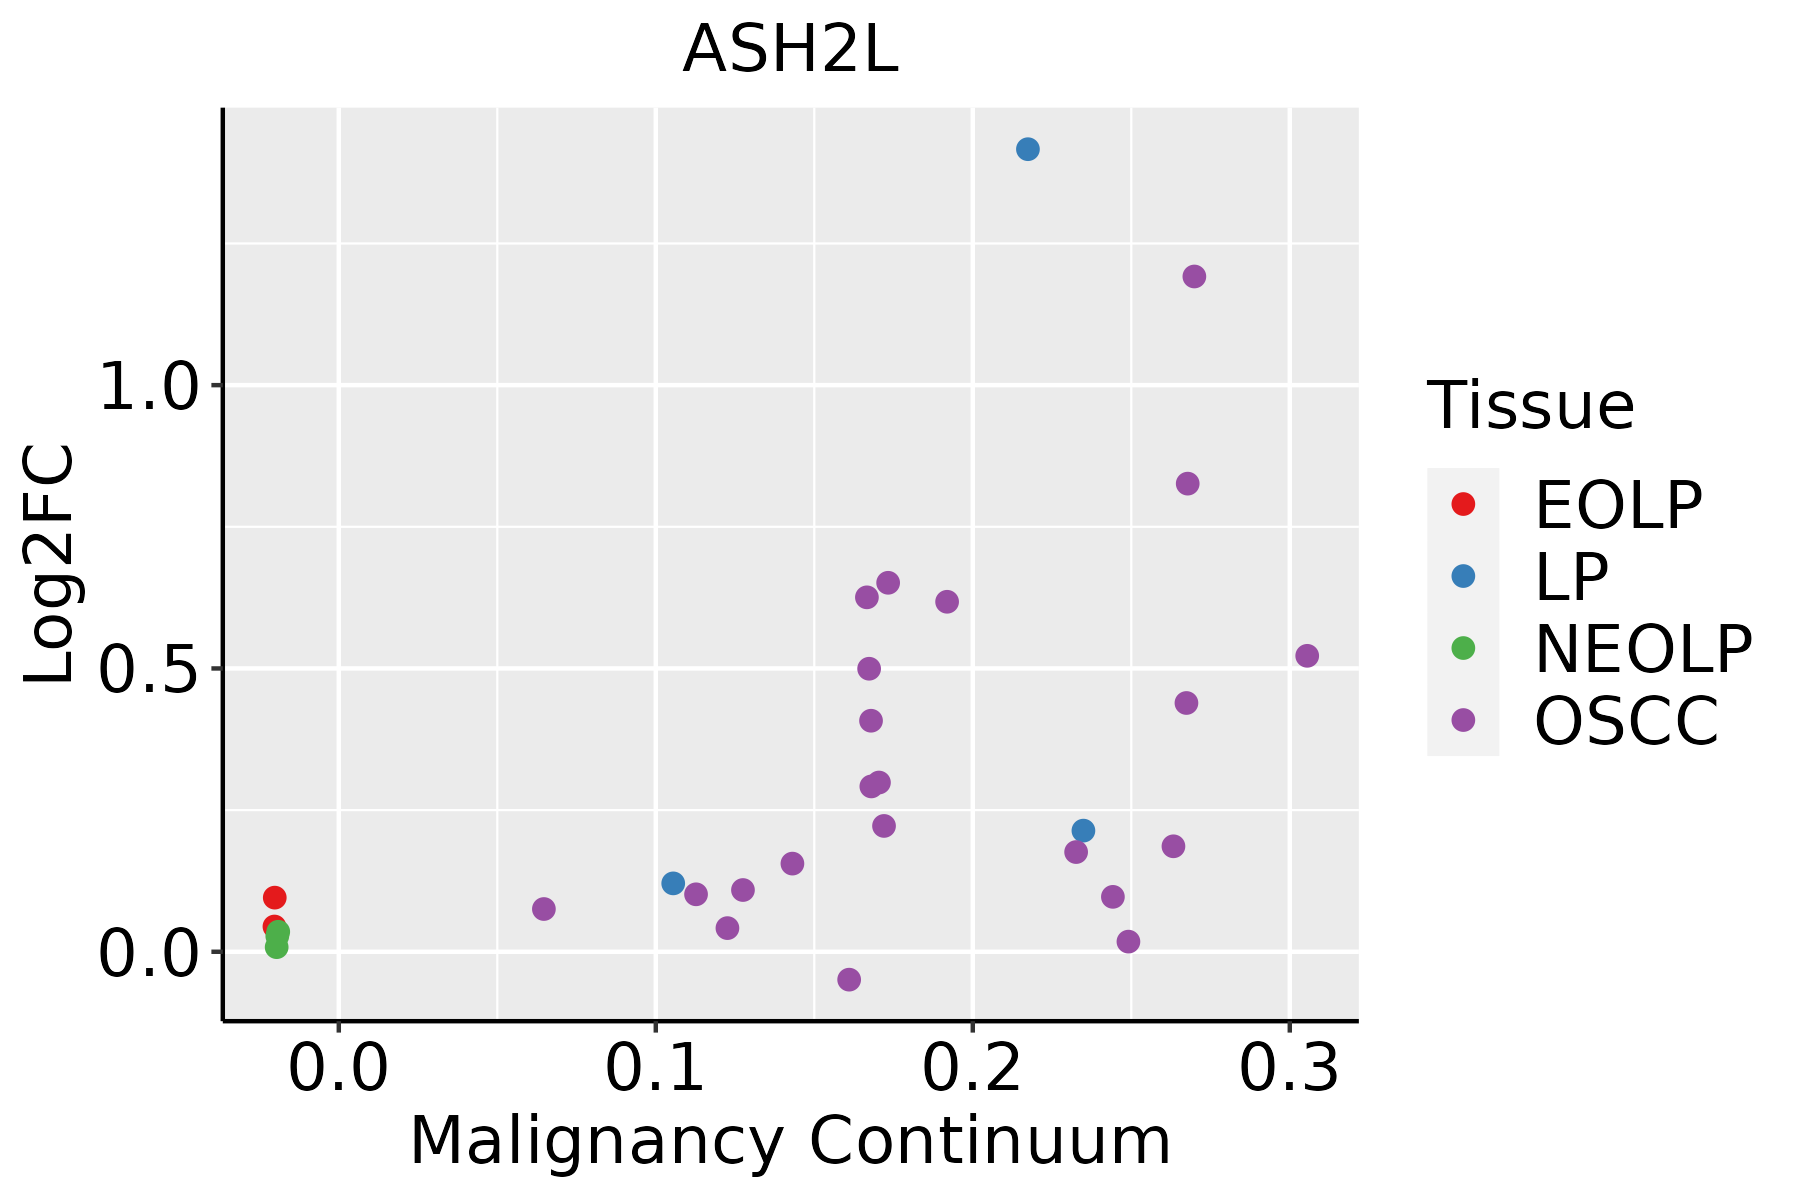 | EOLP: Erosive Oral lichen planus |
| LP: leukoplakia | ||
| NEOLP: Non-erosive oral lichen planus | ||
| OSCC: Oral squamous cell carcinoma | ||
| Skin | 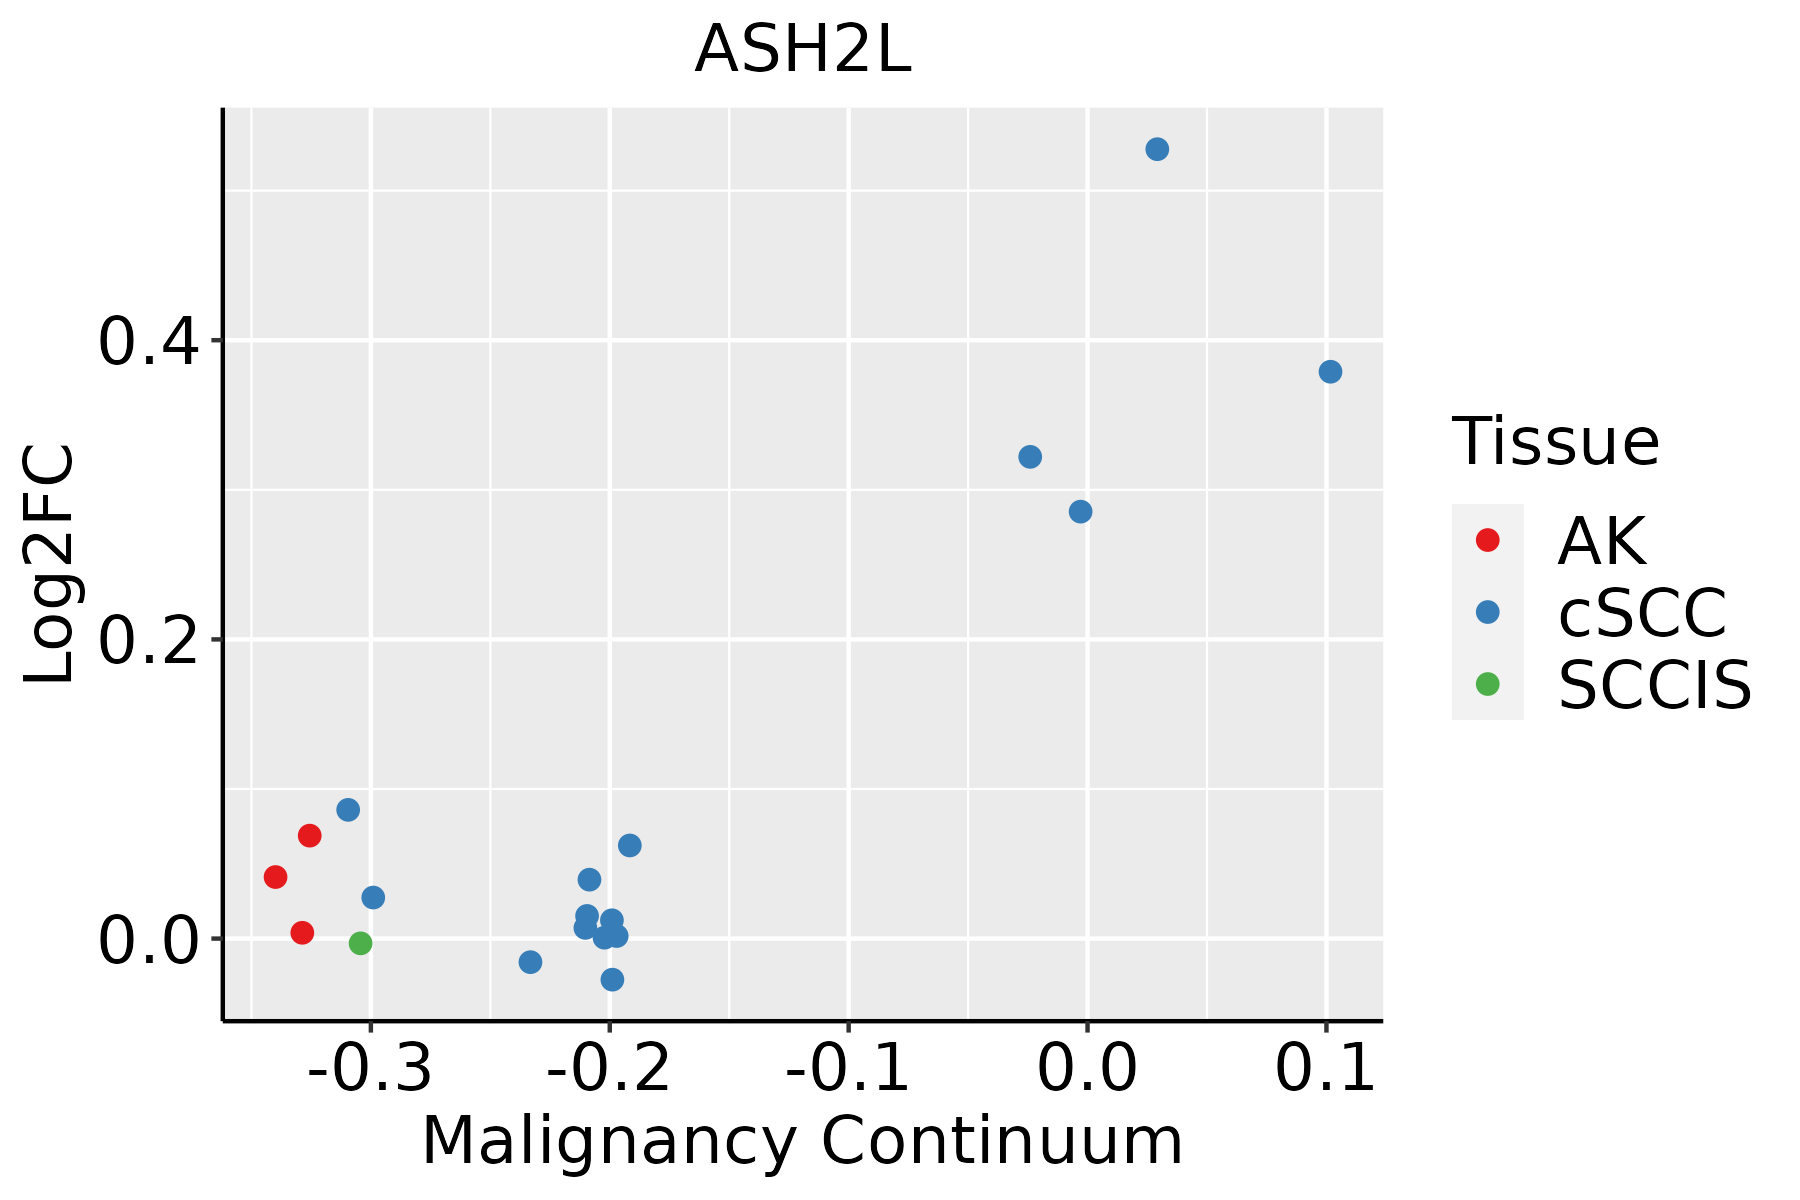 | AK: Actinic keratosis |
| cSCC: Cutaneous squamous cell carcinoma | ||
| SCCIS:squamous cell carcinoma in situ | ||
| Thyroid | 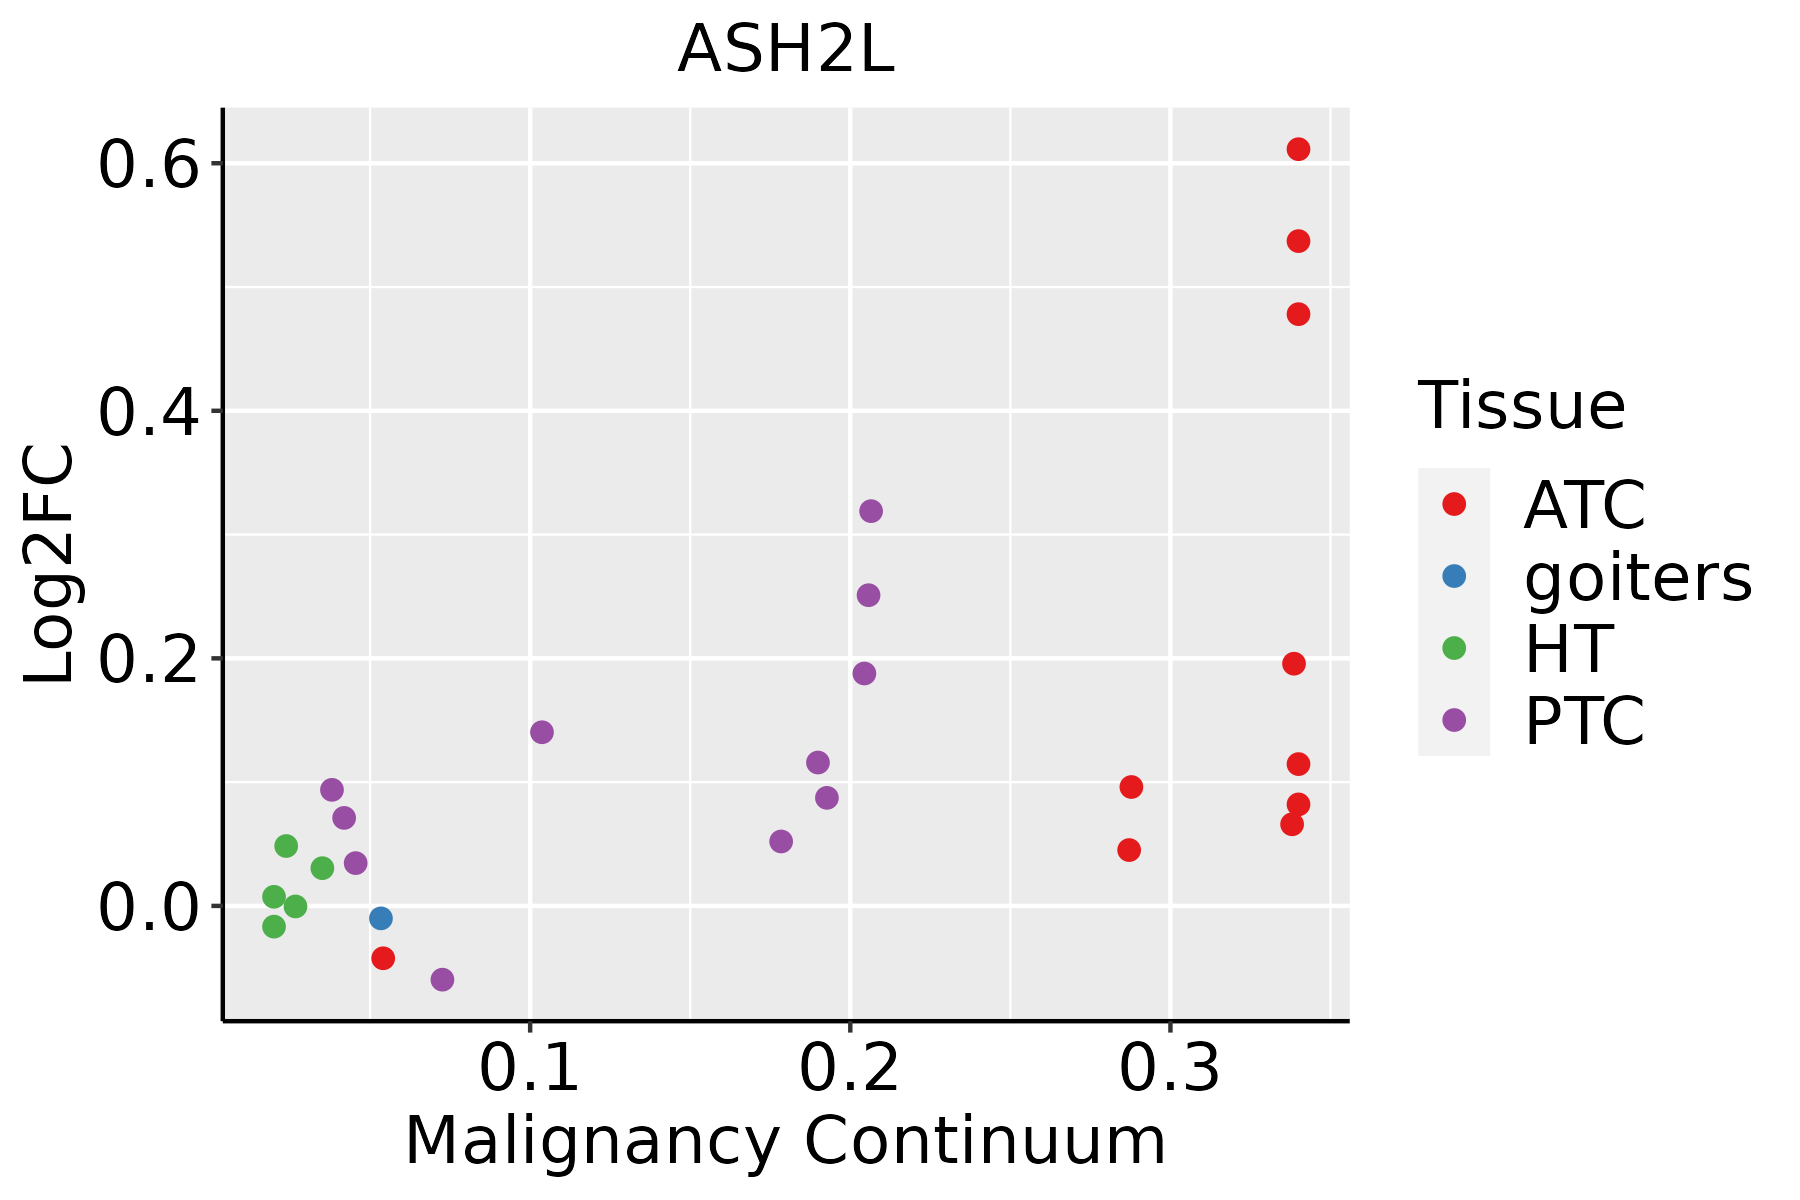 | ATC: Anaplastic thyroid cancer |
| HT: Hashimoto's thyroiditis | ||
| PTC: Papillary thyroid cancer |
| ∗log2FC in expression of this searched gene in stem-like cells from each diseased tissue sample relative to stem-like cells in normal samples in each tissue plotted against the malignancy continuum. Samples are colored based on if they are from different disease stage. |
Top |
Malignant transformation related pathway analysis |
| Find out the enriched GO biological processes and KEGG pathways involved in transition from healthy to precancer to cancer |
| Tissue | Disease Stage | Enriched GO biological Processes |
| Colorectum | AD |  |
| Colorectum | SER |  |
| Colorectum | MSS |  |
| Colorectum | MSI-H |  |
| Colorectum | FAP |  |
| ∗Top 15 enriched GO BP terms are showed in the bar plot of each disease state in each tissue. Each row represents a significant GO biological process which is colored according to the -log10(p.adjust). |
| Page: 1 2 3 4 5 6 7 8 9 |
| GO ID | Tissue | Disease Stage | Description | Gene Ratio | Bg Ratio | pvalue | p.adjust | Count |
| GO:001657015 | Esophagus | ESCC | histone modification | 323/8552 | 463/18723 | 2.61e-26 | 7.88e-24 | 323 |
| GO:001820514 | Esophagus | ESCC | peptidyl-lysine modification | 259/8552 | 376/18723 | 3.90e-20 | 5.26e-18 | 259 |
| GO:00434143 | Esophagus | ESCC | macromolecule methylation | 199/8552 | 316/18723 | 3.44e-10 | 9.57e-09 | 199 |
| GO:00322592 | Esophagus | ESCC | methylation | 222/8552 | 364/18723 | 2.26e-09 | 5.09e-08 | 222 |
| GO:000647914 | Esophagus | ESCC | protein methylation | 115/8552 | 181/18723 | 9.07e-07 | 1.16e-05 | 115 |
| GO:000821314 | Esophagus | ESCC | protein alkylation | 115/8552 | 181/18723 | 9.07e-07 | 1.16e-05 | 115 |
| GO:00165718 | Esophagus | ESCC | histone methylation | 89/8552 | 141/18723 | 2.17e-05 | 1.87e-04 | 89 |
| GO:003496814 | Esophagus | ESCC | histone lysine methylation | 72/8552 | 115/18723 | 1.85e-04 | 1.18e-03 | 72 |
| GO:001802214 | Esophagus | ESCC | peptidyl-lysine methylation | 79/8552 | 131/18723 | 5.17e-04 | 2.86e-03 | 79 |
| GO:00436275 | Esophagus | ESCC | response to estrogen | 45/8552 | 75/18723 | 8.75e-03 | 3.08e-02 | 45 |
| GO:00165707 | Oral cavity | OSCC | histone modification | 270/7305 | 463/18723 | 1.59e-17 | 1.50e-15 | 270 |
| GO:00182056 | Oral cavity | OSCC | peptidyl-lysine modification | 216/7305 | 376/18723 | 2.32e-13 | 1.16e-11 | 216 |
| GO:00064797 | Oral cavity | OSCC | protein methylation | 92/7305 | 181/18723 | 7.86e-04 | 4.26e-03 | 92 |
| GO:00082137 | Oral cavity | OSCC | protein alkylation | 92/7305 | 181/18723 | 7.86e-04 | 4.26e-03 | 92 |
| GO:00434142 | Oral cavity | OSCC | macromolecule methylation | 149/7305 | 316/18723 | 1.82e-03 | 8.60e-03 | 149 |
| GO:00165717 | Oral cavity | OSCC | histone methylation | 72/7305 | 141/18723 | 2.36e-03 | 1.04e-02 | 72 |
| GO:00322591 | Oral cavity | OSCC | methylation | 168/7305 | 364/18723 | 3.03e-03 | 1.31e-02 | 168 |
| GO:00349687 | Oral cavity | OSCC | histone lysine methylation | 58/7305 | 115/18723 | 8.25e-03 | 3.01e-02 | 58 |
| GO:001820513 | Oral cavity | LP | peptidyl-lysine modification | 136/4623 | 376/18723 | 3.64e-07 | 1.06e-05 | 136 |
| GO:001657014 | Oral cavity | LP | histone modification | 152/4623 | 463/18723 | 4.04e-05 | 5.90e-04 | 152 |
| Page: 1 2 3 |
| Pathway ID | Tissue | Disease Stage | Description | Gene Ratio | Bg Ratio | pvalue | p.adjust | qvalue | Count |
| Page: 1 |
Top |
Cell-cell communication analysis |
| Identification of potential cell-cell interactions between two cell types and their ligand-receptor pairs for different disease states |
| Ligand | Receptor | LRpair | Pathway | Tissue | Disease Stage |
| Page: 1 |
Top |
Single-cell gene regulatory network inference analysis |
| Find out the significant the regulons (TFs) and the target genes of each regulon across cell types for different disease states |
| TF | Cell Type | Tissue | Disease Stage | Target Gene | RSS | Regulon Activity |
| ∗The dot plots of a searched regulon are shown for all cell subpopulations in each disease state of each tissue based on the regulon specific score inferred using pySCENIC and by calculating the average expression. |
| Page: 1 |
Top |
Somatic mutation of malignant transformation related genes |
| Annotation of somatic variants for genes involved in malignant transformation |
| Hugo Symbol | Variant Class | Variant Classification | dbSNP RS | HGVSc | HGVSp | HGVSp Short | SWISSPROT | BIOTYPE | SIFT | PolyPhen | Tumor Sample Barcode | Tissue | Histology | Sex | Age | Stage | Therapy Types | Drugs | Outcome |
| ASH2L | SNV | Missense_Mutation | c.1849N>A | p.Glu617Lys | p.E617K | Q9UBL3 | protein_coding | deleterious(0.03) | benign(0.152) | TCGA-A2-A0EY-01 | Breast | breast invasive carcinoma | Female | <65 | I/II | Chemotherapy | adriamycin | SD | |
| ASH2L | SNV | Missense_Mutation | c.553N>A | p.Glu185Lys | p.E185K | Q9UBL3 | protein_coding | tolerated(0.65) | possibly_damaging(0.572) | TCGA-A2-A0YK-01 | Breast | breast invasive carcinoma | Female | <65 | I/II | Chemotherapy | cytoxan | SD | |
| ASH2L | SNV | Missense_Mutation | rs373871950 | c.1018G>A | p.Gly340Ser | p.G340S | Q9UBL3 | protein_coding | deleterious(0.04) | benign(0.045) | TCGA-A7-A13H-01 | Breast | breast invasive carcinoma | Female | <65 | I/II | Hormone Therapy | anastrozole | PD |
| ASH2L | SNV | Missense_Mutation | c.1749G>T | p.Lys583Asn | p.K583N | Q9UBL3 | protein_coding | deleterious(0) | possibly_damaging(0.521) | TCGA-AN-A0FJ-01 | Breast | breast invasive carcinoma | Female | <65 | III/IV | Unknown | Unknown | SD | |
| ASH2L | SNV | Missense_Mutation | c.570N>T | p.Met190Ile | p.M190I | Q9UBL3 | protein_coding | tolerated(0.05) | possibly_damaging(0.822) | TCGA-B6-A0RU-01 | Breast | breast invasive carcinoma | Female | <65 | I/II | Unknown | Unknown | PD | |
| ASH2L | SNV | Missense_Mutation | novel | c.718C>A | p.Pro240Thr | p.P240T | Q9UBL3 | protein_coding | tolerated(0.23) | probably_damaging(0.994) | TCGA-BH-A18Q-01 | Breast | breast invasive carcinoma | Female | <65 | I/II | Unknown | Unknown | SD |
| ASH2L | SNV | Missense_Mutation | novel | c.1810N>A | p.Glu604Lys | p.E604K | Q9UBL3 | protein_coding | deleterious(0.05) | probably_damaging(0.971) | TCGA-ZJ-AAXU-01 | Cervix | cervical & endocervical cancer | Female | <65 | I/II | Unknown | Unknown | SD |
| ASH2L | SNV | Missense_Mutation | c.388N>T | p.Gly130Cys | p.G130C | Q9UBL3 | protein_coding | deleterious(0) | benign(0.325) | TCGA-A6-4105-01 | Colorectum | colon adenocarcinoma | Male | >=65 | I/II | Unknown | Unknown | PD | |
| ASH2L | SNV | Missense_Mutation | c.1727N>C | p.Ile576Thr | p.I576T | Q9UBL3 | protein_coding | deleterious(0.01) | benign(0.081) | TCGA-AA-3811-01 | Colorectum | colon adenocarcinoma | Female | >=65 | III/IV | Unknown | Unknown | PD | |
| ASH2L | SNV | Missense_Mutation | novel | c.944G>A | p.Arg315Gln | p.R315Q | Q9UBL3 | protein_coding | tolerated(0.09) | benign(0.005) | TCGA-AA-3877-01 | Colorectum | colon adenocarcinoma | Female | >=65 | I/II | Unknown | Unknown | SD |
| Page: 1 2 3 4 5 6 7 |
Top |
Related drugs of malignant transformation related genes |
| Identification of chemicals and drugs interact with genes involved in malignant transfromation |
| (DGIdb 4.0) |
| Entrez ID | Symbol | Category | Interaction Types | Drug Claim Name | Drug Name | PMIDs |
| Page: 1 |

Copyright 2023-Present -The University of Texas Health Science Center at Houston |