
|
|||||
|
 | |
| |
| |
| |
| |
| |
|
Gene: ASH1L |
Gene summary for ASH1L |
| Gene information | Species | Human | Gene symbol | ASH1L | Gene ID | 55870 |
| Gene name | ASH1 like histone lysine methyltransferase | |
| Gene Alias | ASH1 | |
| Cytomap | 1q22 | |
| Gene Type | protein-coding | GO ID | GO:0000003 | UniProtAcc | Q9NR48 |
Top |
Malignant transformation analysis |
| Identification of the aberrant gene expression in precancerous and cancerous lesions by comparing the gene expression of stem-like cells in diseased tissues with normal stem cells |
| Entrez ID | Symbol | Replicates | Species | Organ | Tissue | Adj P-value | Log2FC | Malignancy |
| 55870 | ASH1L | GSM4909293 | Human | Breast | IDC | 6.92e-04 | 2.34e-01 | 0.1581 |
| 55870 | ASH1L | GSM4909296 | Human | Breast | IDC | 1.70e-08 | -2.48e-01 | 0.1524 |
| 55870 | ASH1L | GSM4909297 | Human | Breast | IDC | 1.11e-06 | -2.43e-01 | 0.1517 |
| 55870 | ASH1L | GSM4909298 | Human | Breast | IDC | 9.13e-06 | 3.06e-01 | 0.1551 |
| 55870 | ASH1L | GSM4909301 | Human | Breast | IDC | 2.39e-17 | 5.92e-01 | 0.1577 |
| 55870 | ASH1L | GSM4909311 | Human | Breast | IDC | 2.83e-19 | -2.91e-01 | 0.1534 |
| 55870 | ASH1L | GSM4909312 | Human | Breast | IDC | 2.54e-04 | -1.75e-01 | 0.1552 |
| 55870 | ASH1L | GSM4909317 | Human | Breast | IDC | 5.57e-03 | 2.79e-01 | 0.1355 |
| 55870 | ASH1L | GSM4909319 | Human | Breast | IDC | 5.48e-22 | -2.98e-01 | 0.1563 |
| 55870 | ASH1L | GSM4909321 | Human | Breast | IDC | 3.52e-11 | -2.55e-01 | 0.1559 |
| 55870 | ASH1L | M2 | Human | Breast | IDC | 6.24e-03 | -2.03e-01 | 0.21 |
| 55870 | ASH1L | M5 | Human | Breast | IDC | 2.21e-02 | 5.23e-01 | 0.1598 |
| 55870 | ASH1L | NCCBC14 | Human | Breast | DCIS | 7.57e-03 | 5.78e-02 | 0.2021 |
| 55870 | ASH1L | NCCBC5 | Human | Breast | DCIS | 8.48e-03 | -2.03e-01 | 0.2046 |
| 55870 | ASH1L | P1 | Human | Breast | IDC | 1.07e-08 | 2.77e-02 | 0.1527 |
| 55870 | ASH1L | DCIS2 | Human | Breast | DCIS | 2.19e-54 | 3.53e-01 | 0.0085 |
| 55870 | ASH1L | CA_HPV_1 | Human | Cervix | CC | 4.71e-04 | -1.69e-01 | 0.0264 |
| 55870 | ASH1L | CA_HPV_2 | Human | Cervix | CC | 1.43e-03 | 2.87e-01 | 0.0391 |
| 55870 | ASH1L | CCI_1 | Human | Cervix | CC | 4.10e-20 | 2.23e+00 | 0.528 |
| 55870 | ASH1L | CCI_2 | Human | Cervix | CC | 1.14e-19 | 1.82e+00 | 0.5249 |
| Page: 1 2 3 4 5 6 7 8 9 10 11 12 13 14 15 |
| Tissue | Expression Dynamics | Abbreviation |
| Breast | 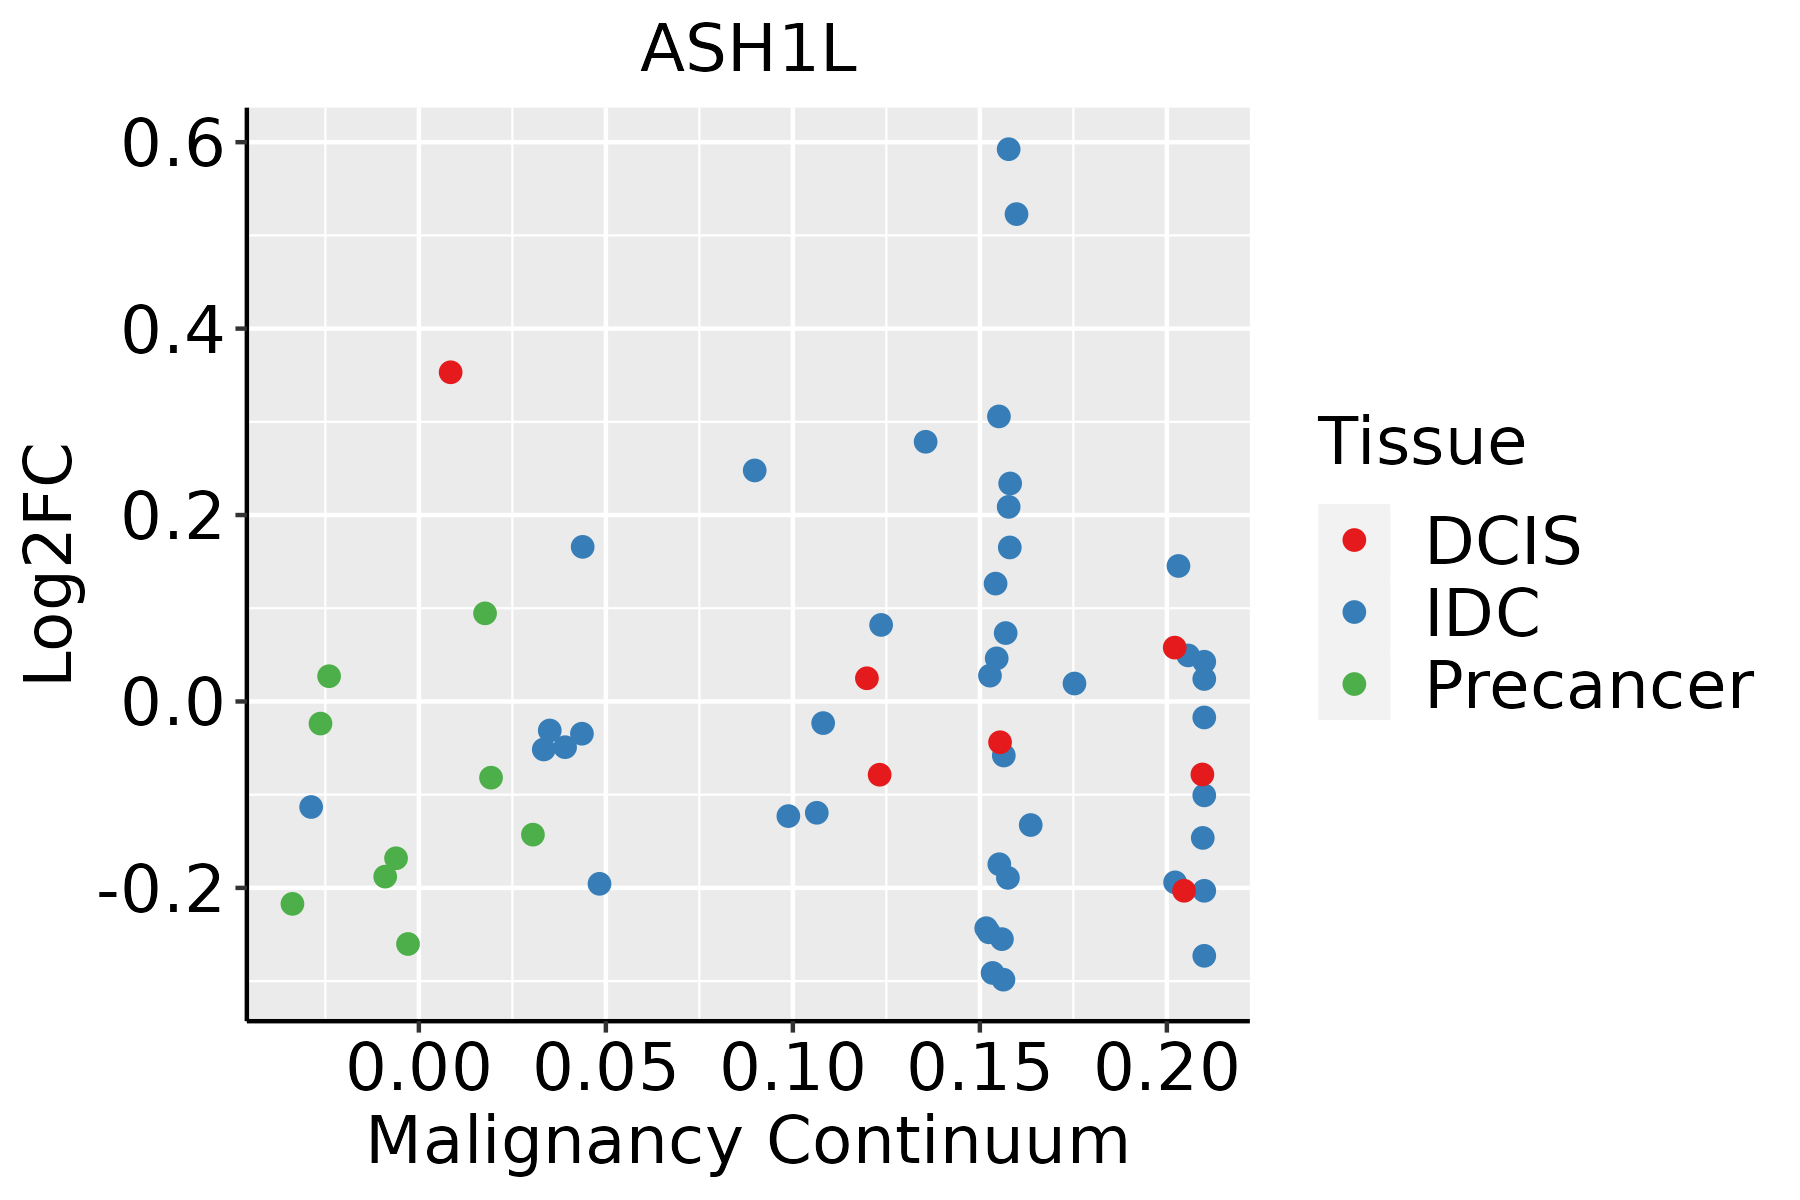 | IDC: Invasive ductal carcinoma |
| DCIS: Ductal carcinoma in situ | ||
| Precancer(BRCA1-mut): Precancerous lesion from BRCA1 mutation carriers | ||
| Cervix | 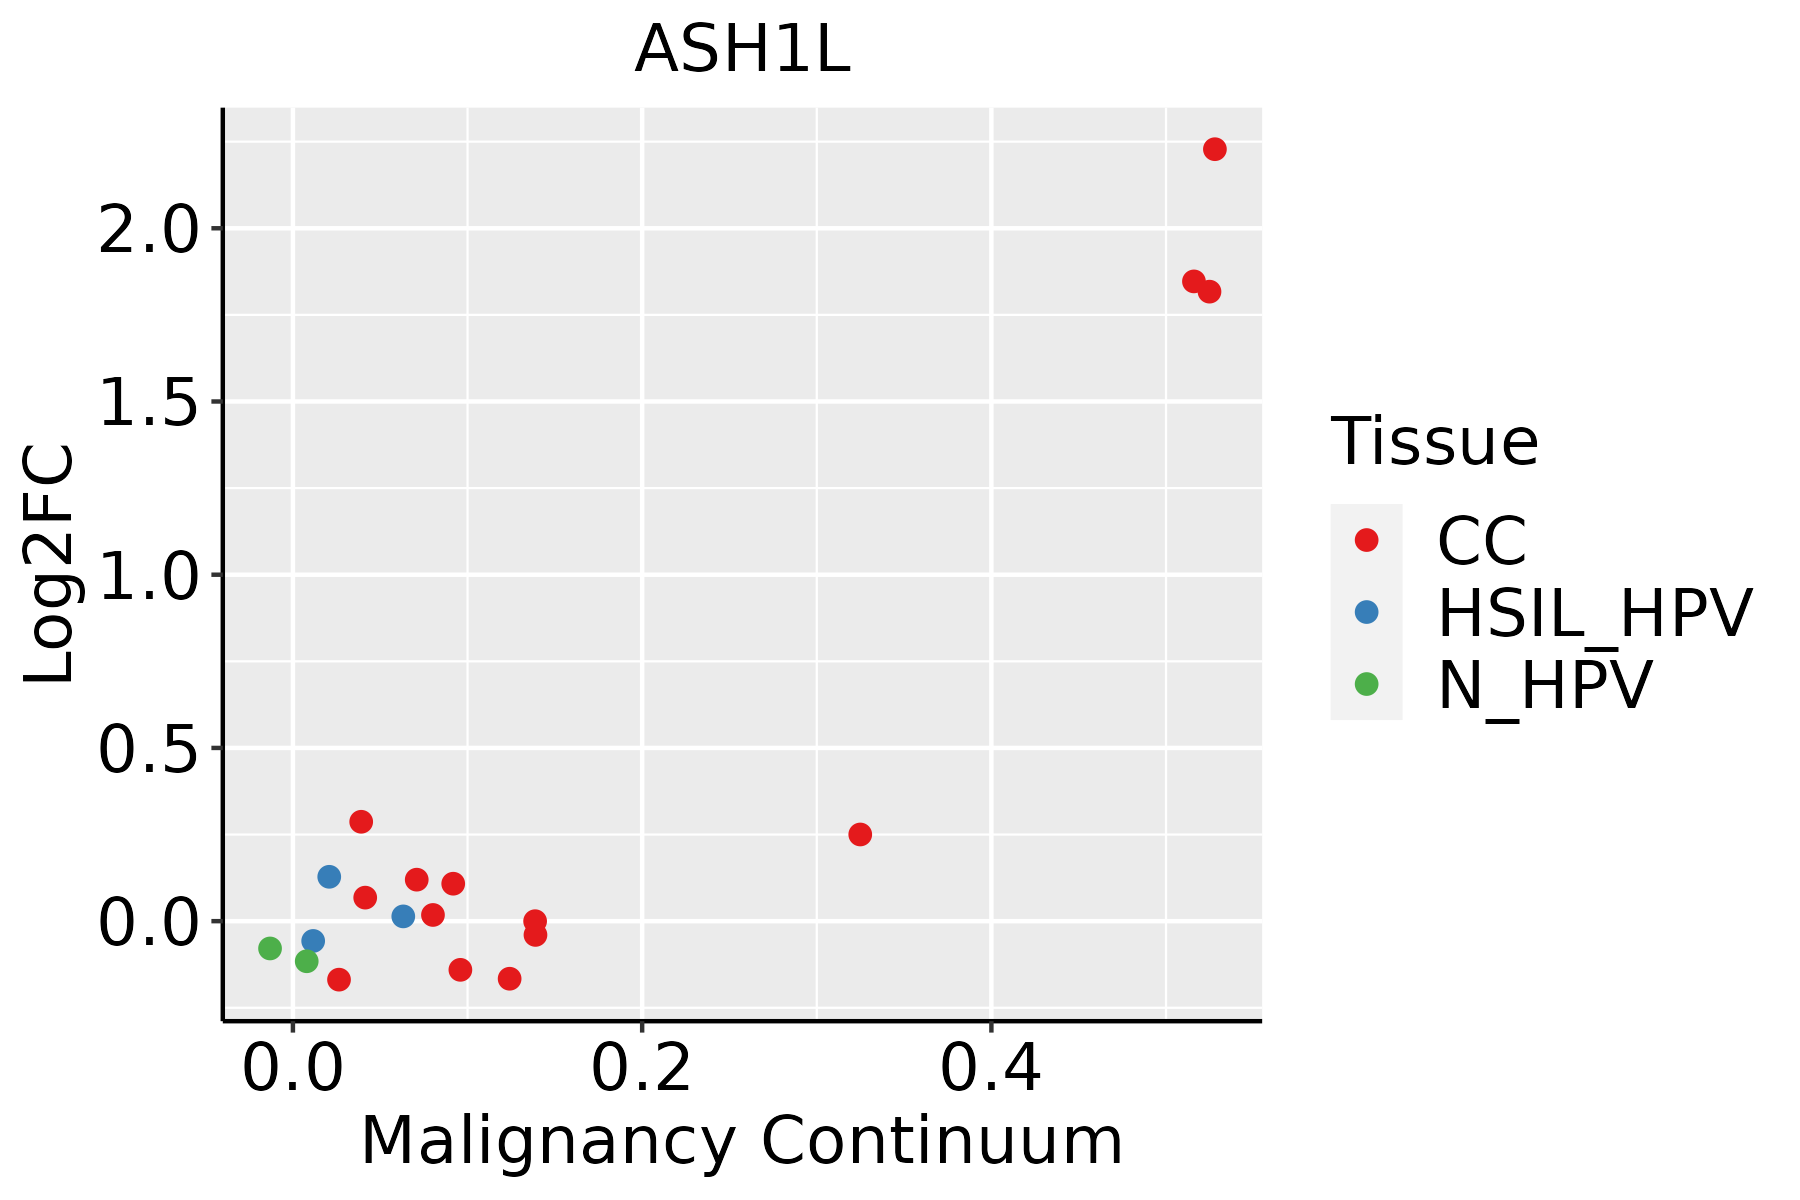 | CC: Cervix cancer |
| HSIL_HPV: HPV-infected high-grade squamous intraepithelial lesions | ||
| N_HPV: HPV-infected normal cervix | ||
| Colorectum (GSE201348) |  | FAP: Familial adenomatous polyposis |
| CRC: Colorectal cancer | ||
| Colorectum (HTA11) |  | AD: Adenomas |
| SER: Sessile serrated lesions | ||
| MSI-H: Microsatellite-high colorectal cancer | ||
| MSS: Microsatellite stable colorectal cancer | ||
| Endometrium |  | AEH: Atypical endometrial hyperplasia |
| EEC: Endometrioid Cancer | ||
| Esophagus |  | ESCC: Esophageal squamous cell carcinoma |
| HGIN: High-grade intraepithelial neoplasias | ||
| LGIN: Low-grade intraepithelial neoplasias | ||
| GC | 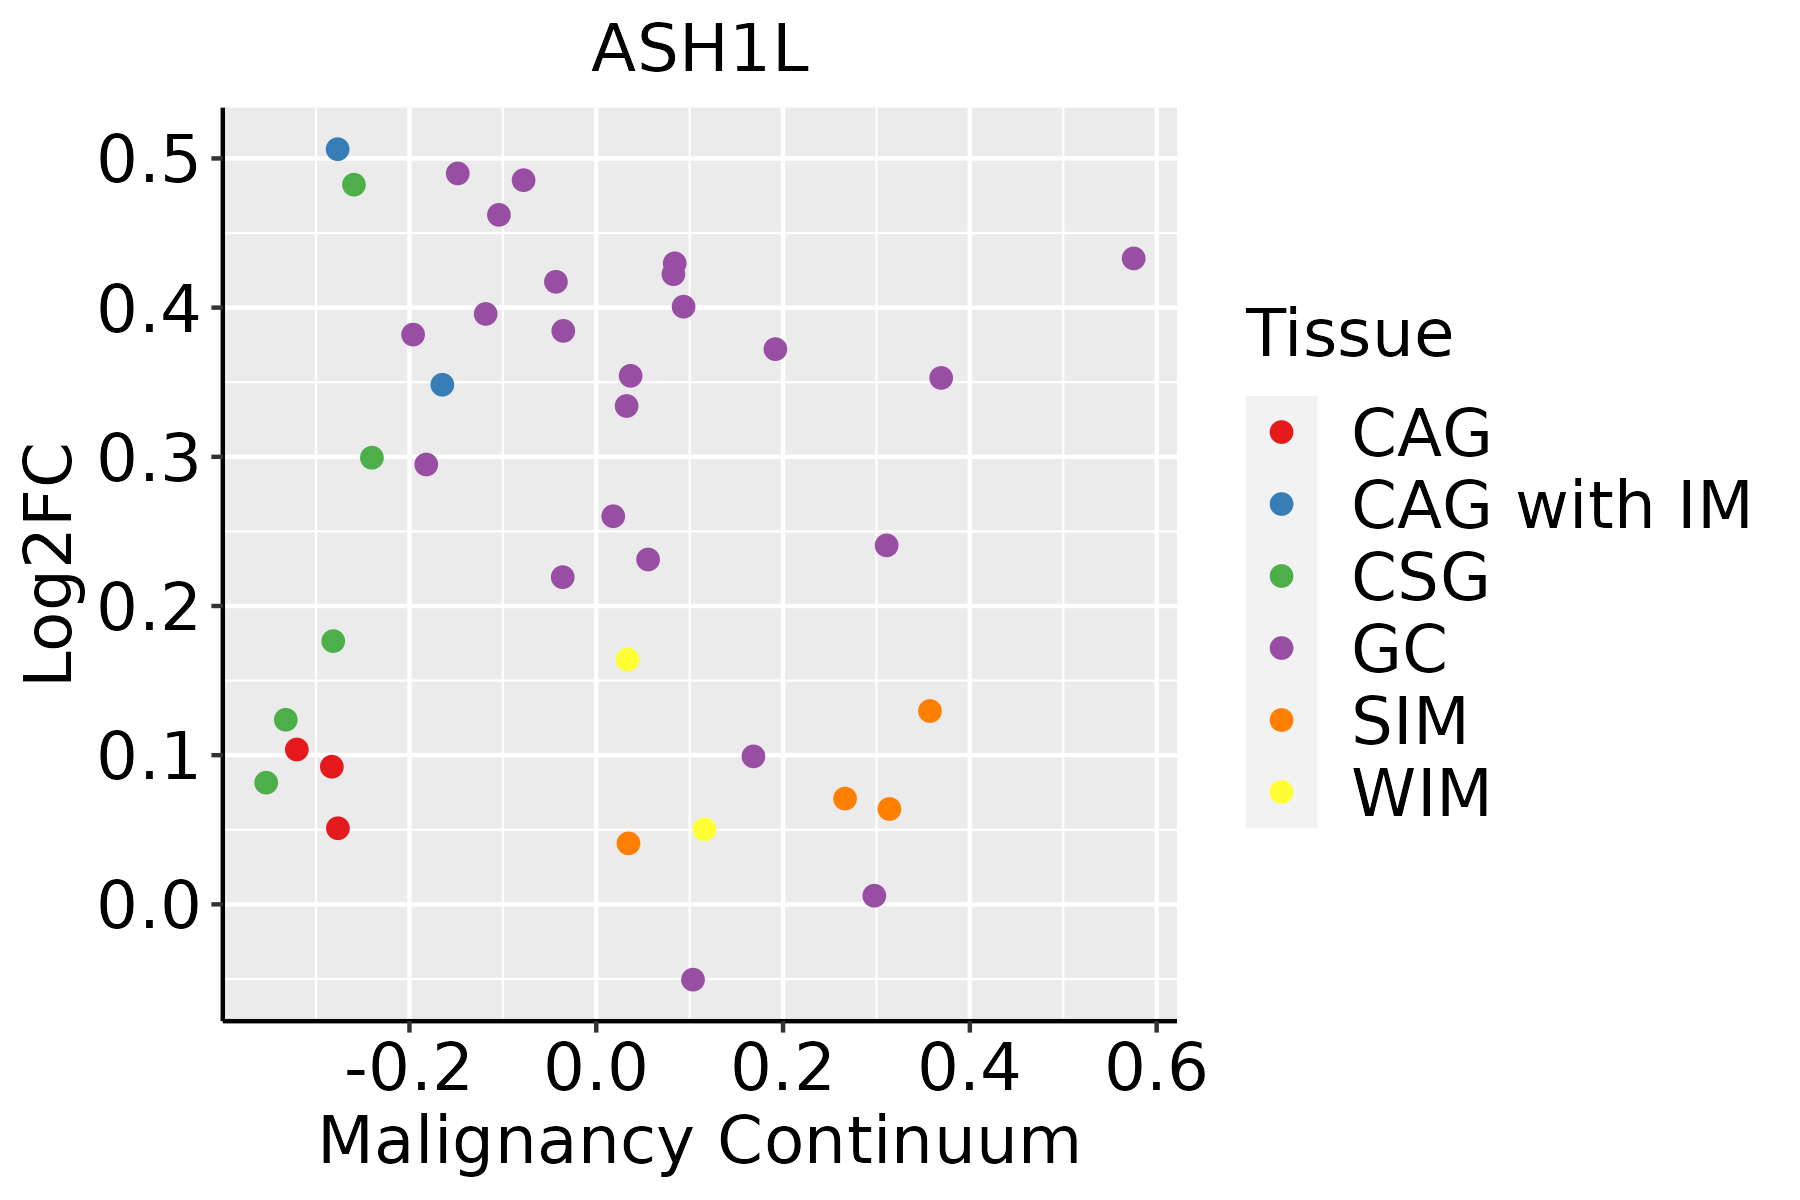 | CAG: Chronic atrophic gastritis |
| CAG with IM: Chronic atrophic gastritis with intestinal metaplasia | ||
| CSG: Chronic superficial gastritis | ||
| GC: Gastric cancer | ||
| SIM: Severe intestinal metaplasia | ||
| WIM: Wild intestinal metaplasia | ||
| Liver |  | HCC: Hepatocellular carcinoma |
| NAFLD: Non-alcoholic fatty liver disease | ||
| Lung | 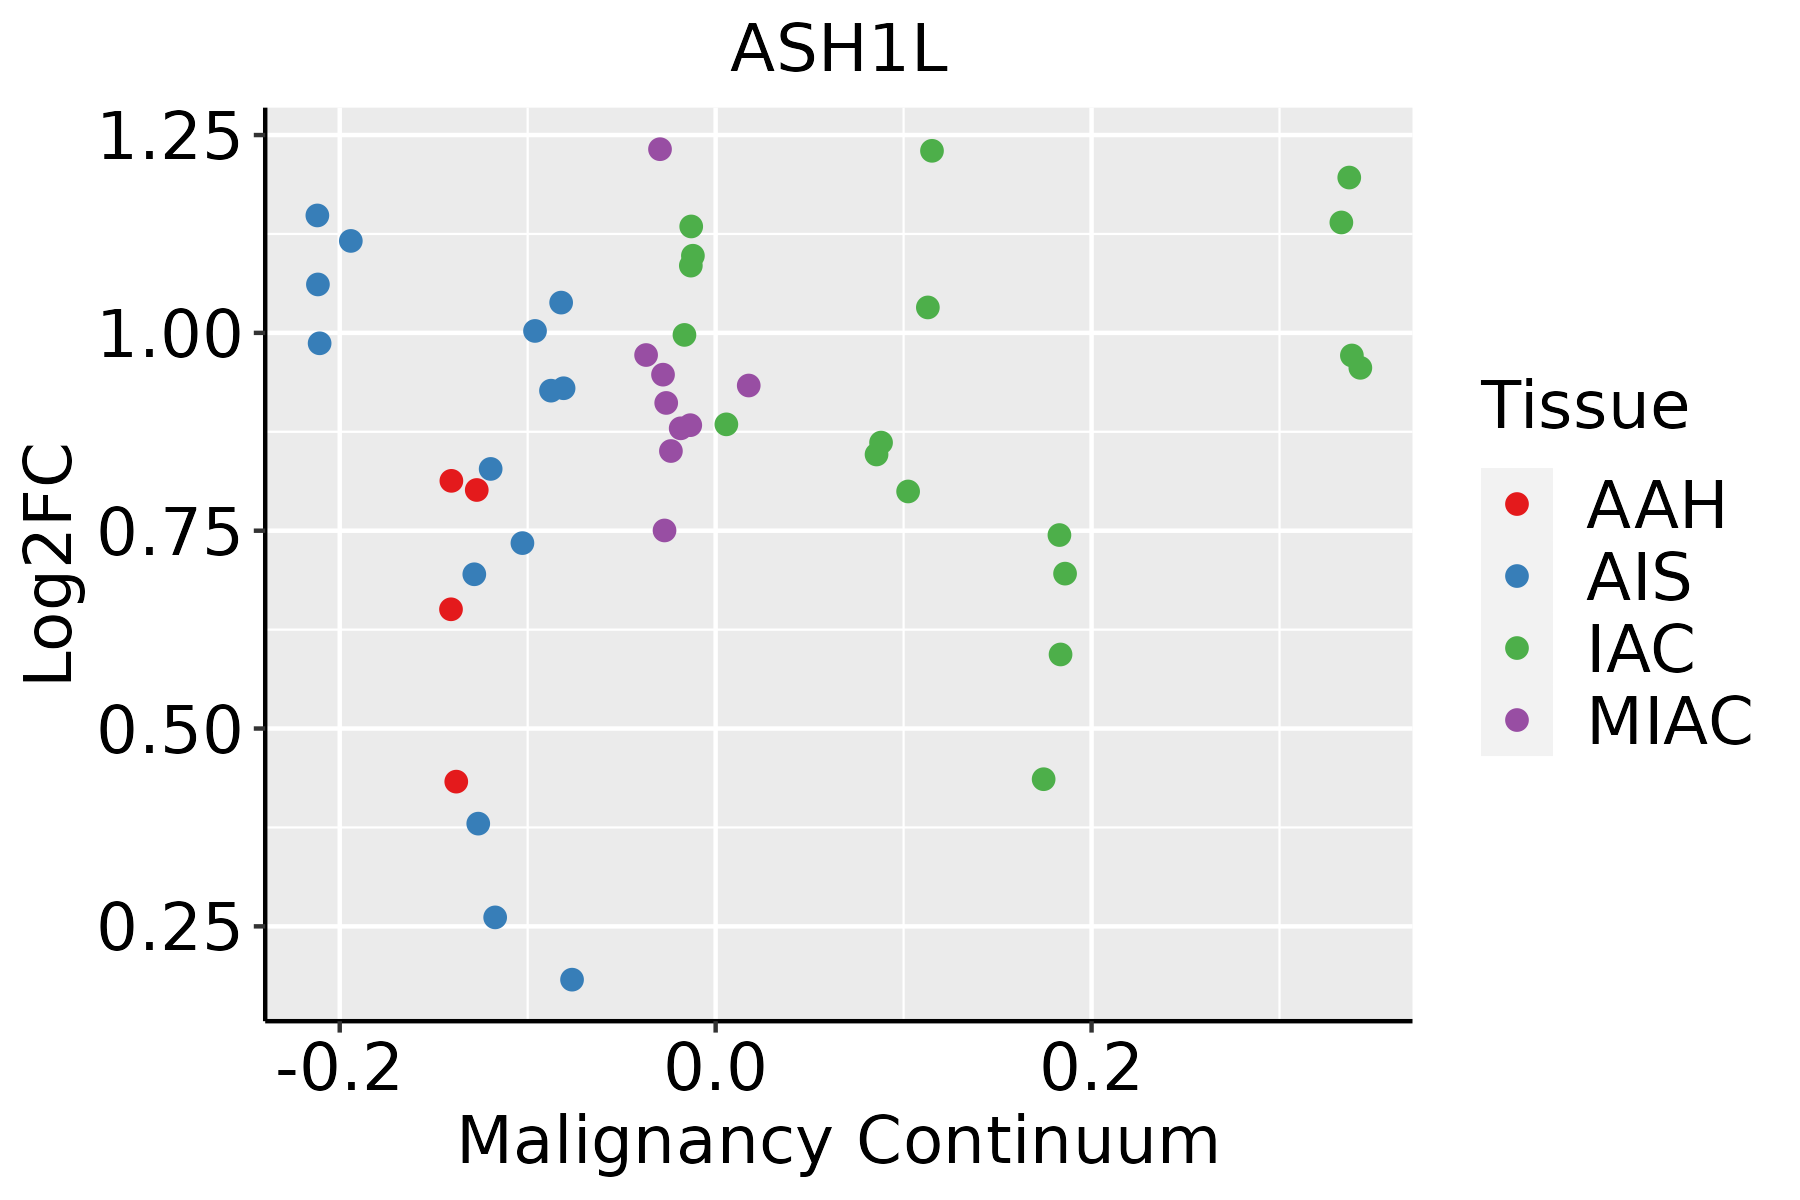 | AAH: Atypical adenomatous hyperplasia |
| AIS: Adenocarcinoma in situ | ||
| IAC: Invasive lung adenocarcinoma | ||
| MIA: Minimally invasive adenocarcinoma | ||
| Oral Cavity | 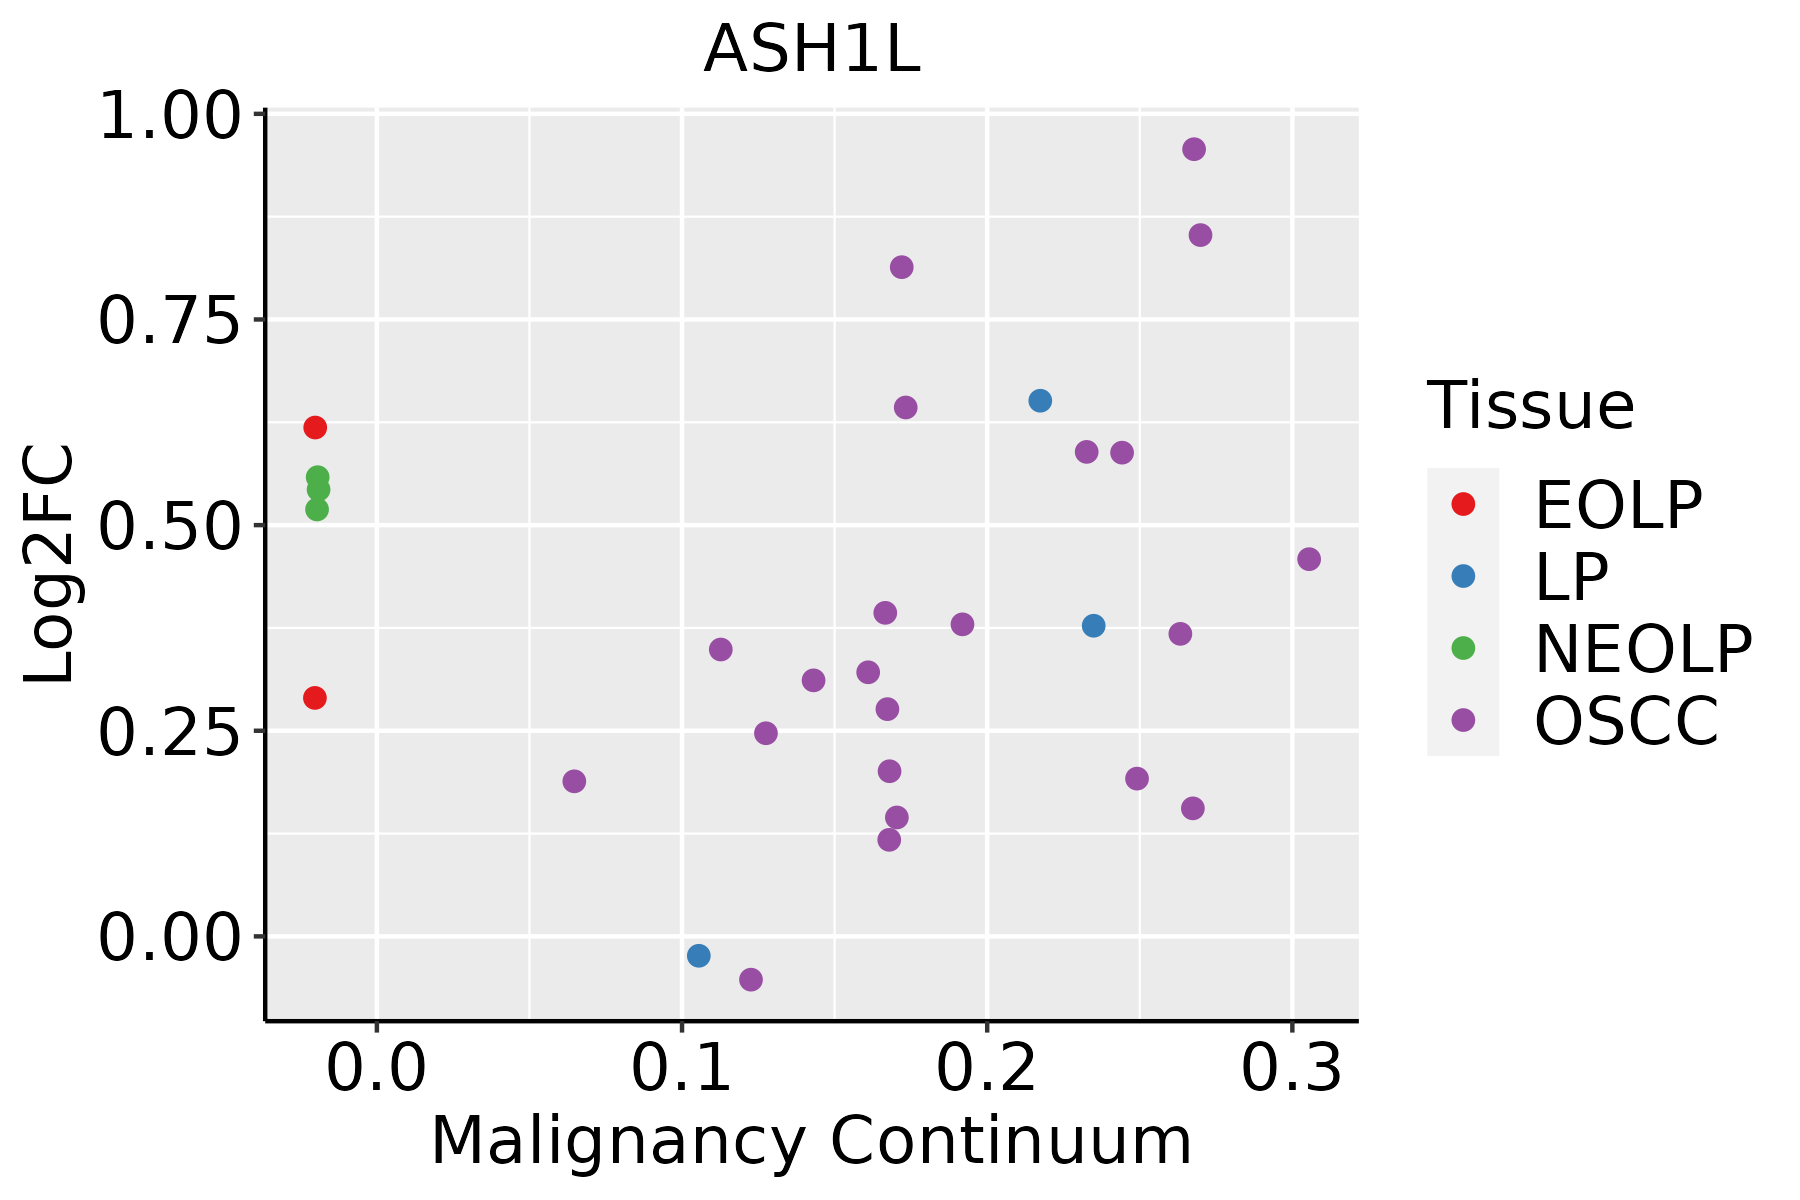 | EOLP: Erosive Oral lichen planus |
| LP: leukoplakia | ||
| NEOLP: Non-erosive oral lichen planus | ||
| OSCC: Oral squamous cell carcinoma | ||
| Prostate | 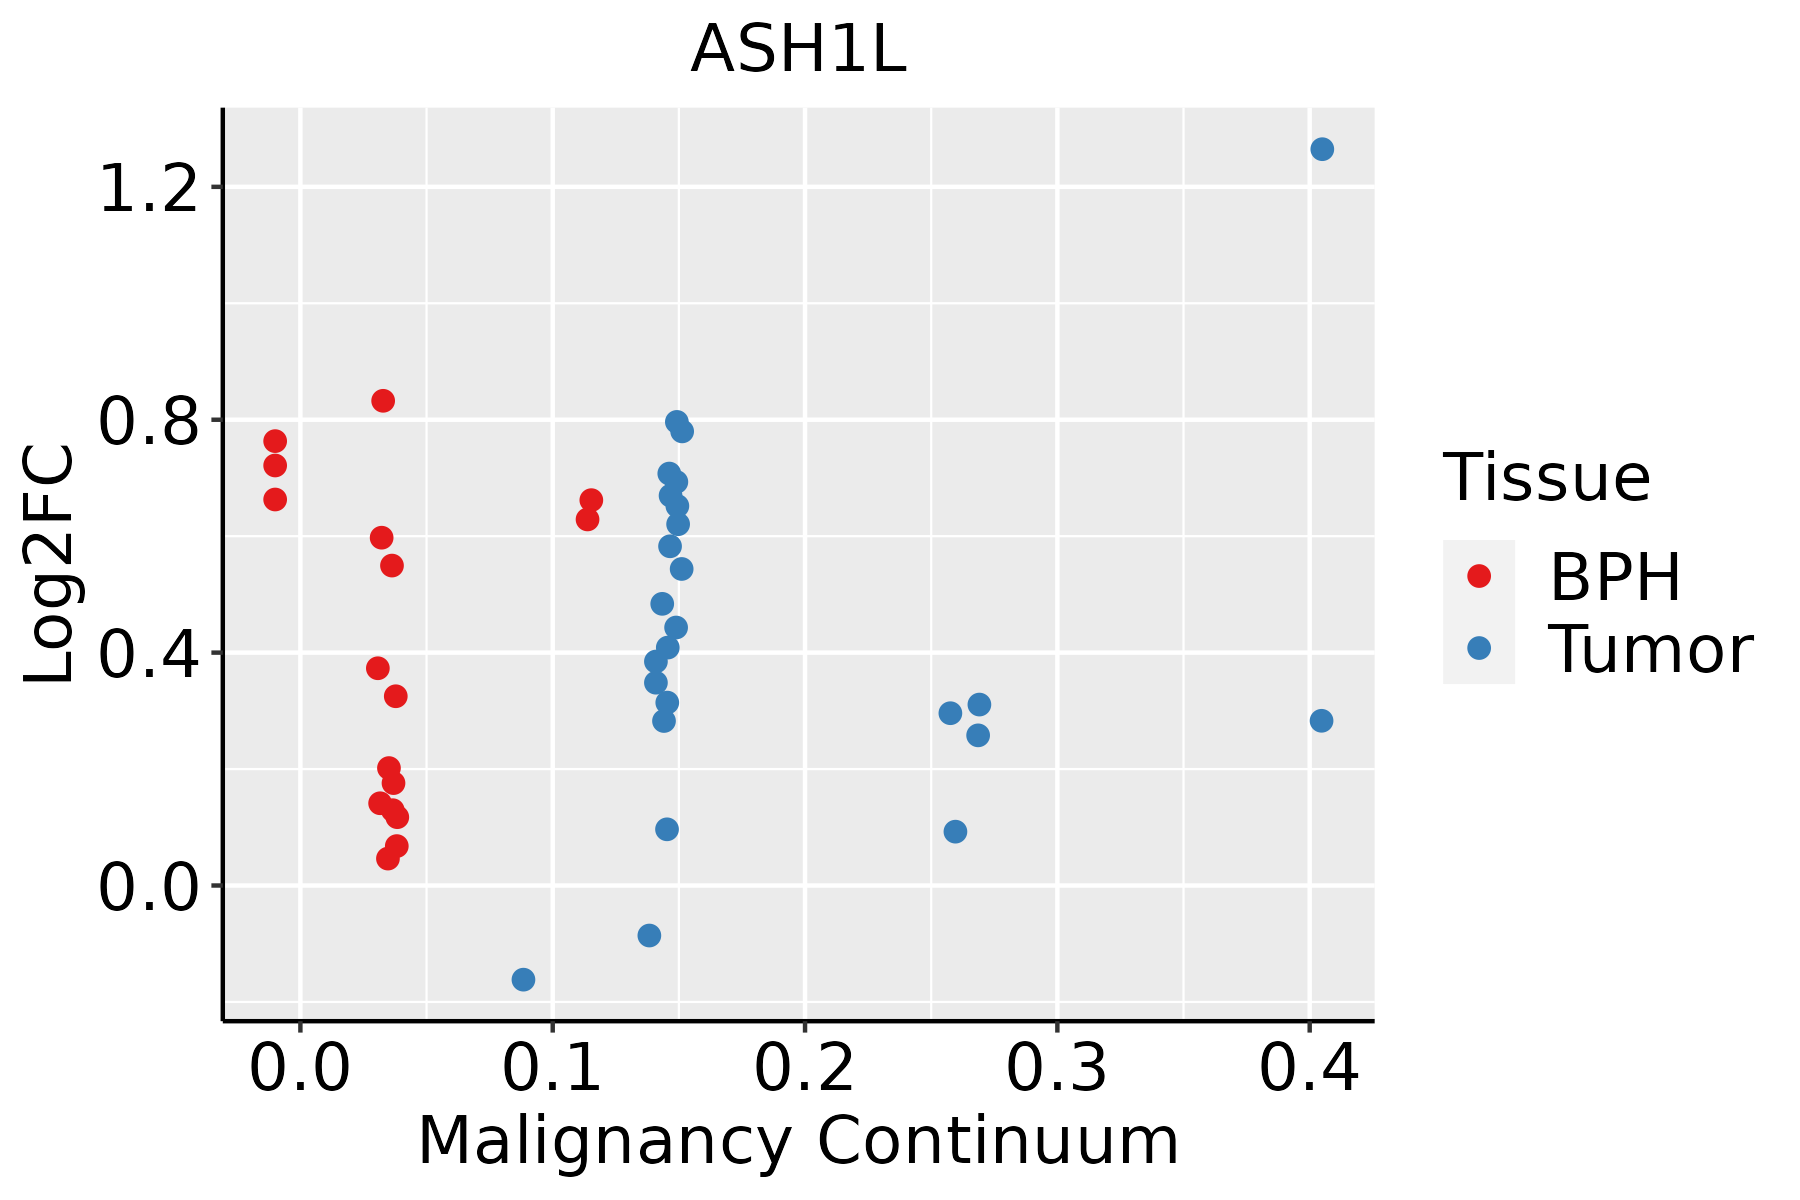 | BPH: Benign Prostatic Hyperplasia |
| Skin | 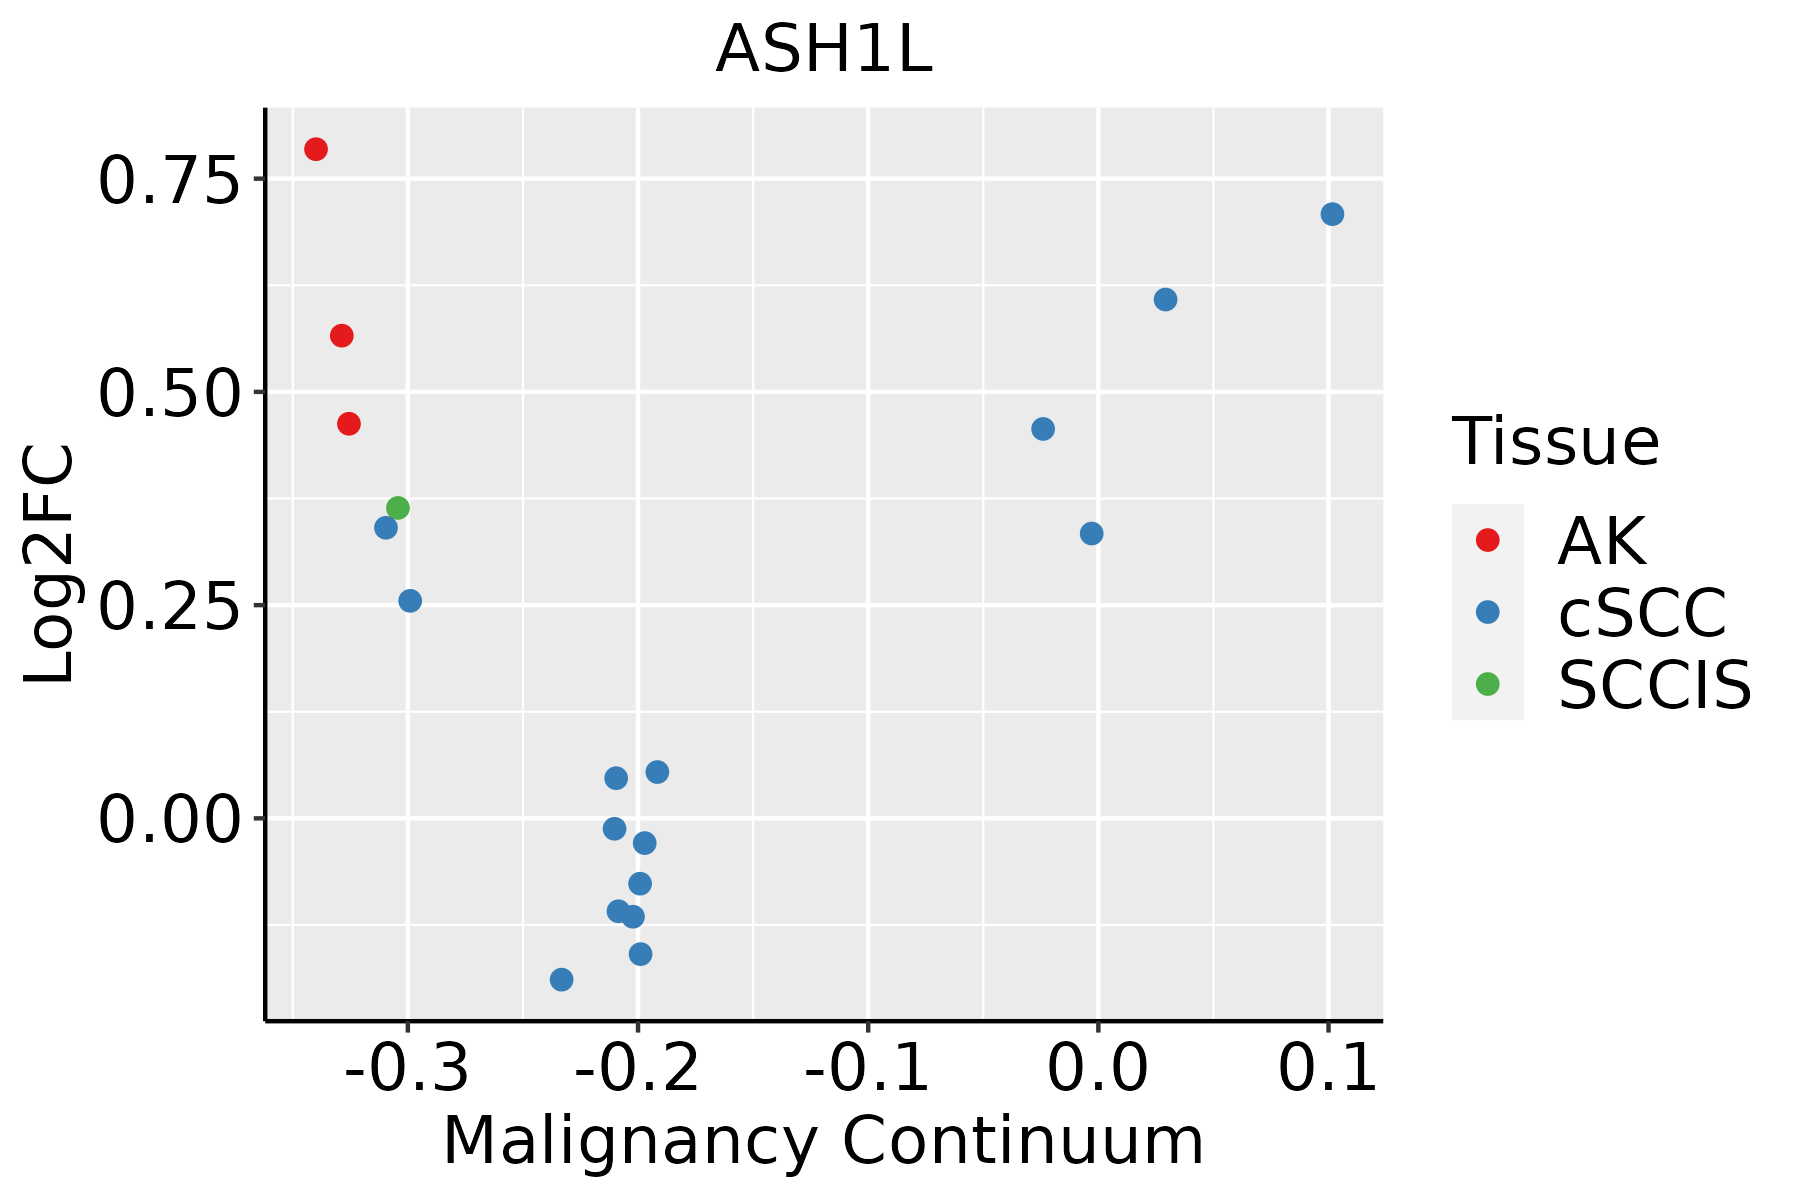 | AK: Actinic keratosis |
| cSCC: Cutaneous squamous cell carcinoma | ||
| SCCIS:squamous cell carcinoma in situ | ||
| Thyroid | 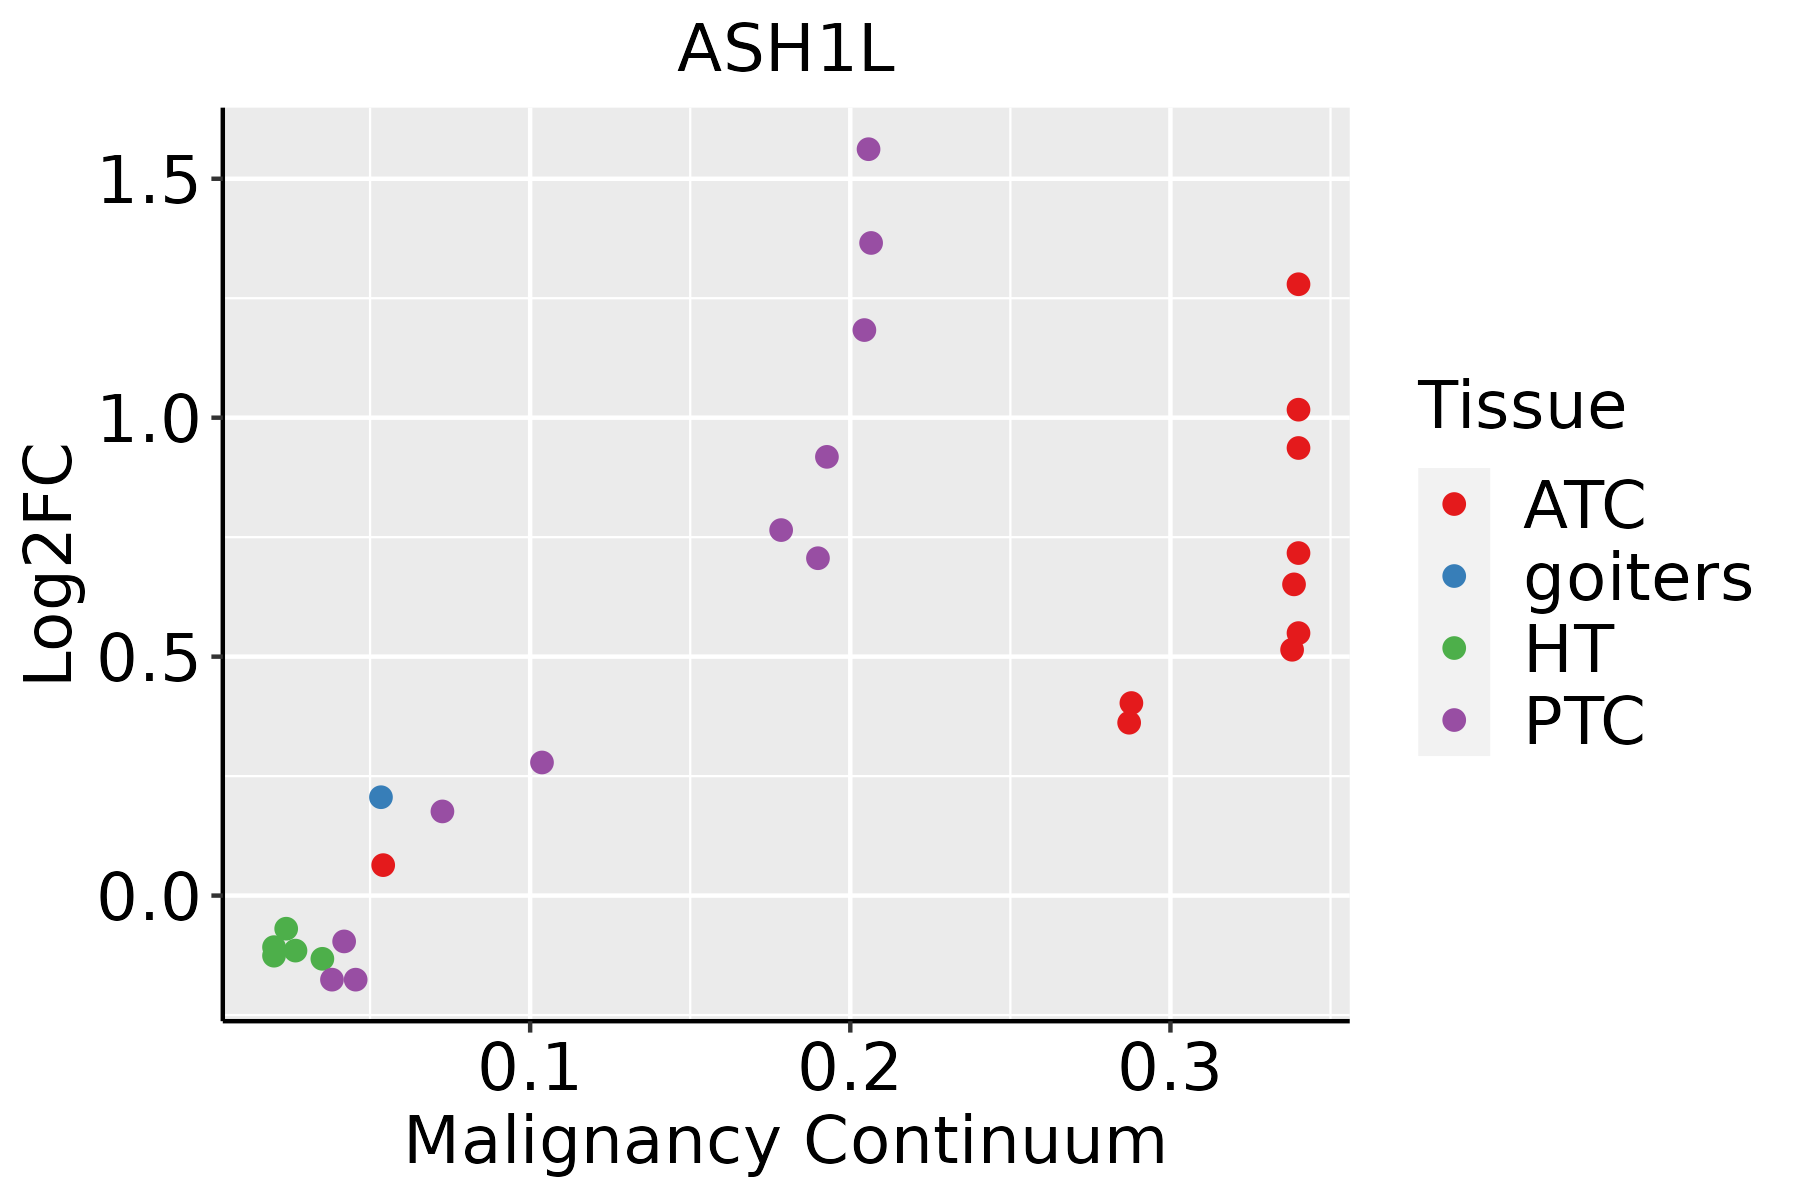 | ATC: Anaplastic thyroid cancer |
| HT: Hashimoto's thyroiditis | ||
| PTC: Papillary thyroid cancer |
| ∗log2FC in expression of this searched gene in stem-like cells from each diseased tissue sample relative to stem-like cells in normal samples in each tissue plotted against the malignancy continuum. Samples are colored based on if they are from different disease stage. |
Top |
Malignant transformation related pathway analysis |
| Find out the enriched GO biological processes and KEGG pathways involved in transition from healthy to precancer to cancer |
| Tissue | Disease Stage | Enriched GO biological Processes |
| Colorectum | AD |  |
| Colorectum | SER |  |
| Colorectum | MSS |  |
| Colorectum | MSI-H |  |
| Colorectum | FAP |  |
| ∗Top 15 enriched GO BP terms are showed in the bar plot of each disease state in each tissue. Each row represents a significant GO biological process which is colored according to the -log10(p.adjust). |
| Page: 1 2 3 4 5 6 7 8 9 |
| GO ID | Tissue | Disease Stage | Description | Gene Ratio | Bg Ratio | pvalue | p.adjust | Count |
| GO:000756511 | Breast | IDC | female pregnancy | 39/1434 | 193/18723 | 1.81e-08 | 1.27e-06 | 39 |
| GO:00447061 | Breast | IDC | multi-multicellular organism process | 41/1434 | 220/18723 | 8.58e-08 | 5.19e-06 | 41 |
| GO:004873214 | Breast | IDC | gland development | 64/1434 | 436/18723 | 3.47e-07 | 1.74e-05 | 64 |
| GO:004860812 | Breast | IDC | reproductive structure development | 60/1434 | 424/18723 | 2.71e-06 | 1.03e-04 | 60 |
| GO:006145813 | Breast | IDC | reproductive system development | 60/1434 | 427/18723 | 3.41e-06 | 1.24e-04 | 60 |
| GO:00601352 | Breast | IDC | maternal process involved in female pregnancy | 16/1434 | 62/18723 | 1.20e-05 | 3.17e-04 | 16 |
| GO:000189013 | Breast | IDC | placenta development | 25/1434 | 144/18723 | 9.19e-05 | 1.78e-03 | 25 |
| GO:00018933 | Breast | IDC | maternal placenta development | 10/1434 | 35/18723 | 2.09e-04 | 3.41e-03 | 10 |
| GO:0046697 | Breast | IDC | decidualization | 8/1434 | 26/18723 | 5.19e-04 | 6.75e-03 | 8 |
| GO:00507271 | Breast | IDC | regulation of inflammatory response | 48/1434 | 386/18723 | 5.99e-04 | 7.54e-03 | 48 |
| GO:00431227 | Breast | IDC | regulation of I-kappaB kinase/NF-kappaB signaling | 34/1434 | 249/18723 | 7.18e-04 | 8.77e-03 | 34 |
| GO:000724914 | Breast | IDC | I-kappaB kinase/NF-kappaB signaling | 37/1434 | 281/18723 | 8.58e-04 | 9.98e-03 | 37 |
| GO:00435883 | Breast | IDC | skin development | 33/1434 | 263/18723 | 3.46e-03 | 2.87e-02 | 33 |
| GO:000252611 | Breast | IDC | acute inflammatory response | 17/1434 | 112/18723 | 5.00e-03 | 3.77e-02 | 17 |
| GO:00075652 | Breast | DCIS | female pregnancy | 37/1390 | 193/18723 | 7.85e-08 | 4.47e-06 | 37 |
| GO:00447062 | Breast | DCIS | multi-multicellular organism process | 39/1390 | 220/18723 | 3.05e-07 | 1.46e-05 | 39 |
| GO:004873223 | Breast | DCIS | gland development | 60/1390 | 436/18723 | 2.50e-06 | 8.74e-05 | 60 |
| GO:004860821 | Breast | DCIS | reproductive structure development | 57/1390 | 424/18723 | 9.06e-06 | 2.45e-04 | 57 |
| GO:006145822 | Breast | DCIS | reproductive system development | 57/1390 | 427/18723 | 1.12e-05 | 2.92e-04 | 57 |
| GO:006013511 | Breast | DCIS | maternal process involved in female pregnancy | 15/1390 | 62/18723 | 3.55e-05 | 7.70e-04 | 15 |
| Page: 1 2 3 4 5 6 7 8 9 10 11 12 13 14 15 16 17 18 19 20 21 22 23 24 |
| Pathway ID | Tissue | Disease Stage | Description | Gene Ratio | Bg Ratio | pvalue | p.adjust | qvalue | Count |
| hsa00310 | Colorectum | AD | Lysine degradation | 27/2092 | 63/8465 | 1.17e-03 | 7.75e-03 | 4.94e-03 | 27 |
| hsa003101 | Colorectum | AD | Lysine degradation | 27/2092 | 63/8465 | 1.17e-03 | 7.75e-03 | 4.94e-03 | 27 |
| hsa003102 | Colorectum | MSS | Lysine degradation | 24/1875 | 63/8465 | 2.94e-03 | 1.39e-02 | 8.50e-03 | 24 |
| hsa003103 | Colorectum | MSS | Lysine degradation | 24/1875 | 63/8465 | 2.94e-03 | 1.39e-02 | 8.50e-03 | 24 |
| hsa003106 | Colorectum | CRC | Lysine degradation | 18/1091 | 63/8465 | 7.21e-04 | 6.34e-03 | 4.30e-03 | 18 |
| hsa003107 | Colorectum | CRC | Lysine degradation | 18/1091 | 63/8465 | 7.21e-04 | 6.34e-03 | 4.30e-03 | 18 |
| hsa0031010 | Esophagus | ESCC | Lysine degradation | 41/4205 | 63/8465 | 9.63e-03 | 2.27e-02 | 1.16e-02 | 41 |
| hsa0031013 | Esophagus | ESCC | Lysine degradation | 41/4205 | 63/8465 | 9.63e-03 | 2.27e-02 | 1.16e-02 | 41 |
| hsa003108 | Liver | NAFLD | Lysine degradation | 21/1043 | 63/8465 | 1.09e-05 | 3.58e-04 | 2.89e-04 | 21 |
| hsa0031011 | Liver | NAFLD | Lysine degradation | 21/1043 | 63/8465 | 1.09e-05 | 3.58e-04 | 2.89e-04 | 21 |
| hsa0031021 | Liver | Cirrhotic | Lysine degradation | 29/2530 | 63/8465 | 4.81e-03 | 1.74e-02 | 1.07e-02 | 29 |
| hsa0031031 | Liver | Cirrhotic | Lysine degradation | 29/2530 | 63/8465 | 4.81e-03 | 1.74e-02 | 1.07e-02 | 29 |
| hsa0031041 | Liver | HCC | Lysine degradation | 47/4020 | 63/8465 | 1.02e-05 | 7.58e-05 | 4.22e-05 | 47 |
| hsa0031051 | Liver | HCC | Lysine degradation | 47/4020 | 63/8465 | 1.02e-05 | 7.58e-05 | 4.22e-05 | 47 |
| hsa003109 | Lung | IAC | Lysine degradation | 17/1053 | 63/8465 | 1.35e-03 | 8.63e-03 | 5.73e-03 | 17 |
| hsa0031012 | Lung | IAC | Lysine degradation | 17/1053 | 63/8465 | 1.35e-03 | 8.63e-03 | 5.73e-03 | 17 |
| hsa0031022 | Lung | AIS | Lysine degradation | 16/961 | 63/8465 | 1.41e-03 | 9.49e-03 | 6.07e-03 | 16 |
| hsa0031032 | Lung | AIS | Lysine degradation | 16/961 | 63/8465 | 1.41e-03 | 9.49e-03 | 6.07e-03 | 16 |
| Page: 1 |
Top |
Cell-cell communication analysis |
| Identification of potential cell-cell interactions between two cell types and their ligand-receptor pairs for different disease states |
| Ligand | Receptor | LRpair | Pathway | Tissue | Disease Stage |
| Page: 1 |
Top |
Single-cell gene regulatory network inference analysis |
| Find out the significant the regulons (TFs) and the target genes of each regulon across cell types for different disease states |
| TF | Cell Type | Tissue | Disease Stage | Target Gene | RSS | Regulon Activity |
| ∗The dot plots of a searched regulon are shown for all cell subpopulations in each disease state of each tissue based on the regulon specific score inferred using pySCENIC and by calculating the average expression. |
| Page: 1 |
Top |
Somatic mutation of malignant transformation related genes |
| Annotation of somatic variants for genes involved in malignant transformation |
| Hugo Symbol | Variant Class | Variant Classification | dbSNP RS | HGVSc | HGVSp | HGVSp Short | SWISSPROT | BIOTYPE | SIFT | PolyPhen | Tumor Sample Barcode | Tissue | Histology | Sex | Age | Stage | Therapy Types | Drugs | Outcome |
| ASH1L | SNV | Missense_Mutation | novel | c.6979N>A | p.Glu2327Lys | p.E2327K | Q9NR48 | protein_coding | tolerated_low_confidence(0.07) | possibly_damaging(0.765) | TCGA-A2-A0YG-01 | Breast | breast invasive carcinoma | Female | <65 | III/IV | Chemotherapy | cytoxan | SD |
| ASH1L | SNV | Missense_Mutation | c.5070G>C | p.Glu1690Asp | p.E1690D | Q9NR48 | protein_coding | tolerated_low_confidence(0.06) | probably_damaging(0.953) | TCGA-A2-A25A-01 | Breast | breast invasive carcinoma | Female | <65 | I/II | Unspecific | Cytoxan | SD | |
| ASH1L | SNV | Missense_Mutation | c.3673C>T | p.His1225Tyr | p.H1225Y | Q9NR48 | protein_coding | tolerated_low_confidence(0.35) | possibly_damaging(0.548) | TCGA-A7-A26F-01 | Breast | breast invasive carcinoma | Female | <65 | I/II | Chemotherapy | taxotere | SD | |
| ASH1L | SNV | Missense_Mutation | c.865N>G | p.Lys289Glu | p.K289E | Q9NR48 | protein_coding | deleterious_low_confidence(0) | probably_damaging(0.953) | TCGA-A7-A26I-01 | Breast | breast invasive carcinoma | Female | >=65 | I/II | Chemotherapy | cytoxan | SD | |
| ASH1L | SNV | Missense_Mutation | c.4486N>C | p.Glu1496Gln | p.E1496Q | Q9NR48 | protein_coding | deleterious_low_confidence(0.01) | possibly_damaging(0.785) | TCGA-A8-A06Q-01 | Breast | breast invasive carcinoma | Female | <65 | III/IV | Unknown | Unknown | SD | |
| ASH1L | SNV | Missense_Mutation | c.3580G>A | p.Asp1194Asn | p.D1194N | Q9NR48 | protein_coding | deleterious_low_confidence(0) | possibly_damaging(0.873) | TCGA-AC-A23H-01 | Breast | breast invasive carcinoma | Female | >=65 | I/II | Unknown | Unknown | PD | |
| ASH1L | SNV | Missense_Mutation | rs867128307 | c.1777G>A | p.Glu593Lys | p.E593K | Q9NR48 | protein_coding | deleterious_low_confidence(0.02) | benign(0.281) | TCGA-AN-A046-01 | Breast | breast invasive carcinoma | Female | >=65 | I/II | Unknown | Unknown | SD |
| ASH1L | SNV | Missense_Mutation | c.4970N>C | p.Val1657Ala | p.V1657A | Q9NR48 | protein_coding | tolerated_low_confidence(0.18) | benign(0.003) | TCGA-AN-A0AK-01 | Breast | breast invasive carcinoma | Female | >=65 | I/II | Unknown | Unknown | SD | |
| ASH1L | SNV | Missense_Mutation | c.1366N>G | p.Leu456Val | p.L456V | Q9NR48 | protein_coding | deleterious_low_confidence(0.02) | benign(0) | TCGA-AO-A03O-01 | Breast | breast invasive carcinoma | Female | >=65 | I/II | Chemotherapy | doxorubicin | SD | |
| ASH1L | SNV | Missense_Mutation | novel | c.3368N>T | p.Ser1123Ile | p.S1123I | Q9NR48 | protein_coding | deleterious_low_confidence(0.01) | probably_damaging(0.996) | TCGA-B6-A0I5-01 | Breast | breast invasive carcinoma | Female | <65 | I/II | Unknown | Unknown | SD |
| Page: 1 2 3 4 5 6 7 8 9 10 11 12 13 14 15 16 17 18 19 20 21 22 23 24 25 26 27 28 29 30 31 32 33 34 35 36 |
Top |
Related drugs of malignant transformation related genes |
| Identification of chemicals and drugs interact with genes involved in malignant transfromation |
| (DGIdb 4.0) |
| Entrez ID | Symbol | Category | Interaction Types | Drug Claim Name | Drug Name | PMIDs |
| Page: 1 |

Copyright 2023-Present -The University of Texas Health Science Center at Houston |