
|
|||||
|
 | |
| |
| |
| |
| |
| |
|
Gene: ASF1B |
Gene summary for ASF1B |
| Gene information | Species | Human | Gene symbol | ASF1B | Gene ID | 55723 |
| Gene name | anti-silencing function 1B histone chaperone | |
| Gene Alias | CIA-II | |
| Cytomap | 19p13.12 | |
| Gene Type | protein-coding | GO ID | GO:0000003 | UniProtAcc | A0A024R7G4 |
Top |
Malignant transformation analysis |
| Identification of the aberrant gene expression in precancerous and cancerous lesions by comparing the gene expression of stem-like cells in diseased tissues with normal stem cells |
| Entrez ID | Symbol | Replicates | Species | Organ | Tissue | Adj P-value | Log2FC | Malignancy |
| 55723 | ASF1B | LZE2T | Human | Esophagus | ESCC | 4.73e-03 | 4.13e-01 | 0.082 |
| 55723 | ASF1B | LZE5T | Human | Esophagus | ESCC | 1.57e-02 | 3.06e-01 | 0.0514 |
| 55723 | ASF1B | LZE22T | Human | Esophagus | ESCC | 1.57e-03 | 4.13e-01 | 0.068 |
| 55723 | ASF1B | LZE21T | Human | Esophagus | ESCC | 6.52e-03 | 3.20e-01 | 0.0655 |
| 55723 | ASF1B | LZE6T | Human | Esophagus | ESCC | 5.26e-07 | 2.94e-01 | 0.0845 |
| 55723 | ASF1B | P1T-E | Human | Esophagus | ESCC | 7.11e-04 | 3.11e-01 | 0.0875 |
| 55723 | ASF1B | P2T-E | Human | Esophagus | ESCC | 2.34e-05 | 3.26e-01 | 0.1177 |
| 55723 | ASF1B | P4T-E | Human | Esophagus | ESCC | 7.93e-07 | 2.53e-01 | 0.1323 |
| 55723 | ASF1B | P5T-E | Human | Esophagus | ESCC | 5.99e-07 | 2.63e-01 | 0.1327 |
| 55723 | ASF1B | P8T-E | Human | Esophagus | ESCC | 2.80e-02 | 2.18e-01 | 0.0889 |
| 55723 | ASF1B | P9T-E | Human | Esophagus | ESCC | 5.23e-05 | 1.61e-01 | 0.1131 |
| 55723 | ASF1B | P10T-E | Human | Esophagus | ESCC | 1.09e-05 | 2.98e-01 | 0.116 |
| 55723 | ASF1B | P15T-E | Human | Esophagus | ESCC | 3.34e-06 | 1.90e-01 | 0.1149 |
| 55723 | ASF1B | P16T-E | Human | Esophagus | ESCC | 2.73e-02 | 1.88e-01 | 0.1153 |
| 55723 | ASF1B | P17T-E | Human | Esophagus | ESCC | 1.49e-02 | 3.13e-01 | 0.1278 |
| 55723 | ASF1B | P19T-E | Human | Esophagus | ESCC | 5.57e-05 | 5.17e-01 | 0.1662 |
| 55723 | ASF1B | P21T-E | Human | Esophagus | ESCC | 7.37e-10 | 4.03e-01 | 0.1617 |
| 55723 | ASF1B | P23T-E | Human | Esophagus | ESCC | 9.87e-03 | 1.32e-01 | 0.108 |
| 55723 | ASF1B | P24T-E | Human | Esophagus | ESCC | 2.14e-17 | 5.23e-01 | 0.1287 |
| 55723 | ASF1B | P28T-E | Human | Esophagus | ESCC | 7.28e-10 | 3.01e-01 | 0.1149 |
| Page: 1 2 3 4 |
| Tissue | Expression Dynamics | Abbreviation |
| Esophagus | 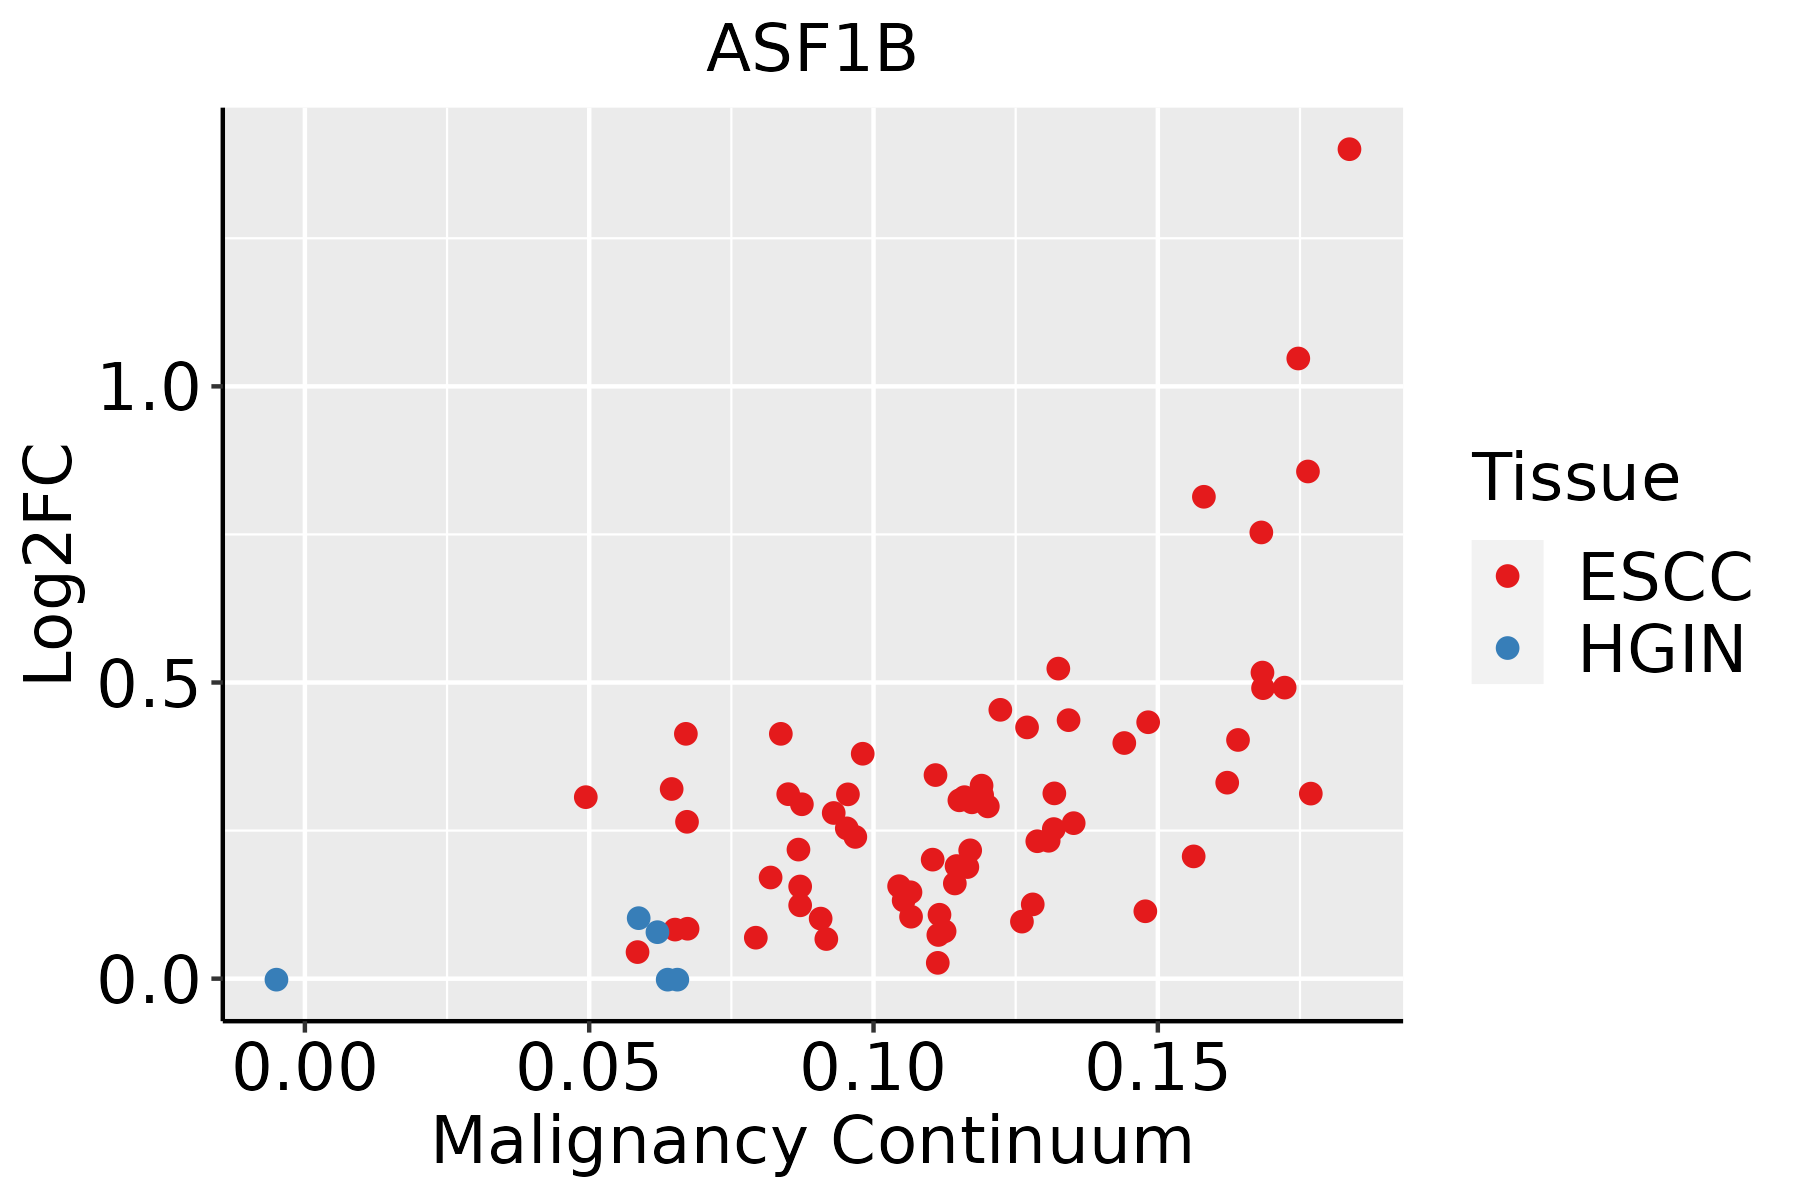 | ESCC: Esophageal squamous cell carcinoma |
| HGIN: High-grade intraepithelial neoplasias | ||
| LGIN: Low-grade intraepithelial neoplasias | ||
| Oral Cavity | 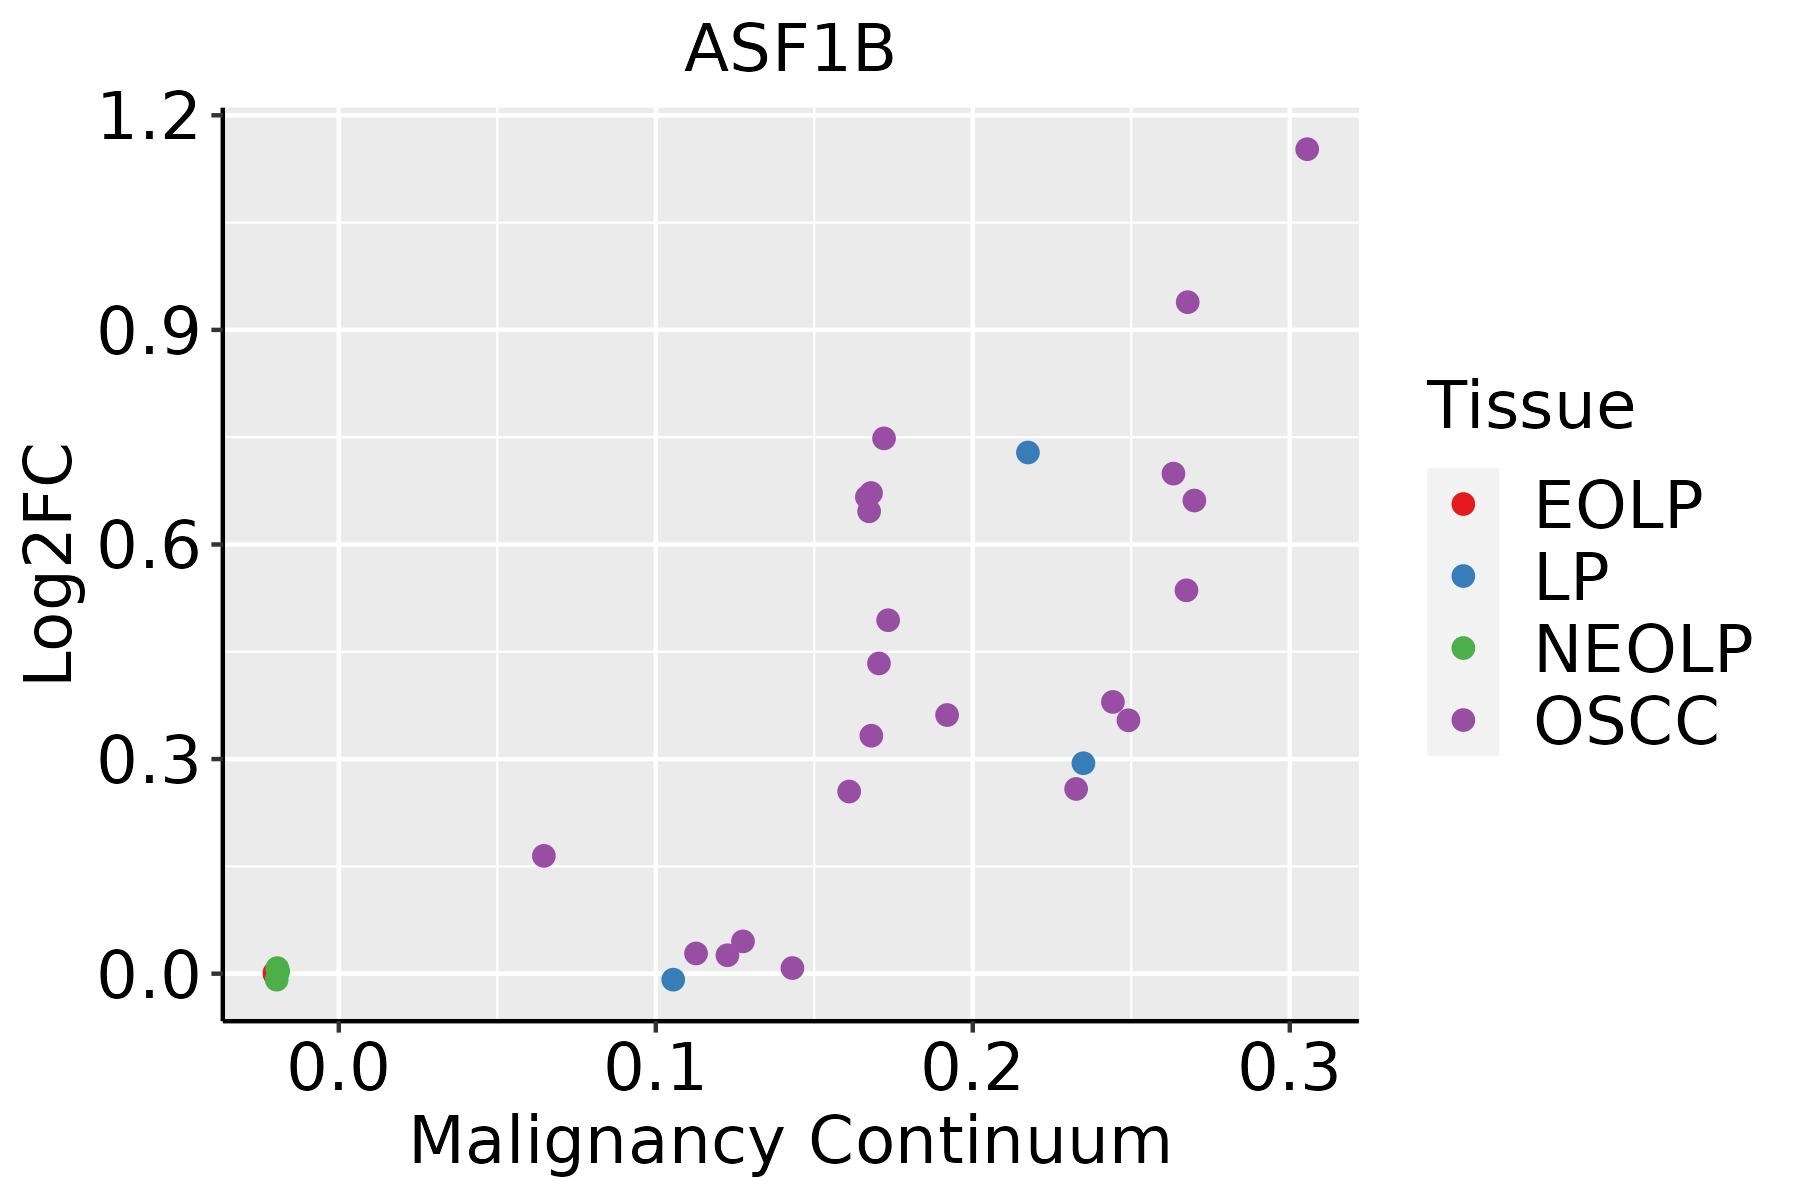 | EOLP: Erosive Oral lichen planus |
| LP: leukoplakia | ||
| NEOLP: Non-erosive oral lichen planus | ||
| OSCC: Oral squamous cell carcinoma | ||
| Thyroid | 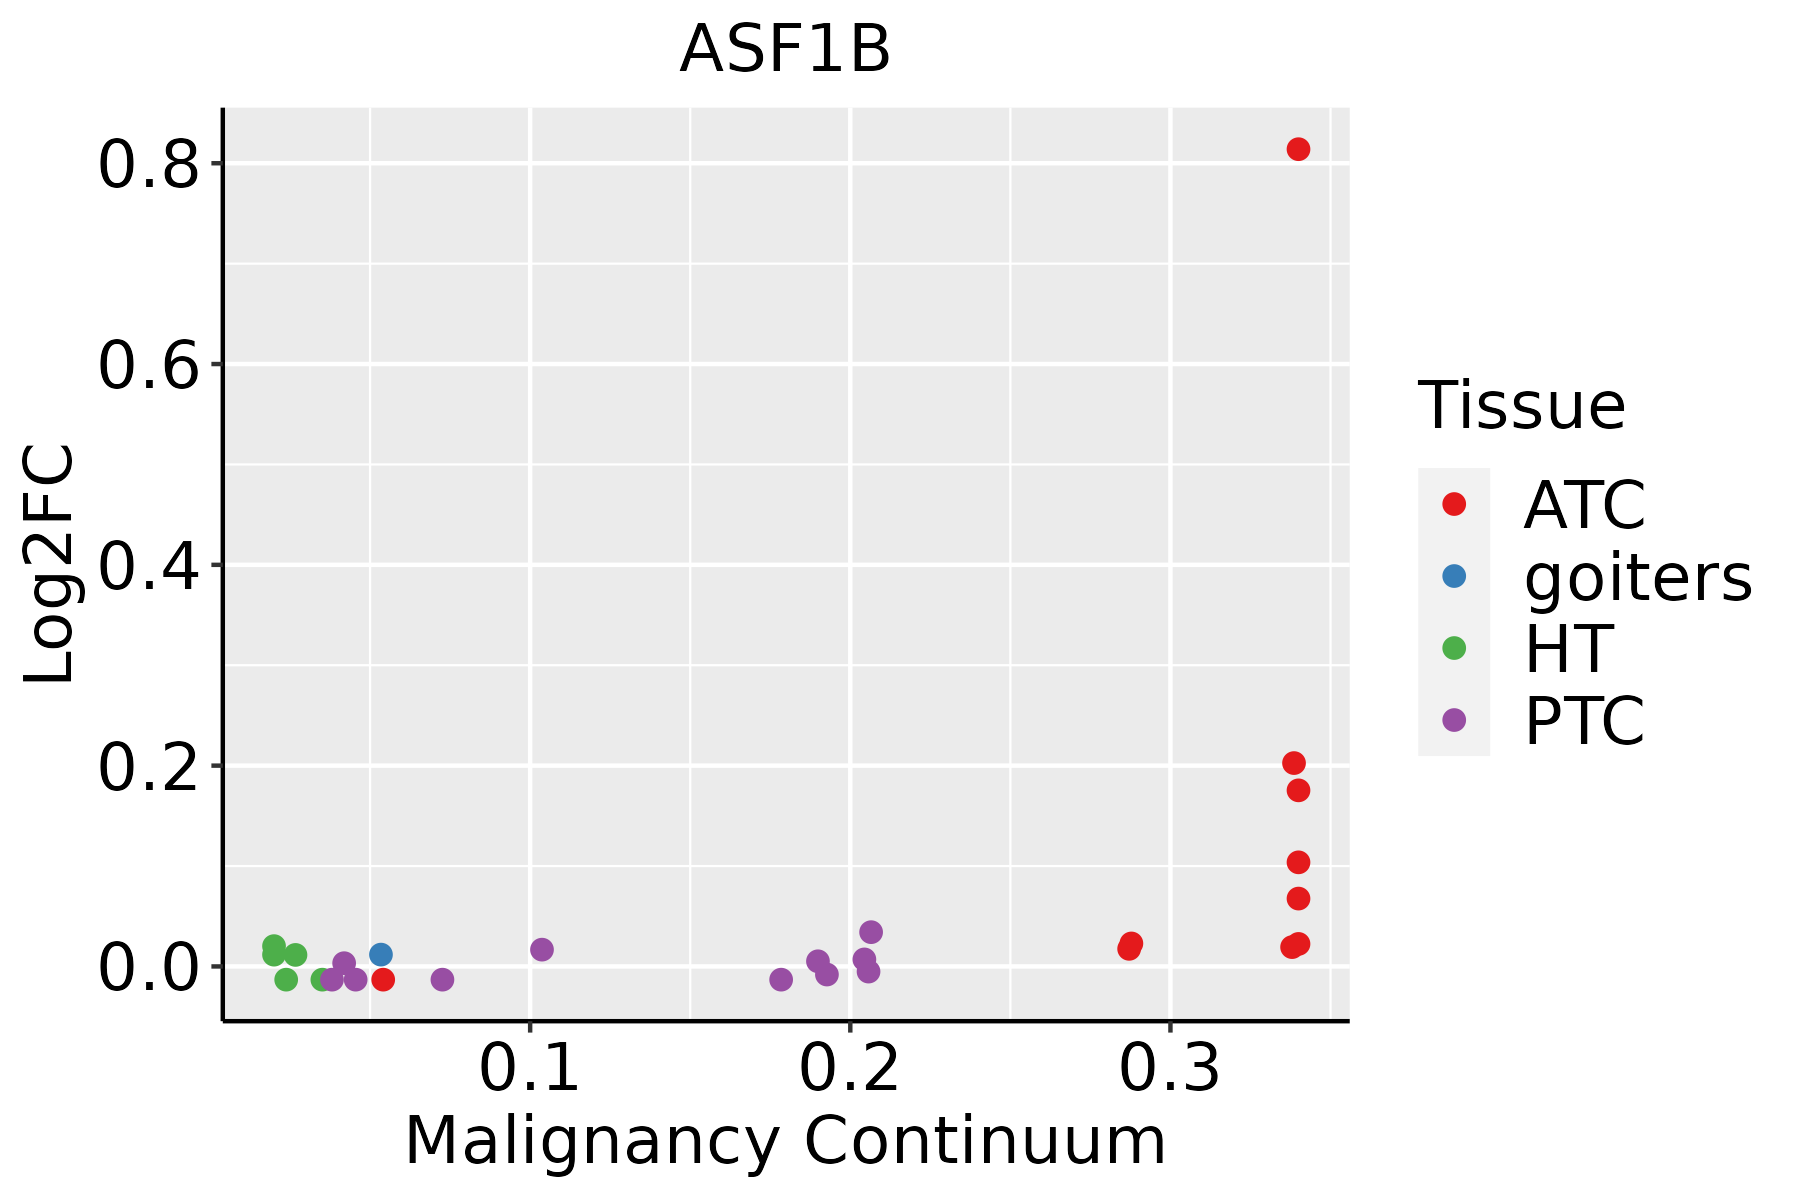 | ATC: Anaplastic thyroid cancer |
| HT: Hashimoto's thyroiditis | ||
| PTC: Papillary thyroid cancer |
| ∗log2FC in expression of this searched gene in stem-like cells from each diseased tissue sample relative to stem-like cells in normal samples in each tissue plotted against the malignancy continuum. Samples are colored based on if they are from different disease stage. |
Top |
Malignant transformation related pathway analysis |
| Find out the enriched GO biological processes and KEGG pathways involved in transition from healthy to precancer to cancer |
| Tissue | Disease Stage | Enriched GO biological Processes |
| Colorectum | AD |  |
| Colorectum | SER |  |
| Colorectum | MSS |  |
| Colorectum | MSI-H |  |
| Colorectum | FAP |  |
| ∗Top 15 enriched GO BP terms are showed in the bar plot of each disease state in each tissue. Each row represents a significant GO biological process which is colored according to the -log10(p.adjust). |
| Page: 1 2 3 4 5 6 7 8 9 |
| GO ID | Tissue | Disease Stage | Description | Gene Ratio | Bg Ratio | pvalue | p.adjust | Count |
| GO:000170119 | Esophagus | ESCC | in utero embryonic development | 243/8552 | 367/18723 | 1.00e-15 | 6.86e-14 | 243 |
| GO:000632517 | Esophagus | ESCC | chromatin organization | 240/8552 | 409/18723 | 6.52e-08 | 1.14e-06 | 240 |
| GO:000182412 | Esophagus | ESCC | blastocyst development | 73/8552 | 106/18723 | 1.13e-06 | 1.40e-05 | 73 |
| GO:000170116 | Oral cavity | OSCC | in utero embryonic development | 207/7305 | 367/18723 | 7.92e-12 | 2.95e-10 | 207 |
| GO:00018243 | Oral cavity | OSCC | blastocyst development | 66/7305 | 106/18723 | 1.04e-06 | 1.40e-05 | 66 |
| GO:000632510 | Oral cavity | OSCC | chromatin organization | 190/7305 | 409/18723 | 1.17e-03 | 5.97e-03 | 190 |
| GO:000170126 | Thyroid | ATC | in utero embryonic development | 183/6293 | 367/18723 | 6.62e-11 | 2.11e-09 | 183 |
| GO:0006325110 | Thyroid | ATC | chromatin organization | 189/6293 | 409/18723 | 6.40e-08 | 1.13e-06 | 189 |
| GO:000182414 | Thyroid | ATC | blastocyst development | 53/6293 | 106/18723 | 3.48e-04 | 2.16e-03 | 53 |
| GO:000633813 | Thyroid | ATC | chromatin remodeling | 109/6293 | 255/18723 | 1.38e-03 | 7.15e-03 | 109 |
| GO:00718242 | Thyroid | ATC | protein-DNA complex subunit organization | 103/6293 | 241/18723 | 1.84e-03 | 9.03e-03 | 103 |
| Page: 1 |
| Pathway ID | Tissue | Disease Stage | Description | Gene Ratio | Bg Ratio | pvalue | p.adjust | qvalue | Count |
| Page: 1 |
Top |
Cell-cell communication analysis |
| Identification of potential cell-cell interactions between two cell types and their ligand-receptor pairs for different disease states |
| Ligand | Receptor | LRpair | Pathway | Tissue | Disease Stage |
| Page: 1 |
Top |
Single-cell gene regulatory network inference analysis |
| Find out the significant the regulons (TFs) and the target genes of each regulon across cell types for different disease states |
| TF | Cell Type | Tissue | Disease Stage | Target Gene | RSS | Regulon Activity |
| ∗The dot plots of a searched regulon are shown for all cell subpopulations in each disease state of each tissue based on the regulon specific score inferred using pySCENIC and by calculating the average expression. |
| Page: 1 |
Top |
Somatic mutation of malignant transformation related genes |
| Annotation of somatic variants for genes involved in malignant transformation |
| Hugo Symbol | Variant Class | Variant Classification | dbSNP RS | HGVSc | HGVSp | HGVSp Short | SWISSPROT | BIOTYPE | SIFT | PolyPhen | Tumor Sample Barcode | Tissue | Histology | Sex | Age | Stage | Therapy Types | Drugs | Outcome |
| ASF1B | SNV | Missense_Mutation | c.92G>C | p.Ser31Thr | p.S31T | Q9NVP2 | protein_coding | deleterious(0.05) | benign(0.009) | TCGA-C8-A1HJ-01 | Breast | breast invasive carcinoma | Female | <65 | I/II | Unknown | Unknown | SD | |
| ASF1B | insertion | Frame_Shift_Ins | novel | c.497_498insTTCCAGACTGAGGTTCCAGGAGGGGTTTTTCTTT | p.Gln166HisfsTer42 | p.Q166Hfs*42 | Q9NVP2 | protein_coding | TCGA-BH-A0AY-01 | Breast | breast invasive carcinoma | Female | <65 | I/II | Chemotherapy | SD | |||
| ASF1B | SNV | Missense_Mutation | rs757014130 | c.286N>T | p.Leu96Phe | p.L96F | Q9NVP2 | protein_coding | deleterious(0.03) | probably_damaging(0.999) | TCGA-2W-A8YY-01 | Cervix | cervical & endocervical cancer | Female | <65 | I/II | Chemotherapy | cisplatin | CR |
| ASF1B | SNV | Missense_Mutation | c.476G>T | p.Arg159Met | p.R159M | Q9NVP2 | protein_coding | deleterious(0.01) | benign(0.078) | TCGA-AA-3672-01 | Colorectum | colon adenocarcinoma | Female | >=65 | III/IV | Unknown | Unknown | SD | |
| ASF1B | SNV | Missense_Mutation | c.128N>G | p.Ile43Ser | p.I43S | Q9NVP2 | protein_coding | deleterious(0) | possibly_damaging(0.709) | TCGA-AA-3715-01 | Colorectum | colon adenocarcinoma | Male | >=65 | I/II | Unknown | Unknown | PD | |
| ASF1B | SNV | Missense_Mutation | novel | c.232N>A | p.Ala78Thr | p.A78T | Q9NVP2 | protein_coding | deleterious(0) | probably_damaging(0.998) | TCGA-CK-4951-01 | Colorectum | colon adenocarcinoma | Female | >=65 | I/II | Unknown | Unknown | PD |
| ASF1B | SNV | Missense_Mutation | novel | c.266C>T | p.Ala89Val | p.A89V | Q9NVP2 | protein_coding | tolerated(1) | probably_damaging(0.995) | TCGA-AP-A1DK-01 | Endometrium | uterine corpus endometrioid carcinoma | Female | <65 | I/II | Unknown | Unknown | SD |
| ASF1B | SNV | Missense_Mutation | novel | c.52N>G | p.Phe18Val | p.F18V | Q9NVP2 | protein_coding | deleterious(0) | probably_damaging(0.995) | TCGA-AP-A1E0-01 | Endometrium | uterine corpus endometrioid carcinoma | Female | <65 | III/IV | Chemotherapy | paclitaxel | SD |
| ASF1B | SNV | Missense_Mutation | rs142438175 | c.517N>A | p.Gly173Ser | p.G173S | Q9NVP2 | protein_coding | tolerated(0.44) | benign(0) | TCGA-AX-A2HG-01 | Endometrium | uterine corpus endometrioid carcinoma | Female | <65 | I/II | Unknown | Unknown | SD |
| ASF1B | SNV | Missense_Mutation | novel | c.232N>A | p.Ala78Thr | p.A78T | Q9NVP2 | protein_coding | deleterious(0) | probably_damaging(0.998) | TCGA-AX-A2HG-01 | Endometrium | uterine corpus endometrioid carcinoma | Female | <65 | I/II | Unknown | Unknown | SD |
| Page: 1 2 |
Top |
Related drugs of malignant transformation related genes |
| Identification of chemicals and drugs interact with genes involved in malignant transfromation |
| (DGIdb 4.0) |
| Entrez ID | Symbol | Category | Interaction Types | Drug Claim Name | Drug Name | PMIDs |
| Page: 1 |

Copyright 2023-Present -The University of Texas Health Science Center at Houston |