
|
|||||
|
 | |
| |
| |
| |
| |
| |
|
Gene: ASF1A |
Gene summary for ASF1A |
| Gene information | Species | Human | Gene symbol | ASF1A | Gene ID | 25842 |
| Gene name | anti-silencing function 1A histone chaperone | |
| Gene Alias | CGI-98 | |
| Cytomap | 6q22.31 | |
| Gene Type | protein-coding | GO ID | GO:0001503 | UniProtAcc | Q9Y294 |
Top |
Malignant transformation analysis |
| Identification of the aberrant gene expression in precancerous and cancerous lesions by comparing the gene expression of stem-like cells in diseased tissues with normal stem cells |
| Entrez ID | Symbol | Replicates | Species | Organ | Tissue | Adj P-value | Log2FC | Malignancy |
| 25842 | ASF1A | LZE2T | Human | Esophagus | ESCC | 1.63e-05 | 5.26e-01 | 0.082 |
| 25842 | ASF1A | LZE4T | Human | Esophagus | ESCC | 2.73e-19 | 6.49e-01 | 0.0811 |
| 25842 | ASF1A | LZE5T | Human | Esophagus | ESCC | 2.33e-03 | 3.08e-01 | 0.0514 |
| 25842 | ASF1A | LZE7T | Human | Esophagus | ESCC | 1.67e-06 | 5.92e-01 | 0.0667 |
| 25842 | ASF1A | LZE8T | Human | Esophagus | ESCC | 8.53e-03 | 1.63e-01 | 0.067 |
| 25842 | ASF1A | LZE20T | Human | Esophagus | ESCC | 1.55e-04 | 6.08e-02 | 0.0662 |
| 25842 | ASF1A | LZE24T | Human | Esophagus | ESCC | 1.57e-19 | 5.22e-01 | 0.0596 |
| 25842 | ASF1A | LZE21T | Human | Esophagus | ESCC | 1.02e-04 | 4.08e-01 | 0.0655 |
| 25842 | ASF1A | P1T-E | Human | Esophagus | ESCC | 1.18e-06 | 2.32e-01 | 0.0875 |
| 25842 | ASF1A | P2T-E | Human | Esophagus | ESCC | 3.54e-26 | 5.28e-01 | 0.1177 |
| 25842 | ASF1A | P4T-E | Human | Esophagus | ESCC | 1.18e-41 | 9.74e-01 | 0.1323 |
| 25842 | ASF1A | P5T-E | Human | Esophagus | ESCC | 5.28e-21 | 4.54e-01 | 0.1327 |
| 25842 | ASF1A | P8T-E | Human | Esophagus | ESCC | 3.73e-19 | 4.34e-01 | 0.0889 |
| 25842 | ASF1A | P9T-E | Human | Esophagus | ESCC | 1.98e-14 | 3.49e-01 | 0.1131 |
| 25842 | ASF1A | P10T-E | Human | Esophagus | ESCC | 1.26e-40 | 7.82e-01 | 0.116 |
| 25842 | ASF1A | P11T-E | Human | Esophagus | ESCC | 1.61e-14 | 4.81e-01 | 0.1426 |
| 25842 | ASF1A | P12T-E | Human | Esophagus | ESCC | 9.24e-35 | 7.52e-01 | 0.1122 |
| 25842 | ASF1A | P15T-E | Human | Esophagus | ESCC | 8.18e-36 | 9.63e-01 | 0.1149 |
| 25842 | ASF1A | P16T-E | Human | Esophagus | ESCC | 4.43e-27 | 5.95e-01 | 0.1153 |
| 25842 | ASF1A | P17T-E | Human | Esophagus | ESCC | 4.18e-07 | 3.61e-01 | 0.1278 |
| Page: 1 2 3 4 5 |
| Tissue | Expression Dynamics | Abbreviation |
| Esophagus | 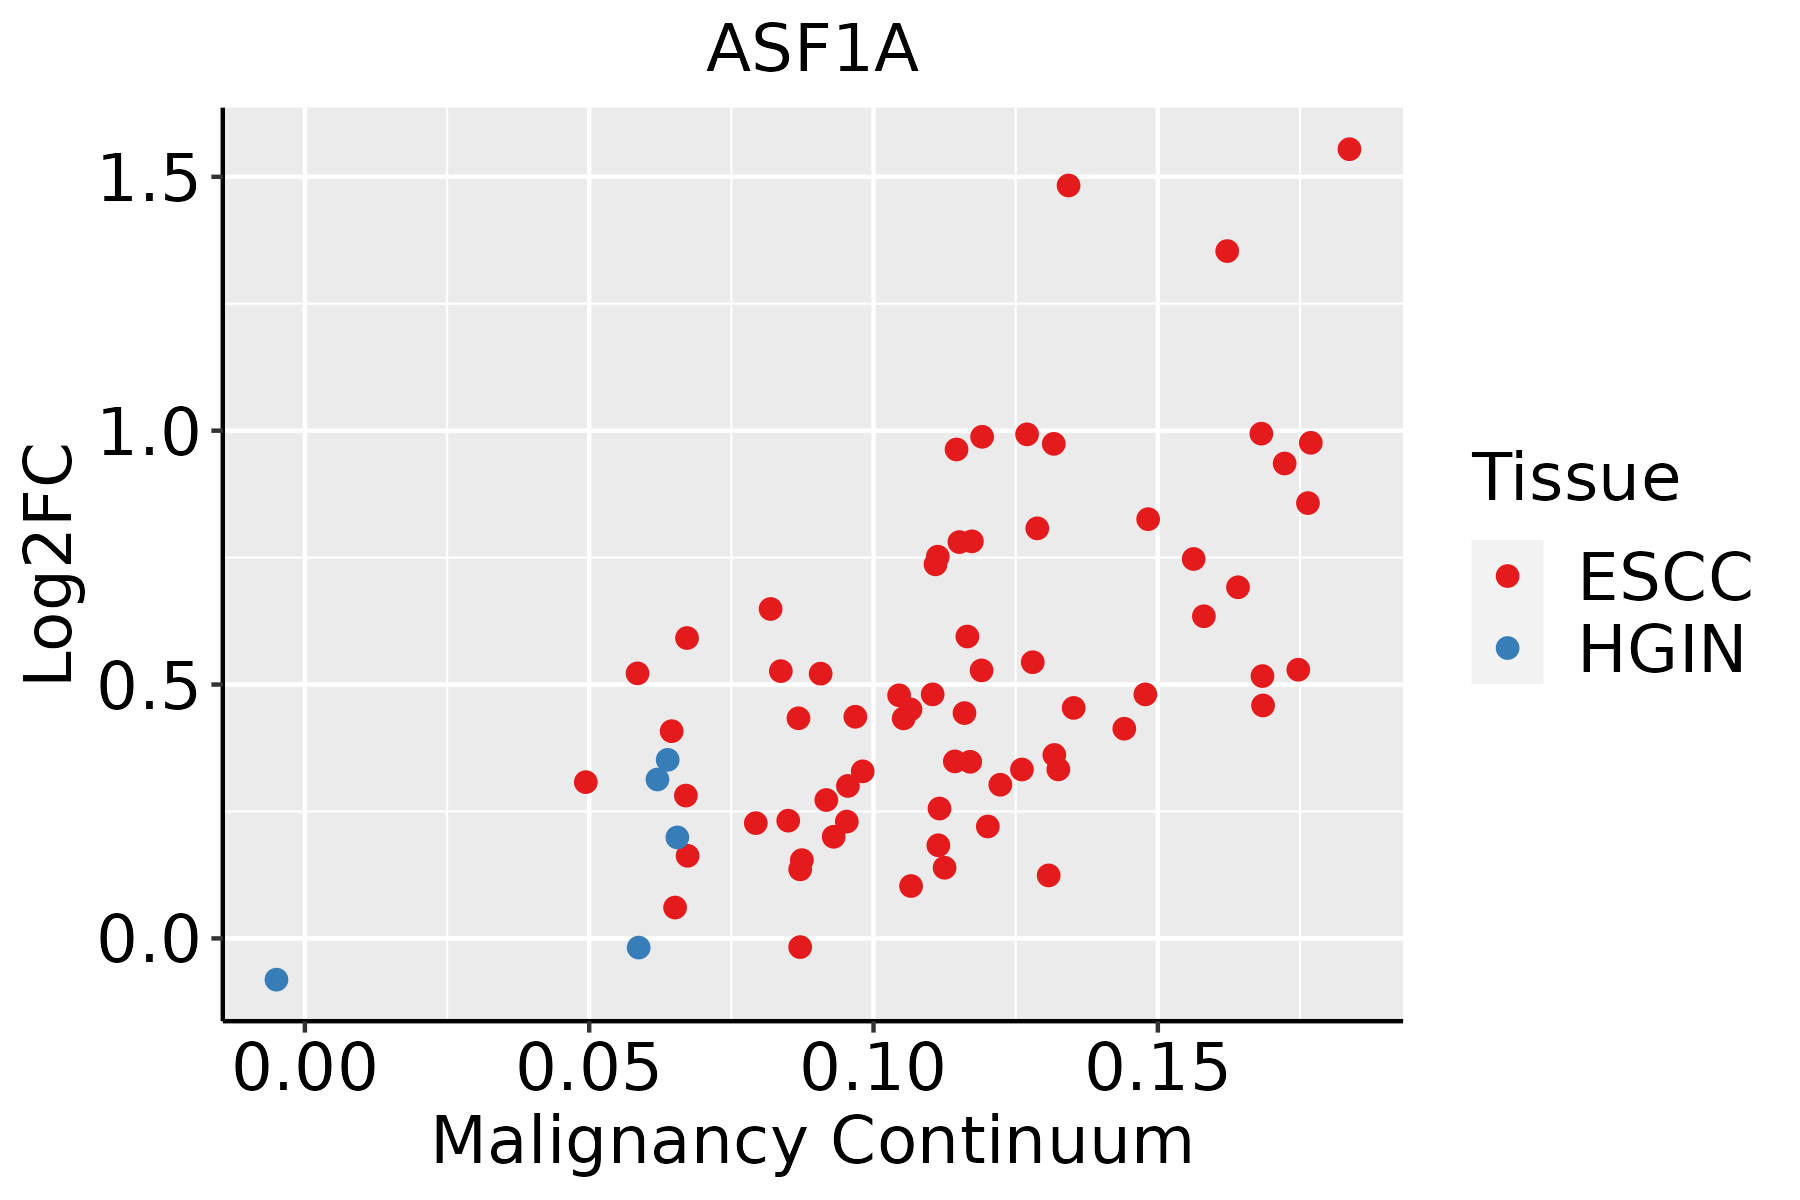 | ESCC: Esophageal squamous cell carcinoma |
| HGIN: High-grade intraepithelial neoplasias | ||
| LGIN: Low-grade intraepithelial neoplasias | ||
| Liver | 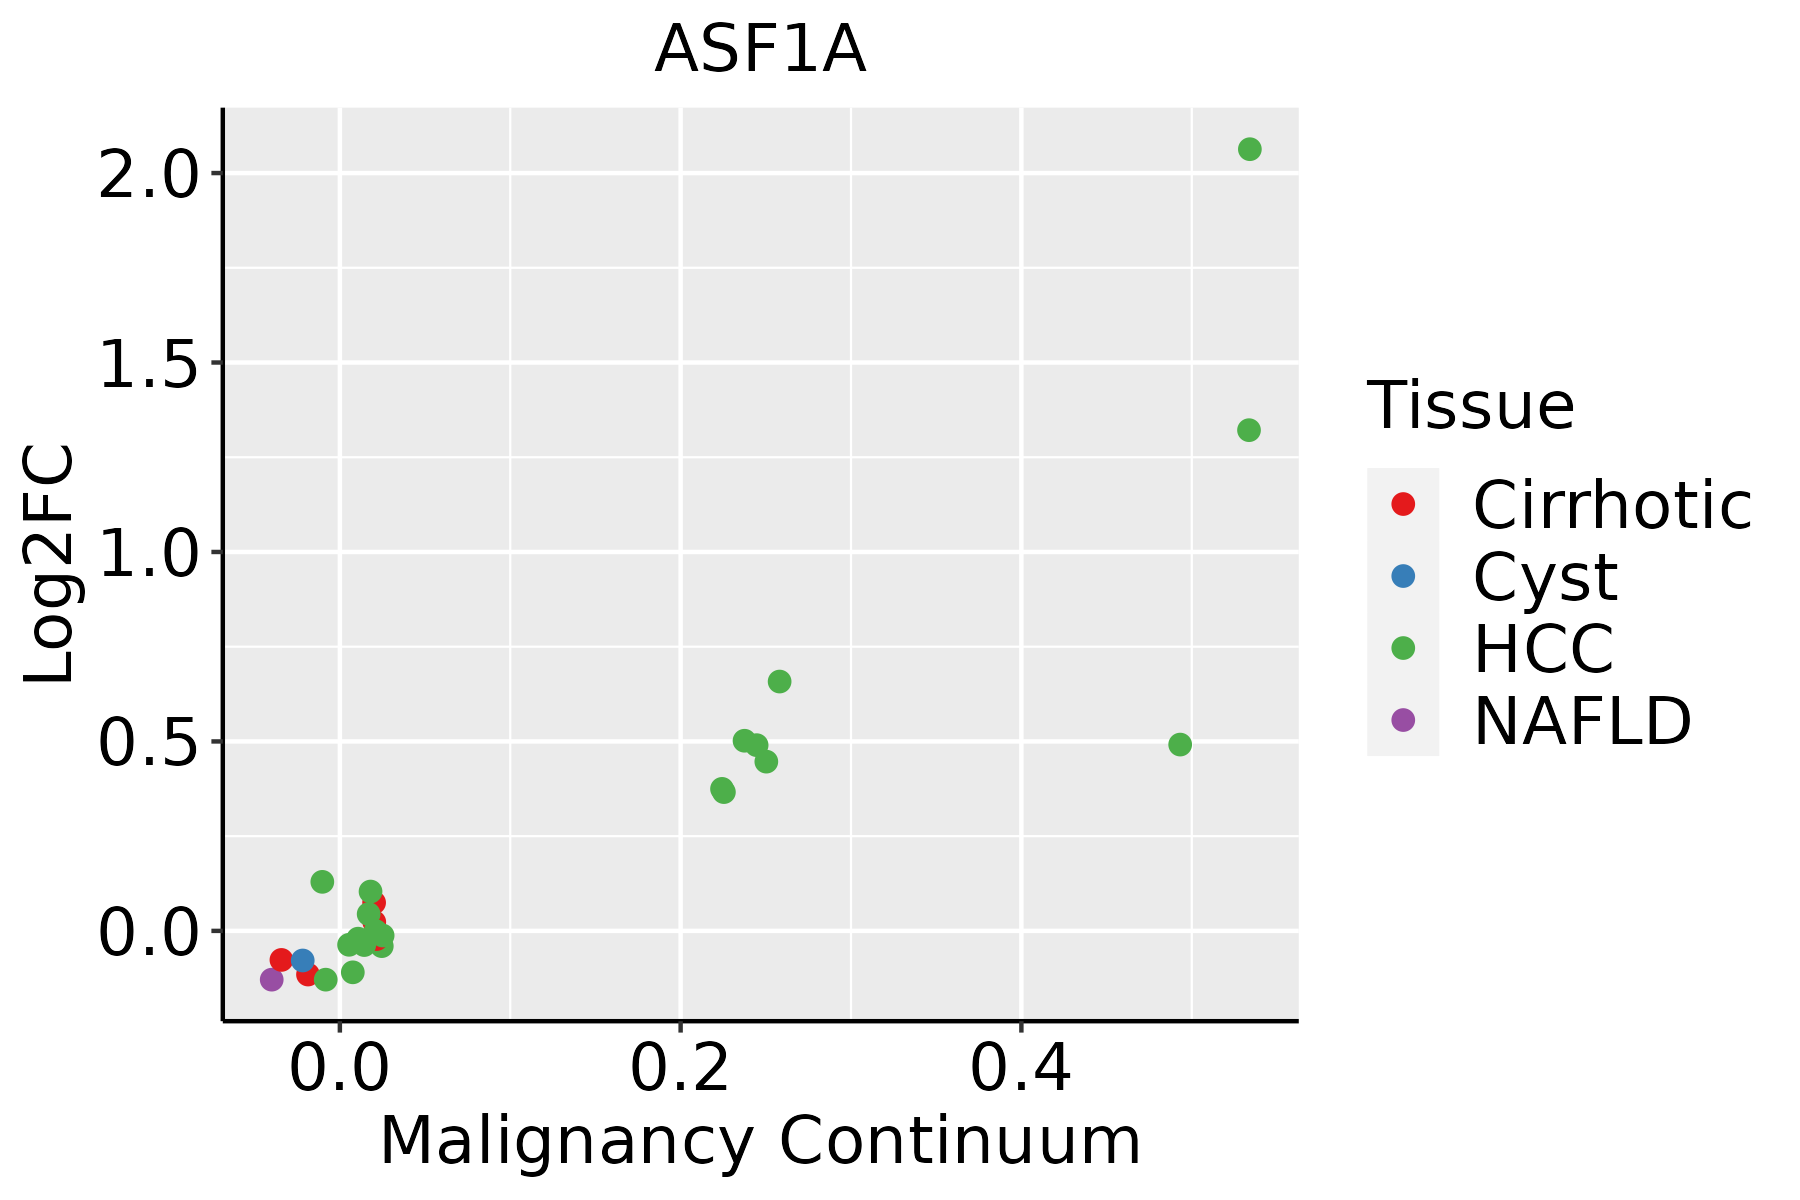 | HCC: Hepatocellular carcinoma |
| NAFLD: Non-alcoholic fatty liver disease | ||
| Oral Cavity | 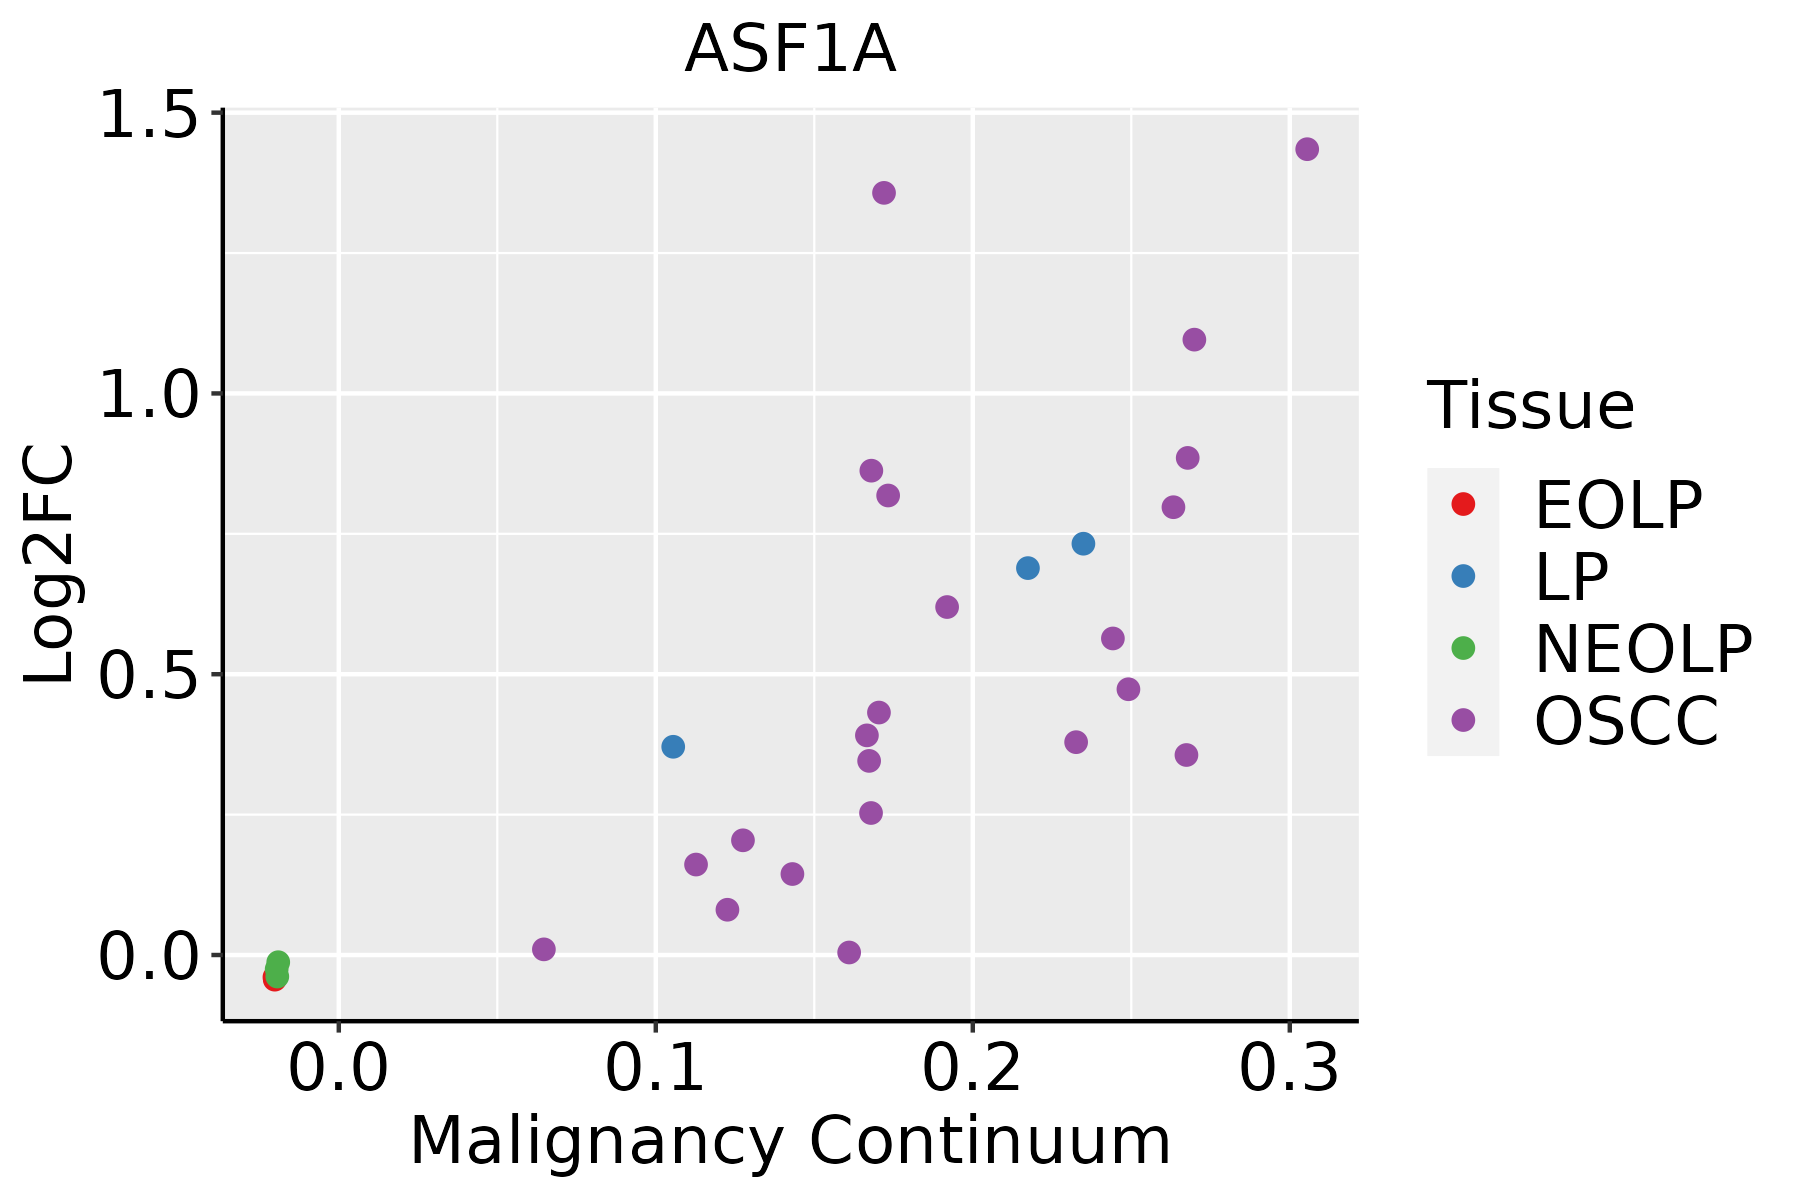 | EOLP: Erosive Oral lichen planus |
| LP: leukoplakia | ||
| NEOLP: Non-erosive oral lichen planus | ||
| OSCC: Oral squamous cell carcinoma | ||
| Skin | 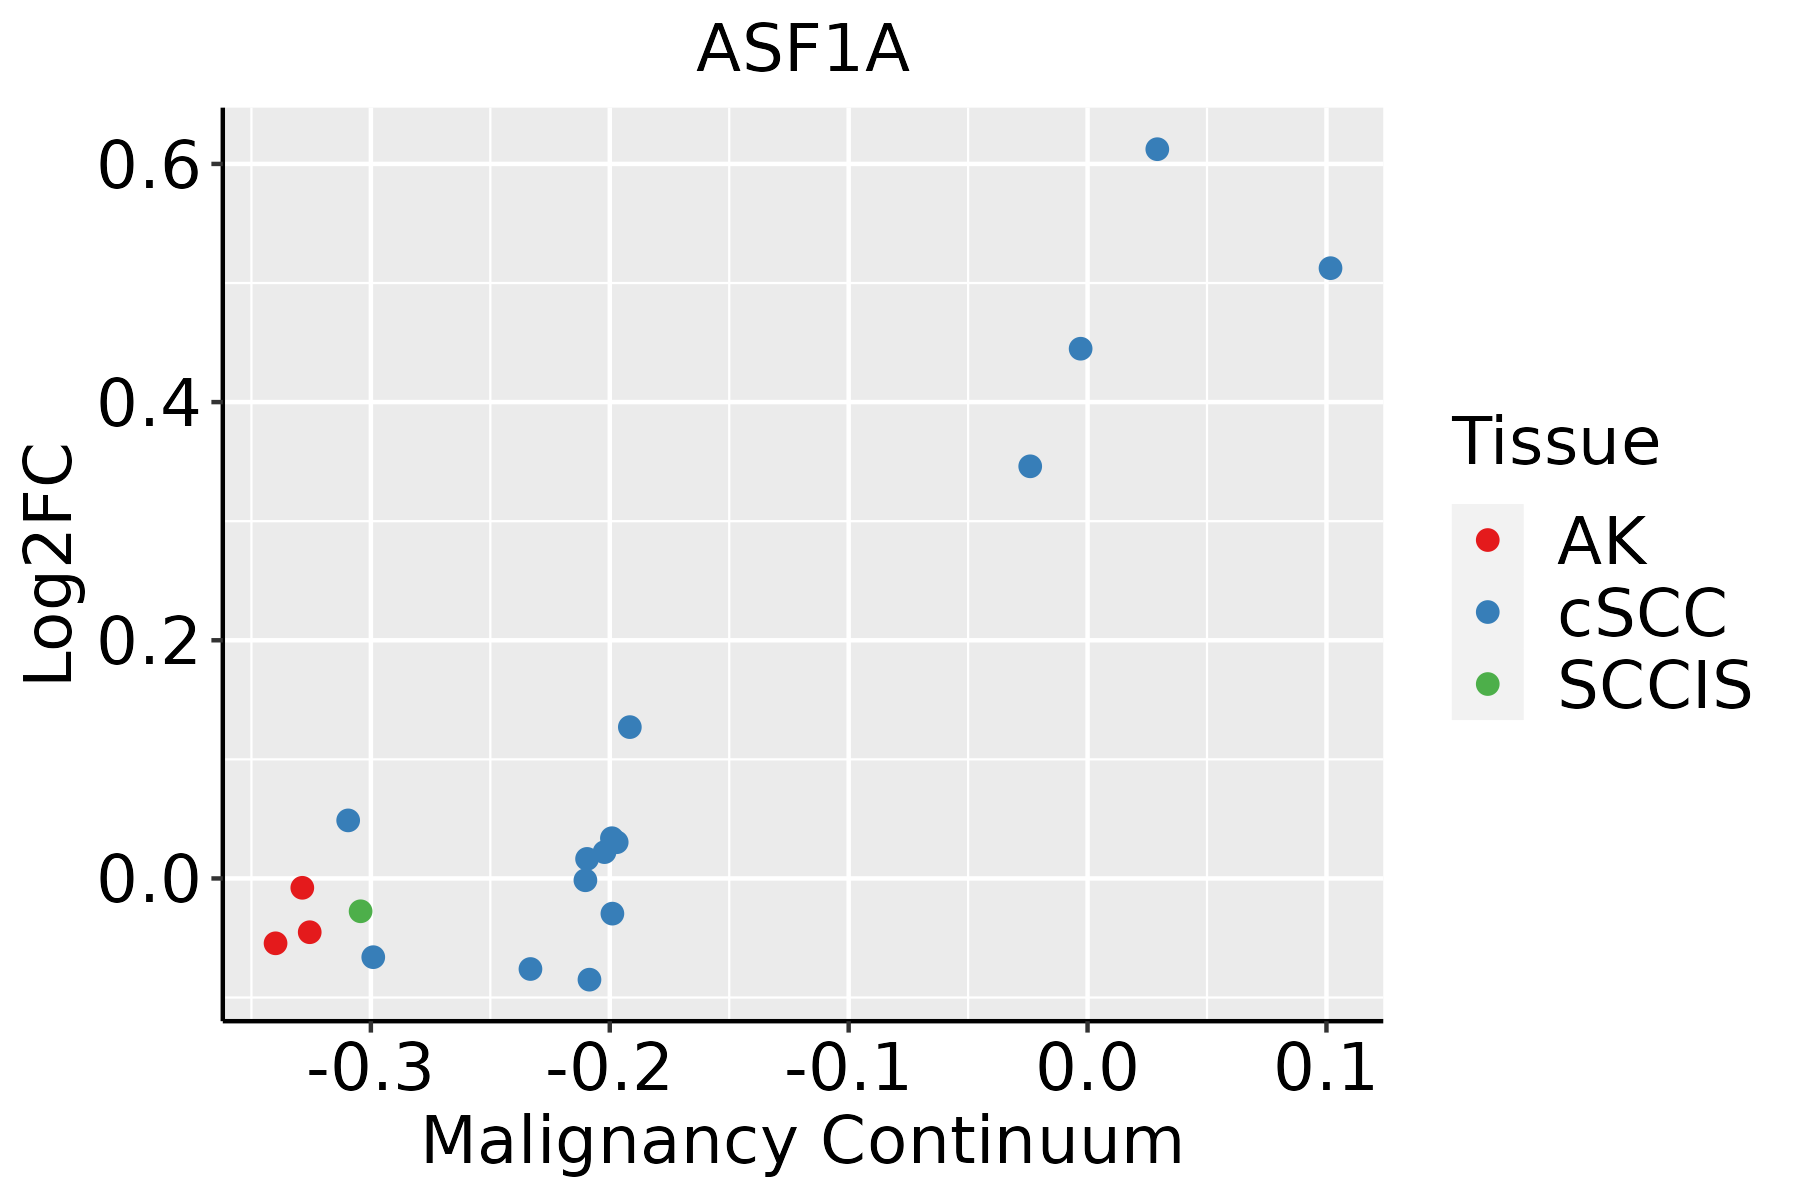 | AK: Actinic keratosis |
| cSCC: Cutaneous squamous cell carcinoma | ||
| SCCIS:squamous cell carcinoma in situ |
| ∗log2FC in expression of this searched gene in stem-like cells from each diseased tissue sample relative to stem-like cells in normal samples in each tissue plotted against the malignancy continuum. Samples are colored based on if they are from different disease stage. |
Top |
Malignant transformation related pathway analysis |
| Find out the enriched GO biological processes and KEGG pathways involved in transition from healthy to precancer to cancer |
| Tissue | Disease Stage | Enriched GO biological Processes |
| Colorectum | AD |  |
| Colorectum | SER |  |
| Colorectum | MSS |  |
| Colorectum | MSI-H |  |
| Colorectum | FAP |  |
| ∗Top 15 enriched GO BP terms are showed in the bar plot of each disease state in each tissue. Each row represents a significant GO biological process which is colored according to the -log10(p.adjust). |
| Page: 1 2 3 4 5 6 7 8 9 |
| GO ID | Tissue | Disease Stage | Description | Gene Ratio | Bg Ratio | pvalue | p.adjust | Count |
| GO:000632517 | Esophagus | ESCC | chromatin organization | 240/8552 | 409/18723 | 6.52e-08 | 1.14e-06 | 240 |
| GO:000164918 | Esophagus | ESCC | osteoblast differentiation | 140/8552 | 229/18723 | 1.63e-06 | 1.95e-05 | 140 |
| GO:000150317 | Esophagus | ESCC | ossification | 232/8552 | 408/18723 | 3.00e-06 | 3.40e-05 | 232 |
| GO:00016495 | Liver | Cirrhotic | osteoblast differentiation | 80/4634 | 229/18723 | 3.39e-04 | 2.91e-03 | 80 |
| GO:00015035 | Liver | Cirrhotic | ossification | 127/4634 | 408/18723 | 1.89e-03 | 1.19e-02 | 127 |
| GO:000632511 | Liver | HCC | chromatin organization | 206/7958 | 409/18723 | 7.23e-04 | 4.41e-03 | 206 |
| GO:000164911 | Liver | HCC | osteoblast differentiation | 115/7958 | 229/18723 | 1.08e-02 | 3.99e-02 | 115 |
| GO:000150310 | Oral cavity | OSCC | ossification | 203/7305 | 408/18723 | 5.54e-06 | 6.19e-05 | 203 |
| GO:000164910 | Oral cavity | OSCC | osteoblast differentiation | 118/7305 | 229/18723 | 7.51e-05 | 5.85e-04 | 118 |
| GO:000632510 | Oral cavity | OSCC | chromatin organization | 190/7305 | 409/18723 | 1.17e-03 | 5.97e-03 | 190 |
| GO:00426927 | Oral cavity | OSCC | muscle cell differentiation | 175/7305 | 384/18723 | 4.79e-03 | 1.92e-02 | 175 |
| GO:000150315 | Oral cavity | LP | ossification | 123/4623 | 408/18723 | 6.55e-03 | 3.84e-02 | 123 |
| GO:000164916 | Oral cavity | LP | osteoblast differentiation | 73/4623 | 229/18723 | 8.09e-03 | 4.40e-02 | 73 |
| GO:000632519 | Skin | cSCC | chromatin organization | 147/4864 | 409/18723 | 4.41e-06 | 6.52e-05 | 147 |
| GO:000164923 | Skin | cSCC | osteoblast differentiation | 89/4864 | 229/18723 | 1.18e-05 | 1.51e-04 | 89 |
| GO:000633812 | Skin | cSCC | chromatin remodeling | 94/4864 | 255/18723 | 7.58e-05 | 7.26e-04 | 94 |
| GO:00718241 | Skin | cSCC | protein-DNA complex subunit organization | 87/4864 | 241/18723 | 3.09e-04 | 2.47e-03 | 87 |
| GO:000150323 | Skin | cSCC | ossification | 137/4864 | 408/18723 | 3.39e-04 | 2.68e-03 | 137 |
| GO:00711031 | Skin | cSCC | DNA conformation change | 96/4864 | 290/18723 | 3.87e-03 | 2.07e-02 | 96 |
| Page: 1 |
| Pathway ID | Tissue | Disease Stage | Description | Gene Ratio | Bg Ratio | pvalue | p.adjust | qvalue | Count |
| Page: 1 |
Top |
Cell-cell communication analysis |
| Identification of potential cell-cell interactions between two cell types and their ligand-receptor pairs for different disease states |
| Ligand | Receptor | LRpair | Pathway | Tissue | Disease Stage |
| Page: 1 |
Top |
Single-cell gene regulatory network inference analysis |
| Find out the significant the regulons (TFs) and the target genes of each regulon across cell types for different disease states |
| TF | Cell Type | Tissue | Disease Stage | Target Gene | RSS | Regulon Activity |
| ∗The dot plots of a searched regulon are shown for all cell subpopulations in each disease state of each tissue based on the regulon specific score inferred using pySCENIC and by calculating the average expression. |
| Page: 1 |
Top |
Somatic mutation of malignant transformation related genes |
| Annotation of somatic variants for genes involved in malignant transformation |
| Hugo Symbol | Variant Class | Variant Classification | dbSNP RS | HGVSc | HGVSp | HGVSp Short | SWISSPROT | BIOTYPE | SIFT | PolyPhen | Tumor Sample Barcode | Tissue | Histology | Sex | Age | Stage | Therapy Types | Drugs | Outcome |
| ASF1A | SNV | Missense_Mutation | c.245N>T | p.Gly82Val | p.G82V | Q9Y294 | protein_coding | deleterious(0.03) | benign(0.441) | TCGA-A2-A25A-01 | Breast | breast invasive carcinoma | Female | <65 | I/II | Unspecific | Cytoxan | SD | |
| ASF1A | insertion | Nonsense_Mutation | novel | c.355_356insTCAAGTGATTCTCCTGCCTCAGCCTCCCAAGT | p.Glu119ValfsTer3 | p.E119Vfs*3 | Q9Y294 | protein_coding | TCGA-A2-A0EY-01 | Breast | breast invasive carcinoma | Female | <65 | I/II | Chemotherapy | adriamycin | SD | ||
| ASF1A | SNV | Missense_Mutation | c.520C>A | p.Leu174Ile | p.L174I | Q9Y294 | protein_coding | tolerated(0.13) | benign(0.231) | TCGA-AA-3977-01 | Colorectum | colon adenocarcinoma | Male | >=65 | I/II | Unknown | Unknown | SD | |
| ASF1A | SNV | Missense_Mutation | c.160G>A | p.Asp54Asn | p.D54N | Q9Y294 | protein_coding | deleterious(0) | probably_damaging(1) | TCGA-AA-A00N-01 | Colorectum | colon adenocarcinoma | Male | >=65 | I/II | Unknown | Unknown | PD | |
| ASF1A | SNV | Missense_Mutation | c.418N>A | p.Leu140Met | p.L140M | Q9Y294 | protein_coding | deleterious(0) | probably_damaging(1) | TCGA-D5-6926-01 | Colorectum | colon adenocarcinoma | Male | >=65 | III/IV | Chemotherapy | 5-fluorouracil | SD | |
| ASF1A | SNV | Missense_Mutation | rs755432972 | c.199G>A | p.Ala67Thr | p.A67T | Q9Y294 | protein_coding | tolerated(0.23) | probably_damaging(0.926) | TCGA-A5-A0GH-01 | Endometrium | uterine corpus endometrioid carcinoma | Female | <65 | I/II | Unknown | Unknown | SD |
| ASF1A | SNV | Missense_Mutation | c.325G>T | p.Val109Phe | p.V109F | Q9Y294 | protein_coding | deleterious(0) | probably_damaging(0.983) | TCGA-AP-A059-01 | Endometrium | uterine corpus endometrioid carcinoma | Female | >=65 | I/II | Unknown | Unknown | SD | |
| ASF1A | SNV | Missense_Mutation | c.274N>A | p.Val92Ile | p.V92I | Q9Y294 | protein_coding | deleterious(0) | probably_damaging(0.997) | TCGA-AP-A0LM-01 | Endometrium | uterine corpus endometrioid carcinoma | Female | <65 | III/IV | Chemotherapy | cisplatin | SD | |
| ASF1A | SNV | Missense_Mutation | novel | c.136N>T | p.Gly46Cys | p.G46C | Q9Y294 | protein_coding | deleterious(0) | probably_damaging(1) | TCGA-AX-A1CE-01 | Endometrium | uterine corpus endometrioid carcinoma | Female | <65 | I/II | Unspecific | Paclitaxel | SD |
| ASF1A | SNV | Missense_Mutation | novel | c.556N>C | p.Trp186Arg | p.W186R | Q9Y294 | protein_coding | tolerated(0.32) | benign(0.093) | TCGA-DD-AADR-01 | Liver | liver hepatocellular carcinoma | Male | <65 | I/II | Unknown | Unknown | PD |
| Page: 1 2 |
Top |
Related drugs of malignant transformation related genes |
| Identification of chemicals and drugs interact with genes involved in malignant transfromation |
| (DGIdb 4.0) |
| Entrez ID | Symbol | Category | Interaction Types | Drug Claim Name | Drug Name | PMIDs |
| Page: 1 |

Copyright 2023-Present -The University of Texas Health Science Center at Houston |