
|
|||||
|
 | |
| |
| |
| |
| |
| |
|
Gene: ASCL2 |
Gene summary for ASCL2 |
| Gene information | Species | Human | Gene symbol | ASCL2 | Gene ID | 430 |
| Gene name | achaete-scute family bHLH transcription factor 2 | |
| Gene Alias | ASH2 | |
| Cytomap | 11p15.5 | |
| Gene Type | protein-coding | GO ID | GO:0000003 | UniProtAcc | Q99929 |
Top |
Malignant transformation analysis |
| Identification of the aberrant gene expression in precancerous and cancerous lesions by comparing the gene expression of stem-like cells in diseased tissues with normal stem cells |
| Entrez ID | Symbol | Replicates | Species | Organ | Tissue | Adj P-value | Log2FC | Malignancy |
| 430 | ASCL2 | HTA11_3410_2000001011 | Human | Colorectum | AD | 5.61e-11 | 3.47e-01 | 0.0155 |
| 430 | ASCL2 | HTA11_2951_2000001011 | Human | Colorectum | AD | 4.24e-12 | 9.82e-01 | 0.0216 |
| 430 | ASCL2 | HTA11_1938_2000001011 | Human | Colorectum | AD | 2.00e-04 | 4.40e-01 | -0.0811 |
| 430 | ASCL2 | HTA11_3361_2000001011 | Human | Colorectum | AD | 3.88e-02 | 3.69e-01 | -0.1207 |
| 430 | ASCL2 | HTA11_696_2000001011 | Human | Colorectum | AD | 3.29e-13 | 5.95e-01 | -0.1464 |
| 430 | ASCL2 | HTA11_866_2000001011 | Human | Colorectum | AD | 4.98e-02 | 2.02e-01 | -0.1001 |
| 430 | ASCL2 | HTA11_1391_2000001011 | Human | Colorectum | AD | 5.85e-19 | 9.21e-01 | -0.059 |
| 430 | ASCL2 | HTA11_866_3004761011 | Human | Colorectum | AD | 2.29e-62 | 1.56e+00 | 0.096 |
| 430 | ASCL2 | HTA11_9408_2000001011 | Human | Colorectum | AD | 3.79e-19 | 1.35e+00 | 0.0451 |
| 430 | ASCL2 | HTA11_8622_2000001021 | Human | Colorectum | SER | 6.44e-10 | 7.35e-01 | 0.0528 |
| 430 | ASCL2 | HTA11_7663_2000001011 | Human | Colorectum | SER | 9.65e-05 | 8.67e-01 | 0.0131 |
| 430 | ASCL2 | HTA11_10711_2000001011 | Human | Colorectum | AD | 6.97e-31 | 1.17e+00 | 0.0338 |
| 430 | ASCL2 | HTA11_7696_3000711011 | Human | Colorectum | AD | 9.60e-63 | 1.50e+00 | 0.0674 |
| 430 | ASCL2 | HTA11_6818_2000001011 | Human | Colorectum | AD | 2.92e-15 | 1.20e+00 | 0.0112 |
| 430 | ASCL2 | HTA11_11156_2000001011 | Human | Colorectum | AD | 4.45e-12 | 1.26e+00 | 0.0397 |
| 430 | ASCL2 | HTA11_6818_2000001021 | Human | Colorectum | AD | 9.50e-40 | 1.39e+00 | 0.0588 |
| 430 | ASCL2 | HTA11_99999970781_79442 | Human | Colorectum | MSS | 4.80e-27 | 7.49e-01 | 0.294 |
| 430 | ASCL2 | HTA11_99999965062_69753 | Human | Colorectum | MSI-H | 5.05e-05 | 9.32e-01 | 0.3487 |
| 430 | ASCL2 | HTA11_99999965104_69814 | Human | Colorectum | MSS | 7.20e-39 | 1.35e+00 | 0.281 |
| 430 | ASCL2 | HTA11_99999971662_82457 | Human | Colorectum | MSS | 2.40e-49 | 1.10e+00 | 0.3859 |
| Page: 1 2 3 4 5 6 |
| Tissue | Expression Dynamics | Abbreviation |
| Colorectum (GSE201348) |  | FAP: Familial adenomatous polyposis |
| CRC: Colorectal cancer | ||
| Colorectum (HTA11) |  | AD: Adenomas |
| SER: Sessile serrated lesions | ||
| MSI-H: Microsatellite-high colorectal cancer | ||
| MSS: Microsatellite stable colorectal cancer | ||
| Esophagus |  | ESCC: Esophageal squamous cell carcinoma |
| HGIN: High-grade intraepithelial neoplasias | ||
| LGIN: Low-grade intraepithelial neoplasias | ||
| Liver | 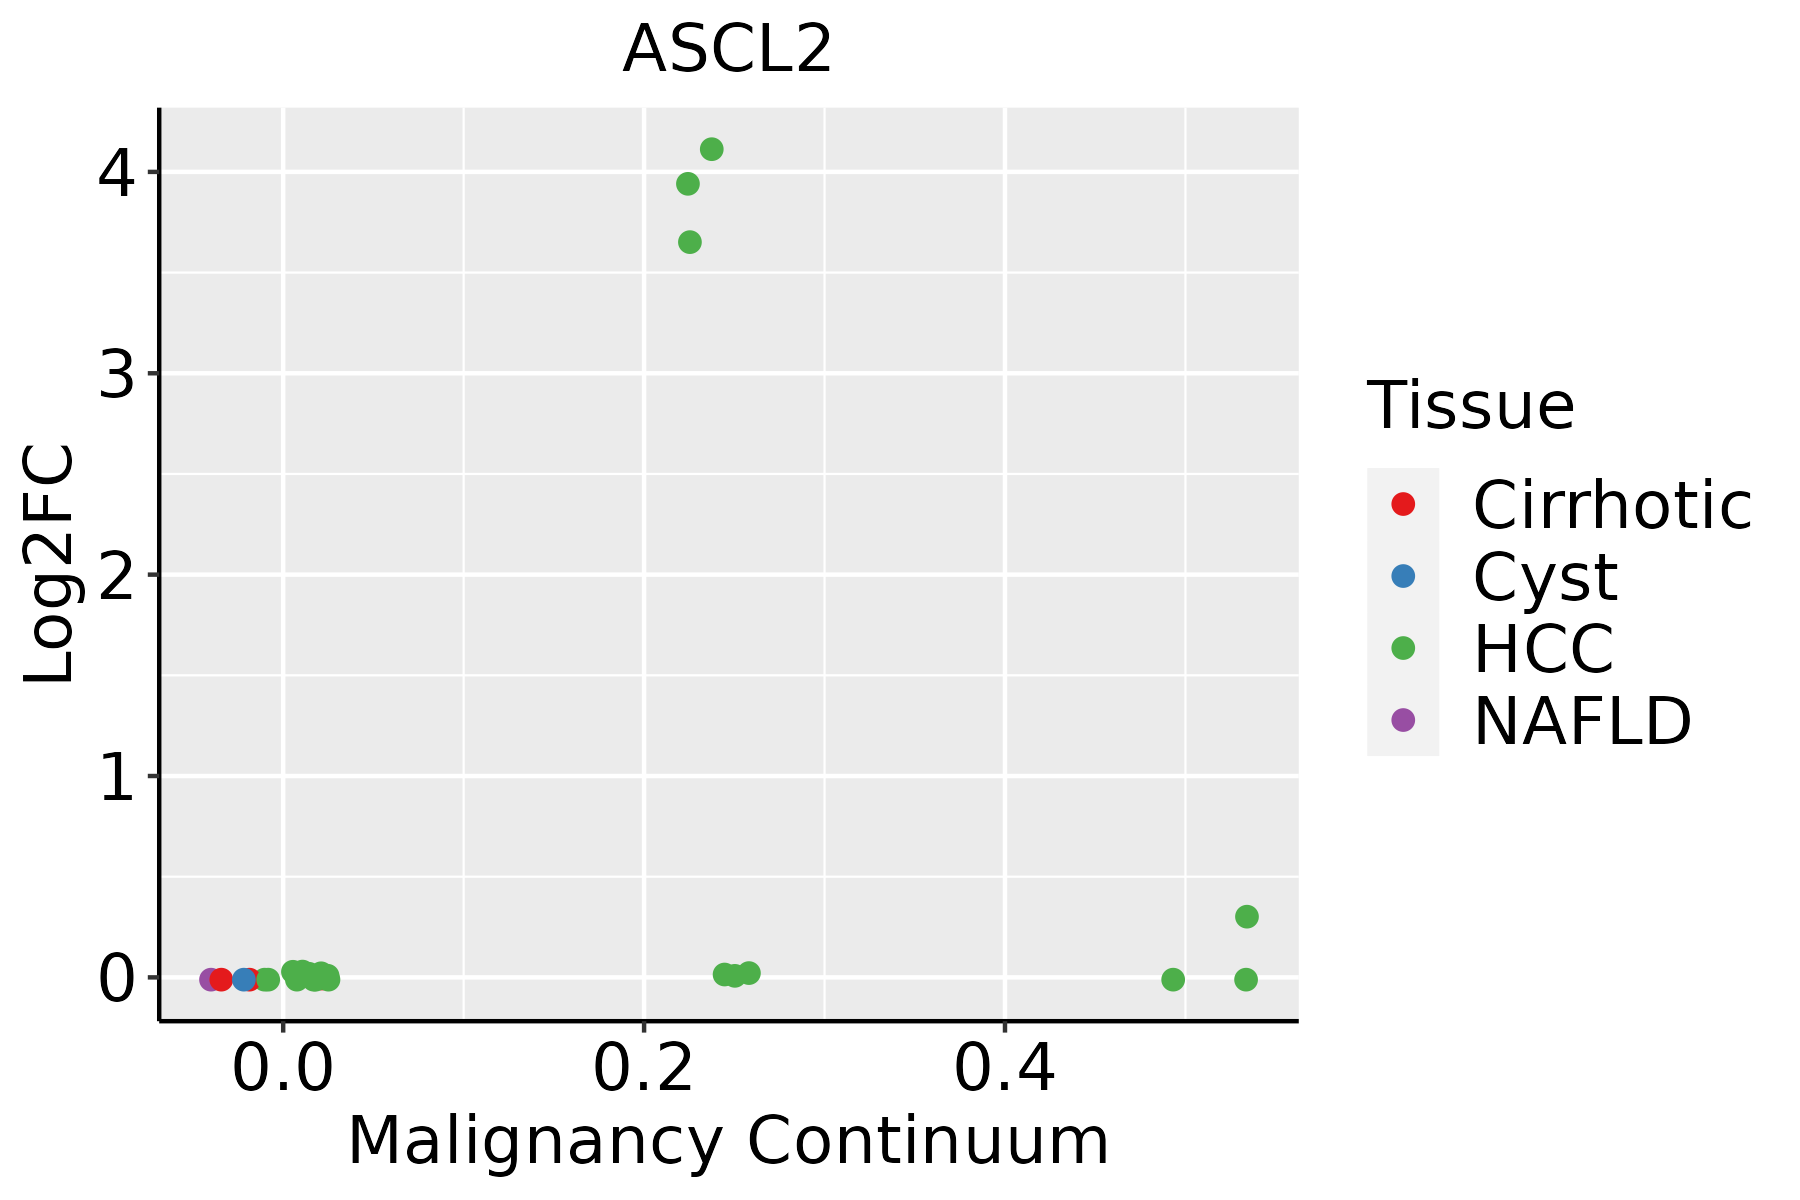 | HCC: Hepatocellular carcinoma |
| NAFLD: Non-alcoholic fatty liver disease | ||
| Oral Cavity | 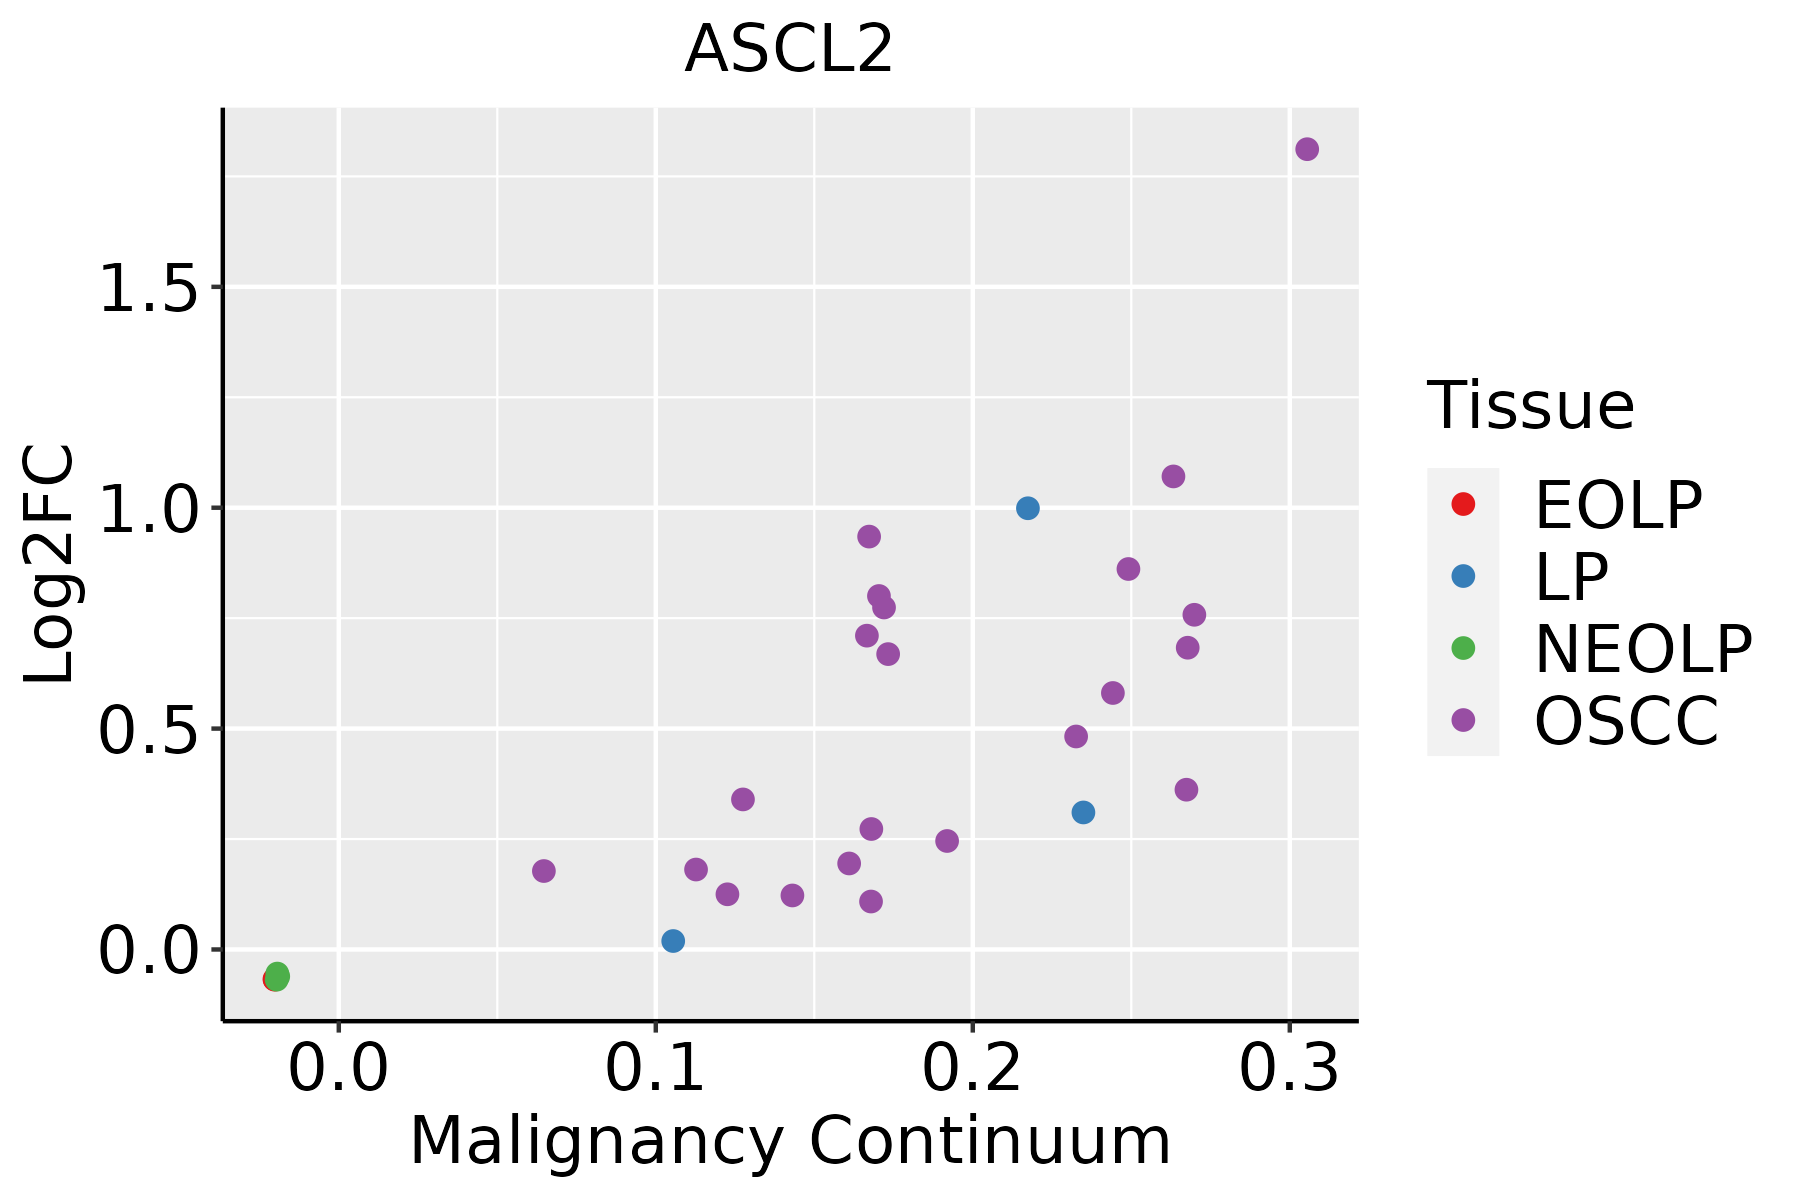 | EOLP: Erosive Oral lichen planus |
| LP: leukoplakia | ||
| NEOLP: Non-erosive oral lichen planus | ||
| OSCC: Oral squamous cell carcinoma | ||
| Skin |  | AK: Actinic keratosis |
| cSCC: Cutaneous squamous cell carcinoma | ||
| SCCIS:squamous cell carcinoma in situ |
| ∗log2FC in expression of this searched gene in stem-like cells from each diseased tissue sample relative to stem-like cells in normal samples in each tissue plotted against the malignancy continuum. Samples are colored based on if they are from different disease stage. |
Top |
Malignant transformation related pathway analysis |
| Find out the enriched GO biological processes and KEGG pathways involved in transition from healthy to precancer to cancer |
| Tissue | Disease Stage | Enriched GO biological Processes |
| Colorectum | AD |  |
| Colorectum | SER |  |
| Colorectum | MSS |  |
| Colorectum | MSI-H |  |
| Colorectum | FAP |  |
| ∗Top 15 enriched GO BP terms are showed in the bar plot of each disease state in each tissue. Each row represents a significant GO biological process which is colored according to the -log10(p.adjust). |
| Page: 1 2 3 4 5 6 7 8 9 |
| GO ID | Tissue | Disease Stage | Description | Gene Ratio | Bg Ratio | pvalue | p.adjust | Count |
| GO:0001701 | Colorectum | AD | in utero embryonic development | 110/3918 | 367/18723 | 2.36e-05 | 4.62e-04 | 110 |
| GO:0001890 | Colorectum | AD | placenta development | 51/3918 | 144/18723 | 3.99e-05 | 7.16e-04 | 51 |
| GO:0001892 | Colorectum | AD | embryonic placenta development | 33/3918 | 82/18723 | 5.30e-05 | 9.01e-04 | 33 |
| GO:0070482 | Colorectum | AD | response to oxygen levels | 99/3918 | 347/18723 | 4.29e-04 | 4.82e-03 | 99 |
| GO:0061458 | Colorectum | AD | reproductive system development | 116/3918 | 427/18723 | 1.11e-03 | 1.01e-02 | 116 |
| GO:0001666 | Colorectum | AD | response to hypoxia | 86/3918 | 307/18723 | 1.77e-03 | 1.46e-02 | 86 |
| GO:0048608 | Colorectum | AD | reproductive structure development | 114/3918 | 424/18723 | 1.78e-03 | 1.47e-02 | 114 |
| GO:0050767 | Colorectum | AD | regulation of neurogenesis | 99/3918 | 364/18723 | 2.35e-03 | 1.82e-02 | 99 |
| GO:0036293 | Colorectum | AD | response to decreased oxygen levels | 88/3918 | 322/18723 | 3.42e-03 | 2.49e-02 | 88 |
| GO:0048568 | Colorectum | AD | embryonic organ development | 112/3918 | 427/18723 | 4.60e-03 | 3.14e-02 | 112 |
| GO:00018901 | Colorectum | SER | placenta development | 43/2897 | 144/18723 | 9.10e-06 | 3.03e-04 | 43 |
| GO:00018921 | Colorectum | SER | embryonic placenta development | 28/2897 | 82/18723 | 2.24e-05 | 6.43e-04 | 28 |
| GO:00704821 | Colorectum | SER | response to oxygen levels | 79/2897 | 347/18723 | 1.99e-04 | 3.64e-03 | 79 |
| GO:00016661 | Colorectum | SER | response to hypoxia | 69/2897 | 307/18723 | 7.07e-04 | 9.39e-03 | 69 |
| GO:00362931 | Colorectum | SER | response to decreased oxygen levels | 71/2897 | 322/18723 | 1.04e-03 | 1.22e-02 | 71 |
| GO:00017011 | Colorectum | SER | in utero embryonic development | 77/2897 | 367/18723 | 2.77e-03 | 2.48e-02 | 77 |
| GO:00614581 | Colorectum | SER | reproductive system development | 87/2897 | 427/18723 | 3.69e-03 | 3.07e-02 | 87 |
| GO:00486081 | Colorectum | SER | reproductive structure development | 85/2897 | 424/18723 | 6.33e-03 | 4.56e-02 | 85 |
| GO:00018902 | Colorectum | MSS | placenta development | 51/3467 | 144/18723 | 1.10e-06 | 3.77e-05 | 51 |
| GO:00614582 | Colorectum | MSS | reproductive system development | 115/3467 | 427/18723 | 9.86e-06 | 2.39e-04 | 115 |
| Page: 1 2 3 4 5 6 7 |
| Pathway ID | Tissue | Disease Stage | Description | Gene Ratio | Bg Ratio | pvalue | p.adjust | qvalue | Count |
| Page: 1 |
Top |
Cell-cell communication analysis |
| Identification of potential cell-cell interactions between two cell types and their ligand-receptor pairs for different disease states |
| Ligand | Receptor | LRpair | Pathway | Tissue | Disease Stage |
| Page: 1 |
Top |
Single-cell gene regulatory network inference analysis |
| Find out the significant the regulons (TFs) and the target genes of each regulon across cell types for different disease states |
| TF | Cell Type | Tissue | Disease Stage | Target Gene | RSS | Regulon Activity |
| ASCL2 | M1MAC | Breast | DCIS | FGFBP2,SPON2,KLRF1, etc. | 1.12e-01 |  |
| ASCL2 | DC | Breast | DCIS | FGFBP2,SPON2,KLRF1, etc. | 1.12e-01 | |
| ASCL2 | DC | Breast | Healthy | FGFBP2,SPON2,KLRF1, etc. | 4.03e-01 |  |
| ASCL2 | M1MAC | Breast | Healthy | FGFBP2,SPON2,KLRF1, etc. | 4.26e-02 | |
| ASCL2 | M1MAC | Breast | IDC | FGFBP2,SPON2,KLRF1, etc. | 2.36e-01 |  |
| ASCL2 | DC | Breast | IDC | FGFBP2,SPON2,KLRF1, etc. | 9.54e-02 | |
| ASCL2 | INMON | Breast | IDC | FGFBP2,SPON2,KLRF1, etc. | 1.46e-01 | |
| ASCL2 | MON | Breast | IDC | FGFBP2,SPON2,KLRF1, etc. | 4.80e-02 | |
| ASCL2 | INMON | Breast | Precancer | FGFBP2,SPON2,KLRF1, etc. | 3.50e-01 |  |
| ASCL2 | BAS | Cervix | HSIL_HPV | LPAR5,MYLPF,NKD2, etc. | 7.58e-02 |  |
| ∗The dot plots of a searched regulon are shown for all cell subpopulations in each disease state of each tissue based on the regulon specific score inferred using pySCENIC and by calculating the average expression. |
| Page: 1 2 3 4 5 6 7 |
Top |
Somatic mutation of malignant transformation related genes |
| Annotation of somatic variants for genes involved in malignant transformation |
| Hugo Symbol | Variant Class | Variant Classification | dbSNP RS | HGVSc | HGVSp | HGVSp Short | SWISSPROT | BIOTYPE | SIFT | PolyPhen | Tumor Sample Barcode | Tissue | Histology | Sex | Age | Stage | Therapy Types | Drugs | Outcome |
| ASCL2 | SNV | Missense_Mutation | novel | c.127N>T | p.Ala43Ser | p.A43S | Q99929 | protein_coding | tolerated(0.97) | benign(0.003) | TCGA-A6-6780-01 | Colorectum | colon adenocarcinoma | Male | >=65 | I/II | Unknown | Unknown | SD |
| ASCL2 | SNV | Missense_Mutation | novel | c.298N>G | p.Arg100Gly | p.R100G | Q99929 | protein_coding | deleterious(0) | possibly_damaging(0.581) | TCGA-2Y-A9GW-01 | Liver | liver hepatocellular carcinoma | Male | <65 | I/II | Unknown | Unknown | PD |
| Page: 1 |
Top |
Related drugs of malignant transformation related genes |
| Identification of chemicals and drugs interact with genes involved in malignant transfromation |
| (DGIdb 4.0) |
| Entrez ID | Symbol | Category | Interaction Types | Drug Claim Name | Drug Name | PMIDs |
| Page: 1 |

Copyright 2023-Present -The University of Texas Health Science Center at Houston |