Schematic overview of the cellular and molecular mechanisms involved in the cancer progression, including the proposed cellular and molecular mechanisms in cancer cells trajectory. AT1: alveolar type 1 cells; AT2: alveolar type 2 cells; AAH: atypical adenomatous hyperplasia; AIS: adenocarcinoma in situ; MIA: minimally invasive adenocarcinoma; IA: invasive adenocarcinoma; EMT: epithelial-mesenchymal transition

Home

Download

Statistics

Help

Contact

Center for Computational Systems Medicine
leaf

Gene summary

leaf

Malignant transformation analysis

leaf

Malignant transformation related pathway analysis

leaf

Cell-cell communication analysis

leaf

Single-cell gene regulatory network inference analysis

leaf

Somatic mutation of malignant transformation related genes

leaf

Related drugs of malignant transformation related genes

Gene: ASCC2

Gene summary for ASCC2

check button Gene summary.

Gene informationSpeciesHuman
Gene symbol

ASCC2

Gene ID

84164

Gene nameactivating signal cointegrator 1 complex subunit 2
Gene AliasASC1p100
Cytomap22q12.2
Gene Typeprotein-coding
GO ID

GO:0006139

UniProtAcc

Q9H1I8


Top

Malignant transformation analysis

check button Identification of the aberrant gene expression in precancerous and cancerous lesions by comparing the gene expression of stem-like cells in diseased tissues with normal stem cells
check button Malignant transformation involving gene list.
Entrez IDSymbolReplicatesSpeciesOrganTissueAdj P-valueLog2FCMalignancy
84164ASCC2LZE4THumanEsophagusESCC3.19e-133.61e-010.0811
84164ASCC2LZE7THumanEsophagusESCC9.40e-094.73e-010.0667
84164ASCC2LZE8THumanEsophagusESCC4.85e-071.81e-010.067
84164ASCC2LZE20THumanEsophagusESCC2.87e-083.08e-010.0662
84164ASCC2LZE21D1HumanEsophagusHGIN1.59e-023.00e-010.0632
84164ASCC2LZE22D1HumanEsophagusHGIN1.34e-062.98e-010.0595
84164ASCC2LZE22THumanEsophagusESCC3.76e-084.52e-010.068
84164ASCC2LZE24THumanEsophagusESCC2.52e-246.31e-010.0596
84164ASCC2LZE21THumanEsophagusESCC5.18e-106.12e-010.0655
84164ASCC2P1T-EHumanEsophagusESCC2.93e-176.61e-010.0875
84164ASCC2P2T-EHumanEsophagusESCC9.65e-323.95e-010.1177
84164ASCC2P4T-EHumanEsophagusESCC3.10e-266.29e-010.1323
84164ASCC2P5T-EHumanEsophagusESCC3.64e-171.63e-010.1327
84164ASCC2P8T-EHumanEsophagusESCC1.15e-376.61e-010.0889
84164ASCC2P9T-EHumanEsophagusESCC1.31e-133.11e-010.1131
84164ASCC2P10T-EHumanEsophagusESCC2.51e-436.96e-010.116
84164ASCC2P11T-EHumanEsophagusESCC1.96e-156.95e-010.1426
84164ASCC2P12T-EHumanEsophagusESCC2.79e-224.34e-010.1122
84164ASCC2P15T-EHumanEsophagusESCC8.44e-336.75e-010.1149
84164ASCC2P16T-EHumanEsophagusESCC8.08e-265.05e-010.1153
Page: 1 2 3 4 5 6 7 

check button Transcriptomic changes along malignancy continuum.
TissueExpression DynamicsAbbreviation
EsophagusThe image shows the transcriptomic changes along malignancy continuum.log2FC in expression of this searched gene in stem-like cells from each diseased tissue sample relative to stem-like cells in normal samples in each tissue plotted against the malignancy continuum. Samples are colored based on if they are from different disease stage.ESCC: Esophageal squamous cell carcinoma
HGIN: High-grade intraepithelial neoplasias
LGIN: Low-grade intraepithelial neoplasias
LiverThe image shows the transcriptomic changes along malignancy continuum.log2FC in expression of this searched gene in stem-like cells from each diseased tissue sample relative to stem-like cells in normal samples in each tissue plotted against the malignancy continuum. Samples are colored based on if they are from different disease stage.
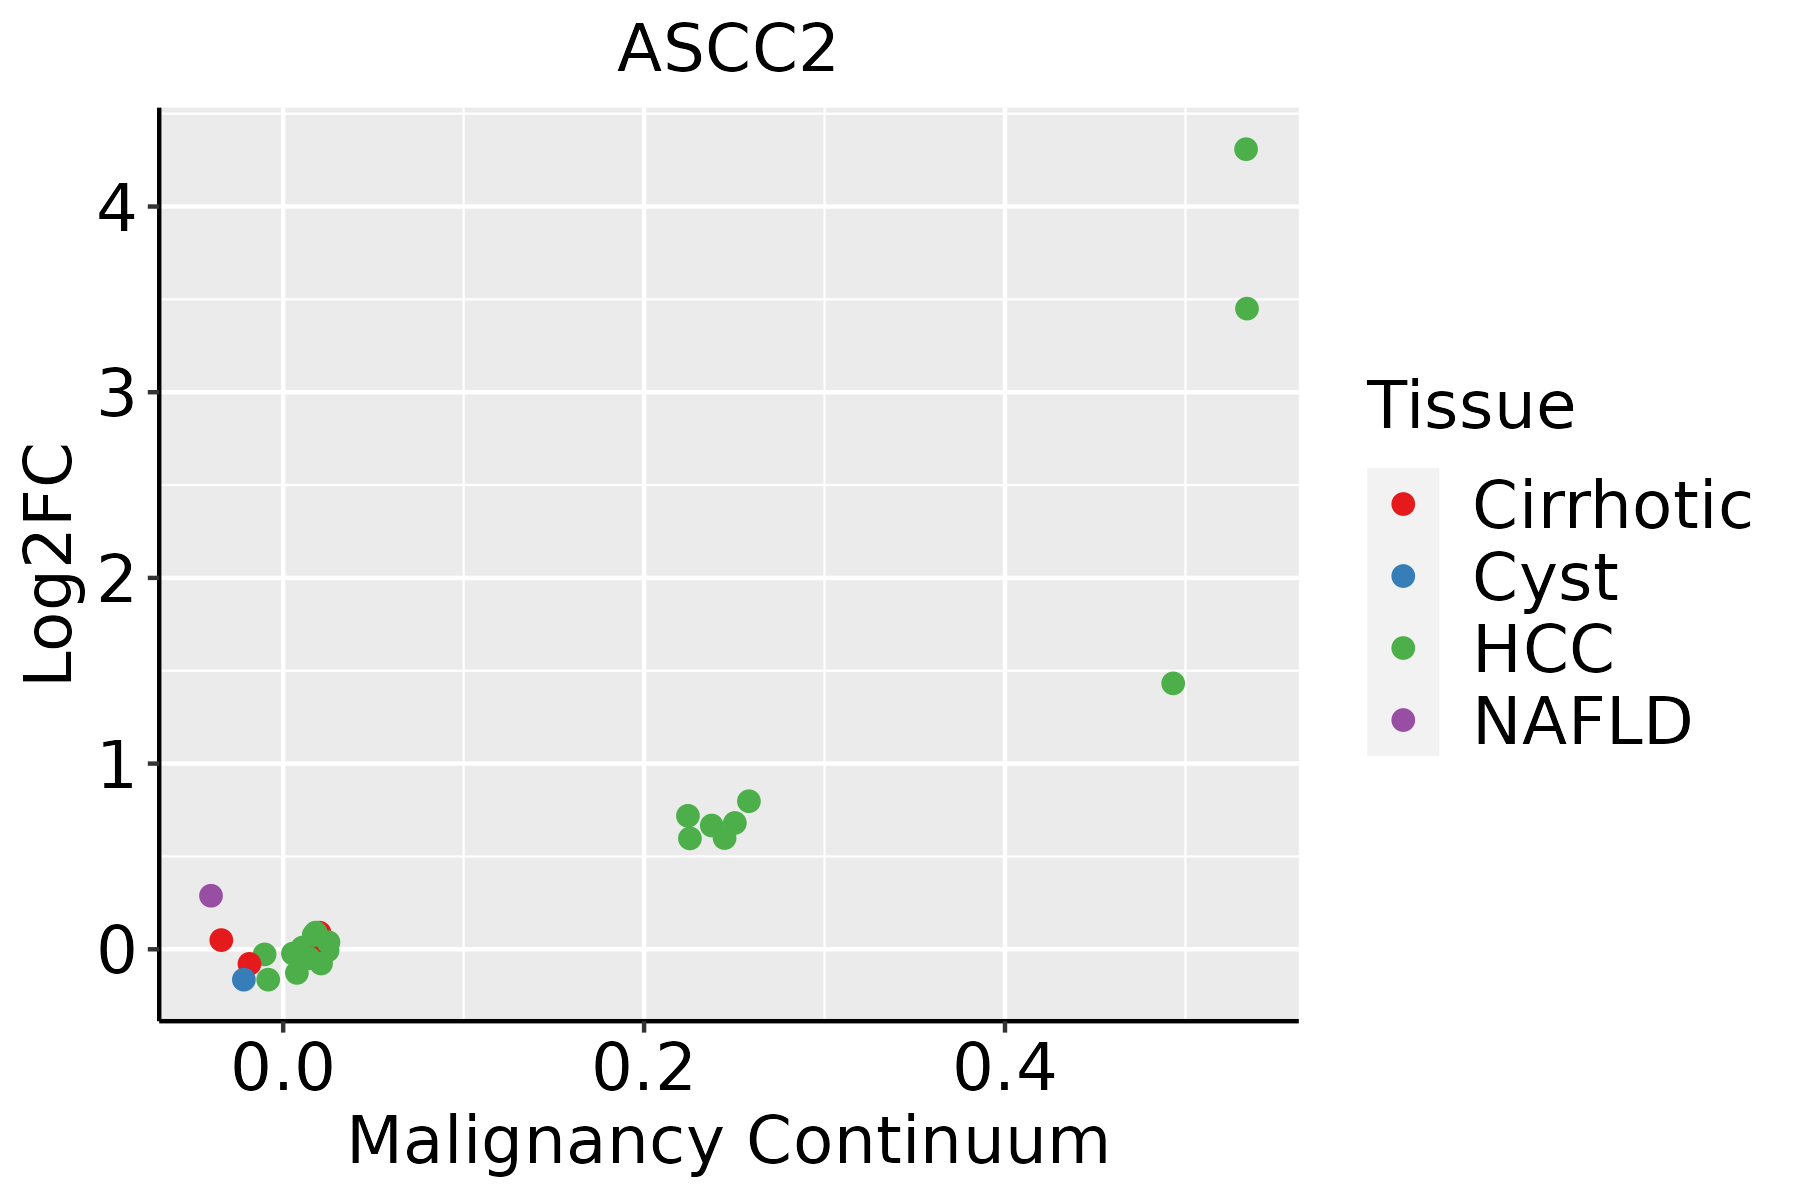
HCC: Hepatocellular carcinoma
NAFLD: Non-alcoholic fatty liver disease
Oral CavityThe image shows the transcriptomic changes along malignancy continuum.log2FC in expression of this searched gene in stem-like cells from each diseased tissue sample relative to stem-like cells in normal samples in each tissue plotted against the malignancy continuum. Samples are colored based on if they are from different disease stage.
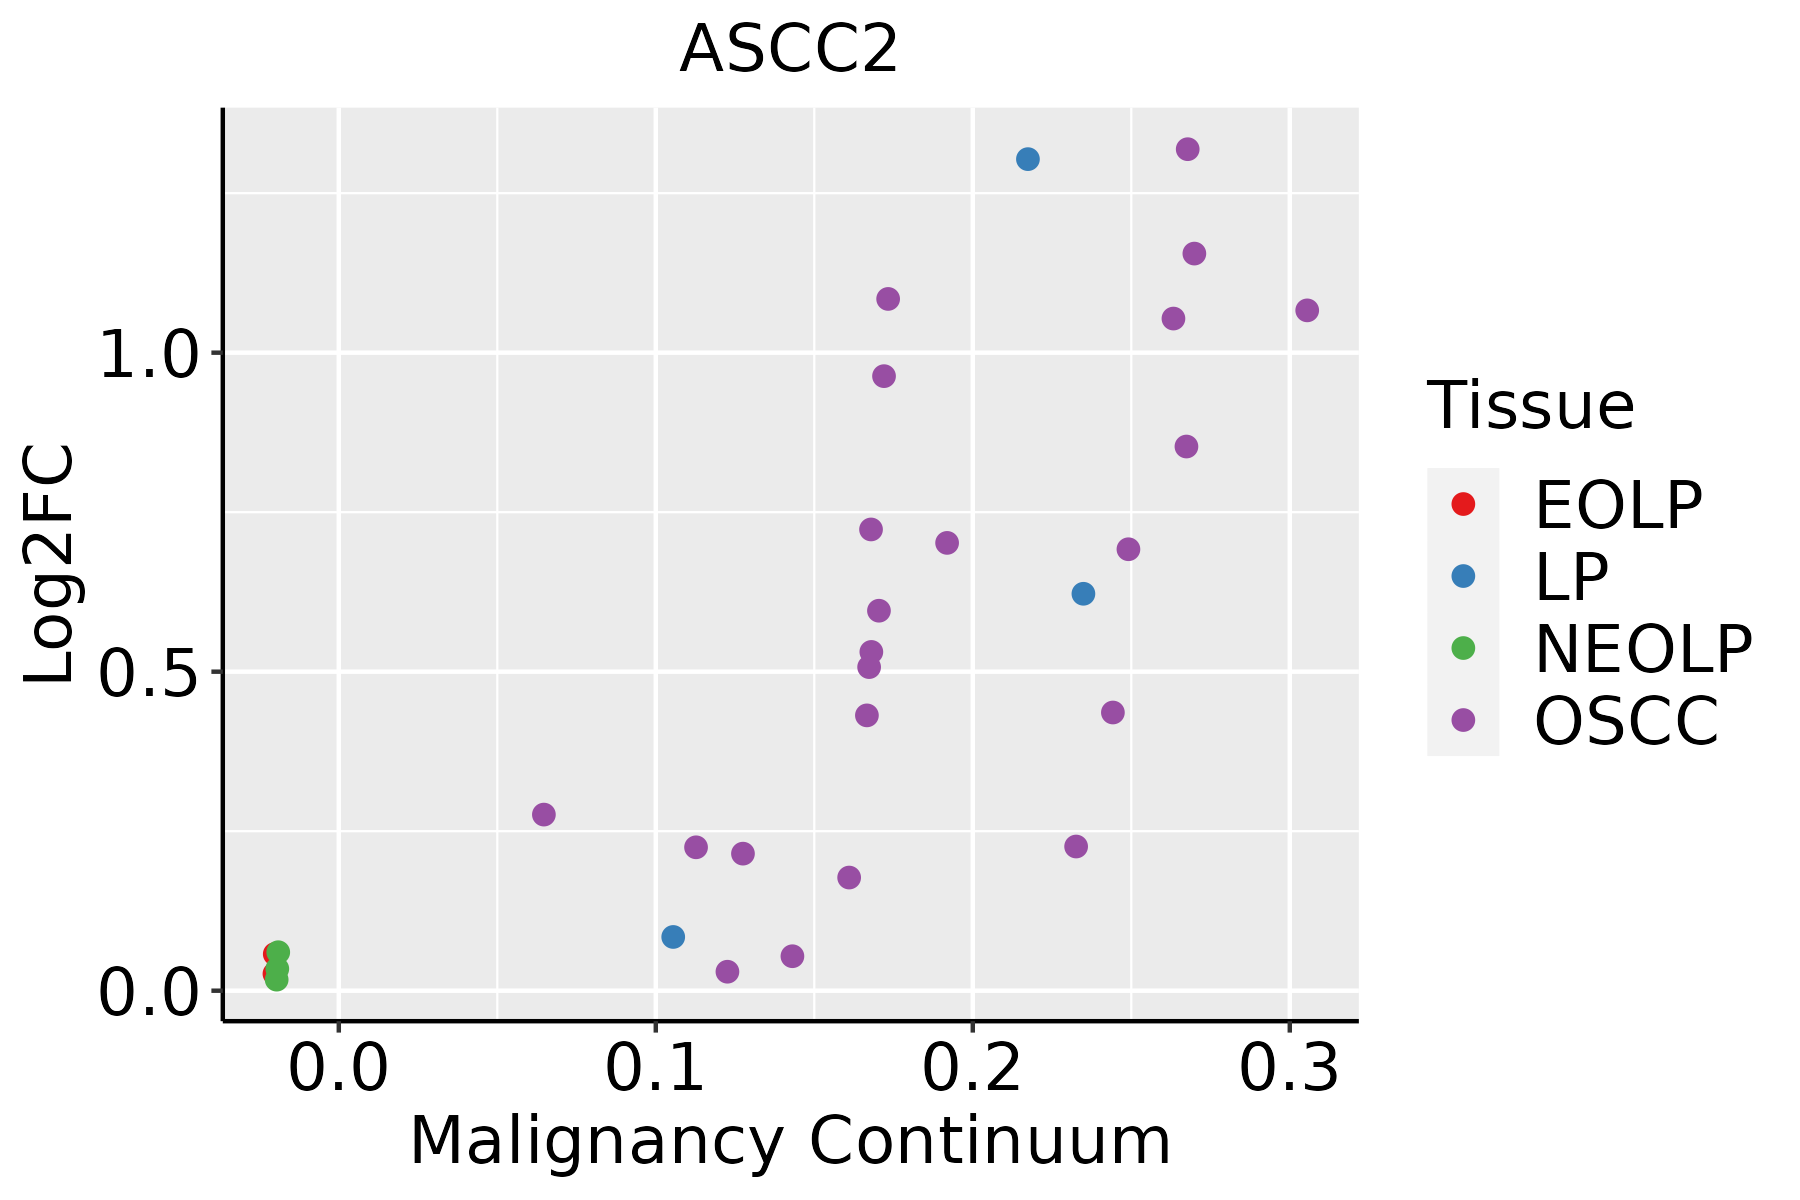
EOLP: Erosive Oral lichen planus
LP: leukoplakia
NEOLP: Non-erosive oral lichen planus
OSCC: Oral squamous cell carcinoma
SkinThe image shows the transcriptomic changes along malignancy continuum.log2FC in expression of this searched gene in stem-like cells from each diseased tissue sample relative to stem-like cells in normal samples in each tissue plotted against the malignancy continuum. Samples are colored based on if they are from different disease stage.AK: Actinic keratosis
cSCC: Cutaneous squamous cell carcinoma
SCCIS:squamous cell carcinoma in situ
ThyroidThe image shows the transcriptomic changes along malignancy continuum.log2FC in expression of this searched gene in stem-like cells from each diseased tissue sample relative to stem-like cells in normal samples in each tissue plotted against the malignancy continuum. Samples are colored based on if they are from different disease stage.ATC: Anaplastic thyroid cancer
HT: Hashimoto's thyroiditis
PTC: Papillary thyroid cancer
∗log2FC in expression of this searched gene in stem-like cells from each diseased tissue sample relative to stem-like cells in normal samples in each tissue plotted against the malignancy continuum. Samples are colored based on if they are from different disease stage.

Top

Malignant transformation related pathway analysis

check buttonFind out the enriched GO biological processes and KEGG pathways involved in transition from healthy to precancer to cancer
check button Figure of enriched GO biological processes.
TissueDisease StageEnriched GO biological Processes
ColorectumADGO analysis - Figure of enriched GO biological processes: Top 15 enriched GO BP terms are showed in the bar plot of each disease state in each tissue. Each row represents a significant GO biological process which is colored according to the -log10(p.adjust).
ColorectumSERGO analysis - Figure of enriched GO biological processes: Top 15 enriched GO BP terms are showed in the bar plot of each disease state in each tissue. Each row represents a significant GO biological process which is colored according to the -log10(p.adjust).
ColorectumMSSGO analysis - Figure of enriched GO biological processes: Top 15 enriched GO BP terms are showed in the bar plot of each disease state in each tissue. Each row represents a significant GO biological process which is colored according to the -log10(p.adjust).
ColorectumMSI-HGO analysis - Figure of enriched GO biological processes: Top 15 enriched GO BP terms are showed in the bar plot of each disease state in each tissue. Each row represents a significant GO biological process which is colored according to the -log10(p.adjust).
ColorectumFAPGO analysis - Figure of enriched GO biological processes: Top 15 enriched GO BP terms are showed in the bar plot of each disease state in each tissue. Each row represents a significant GO biological process which is colored according to the -log10(p.adjust).
∗Top 15 enriched GO BP terms are showed in the bar plot of each disease state in each tissue. Each row represents a significant GO biological process which is colored according to the -log10(p.adjust).
Page: 1 2 3 4 5 6 7 8 9 

check button Enriched GO biological processes.
GO IDTissueDisease StageDescriptionGene RatioBg Ratiopvaluep.adjustCount
GO:000641727EsophagusHGINregulation of translation139/2587468/187231.46e-197.98e-17139
GO:001049826EsophagusHGINproteasomal protein catabolic process139/2587490/187231.20e-173.41e-15139
GO:004316126EsophagusHGINproteasome-mediated ubiquitin-dependent protein catabolic process114/2587412/187237.00e-141.20e-11114
GO:000641418EsophagusHGINtranslational elongation22/258755/187231.46e-065.56e-0522
GO:0010498111EsophagusESCCproteasomal protein catabolic process369/8552490/187231.13e-411.80e-38369
GO:0043161111EsophagusESCCproteasome-mediated ubiquitin-dependent protein catabolic process312/8552412/187233.53e-364.48e-33312
GO:0006417111EsophagusESCCregulation of translation304/8552468/187231.53e-171.33e-15304
GO:000641419EsophagusESCCtranslational elongation41/855255/187231.26e-051.16e-0441
GO:00431617LiverNAFLDproteasome-mediated ubiquitin-dependent protein catabolic process91/1882412/187233.00e-131.75e-1091
GO:00104987LiverNAFLDproteasomal protein catabolic process101/1882490/187231.35e-126.09e-10101
GO:00064177LiverNAFLDregulation of translation85/1882468/187234.58e-084.54e-0685
GO:00064145LiverNAFLDtranslational elongation16/188255/187236.71e-051.44e-0316
GO:001049812LiverCirrhoticproteasomal protein catabolic process216/4634490/187232.52e-219.29e-19216
GO:004316112LiverCirrhoticproteasome-mediated ubiquitin-dependent protein catabolic process184/4634412/187234.52e-198.85e-17184
GO:000641712LiverCirrhoticregulation of translation194/4634468/187237.28e-168.79e-14194
GO:001049822LiverHCCproteasomal protein catabolic process351/7958490/187236.92e-401.46e-36351
GO:004316122LiverHCCproteasome-mediated ubiquitin-dependent protein catabolic process299/7958412/187237.82e-368.27e-33299
GO:000641722LiverHCCregulation of translation287/7958468/187238.79e-178.08e-15287
GO:000641412LiverHCCtranslational elongation36/795855/187234.94e-043.23e-0336
GO:001049820Oral cavityOSCCproteasomal protein catabolic process336/7305490/187235.45e-418.63e-38336
Page: 1 2 

check button Enriched KEGG pathways.
Pathway IDTissueDisease StageDescriptionGene RatioBg Ratiopvaluep.adjustqvalueCount
Page: 1 

Top

Cell-cell communication analysis

check buttonIdentification of potential cell-cell interactions between two cell types and their ligand-receptor pairs for different disease states
LigandReceptorLRpairPathwayTissueDisease Stage
Page: 1 

Top

Single-cell gene regulatory network inference analysis

check buttonFind out the significant the regulons (TFs) and the target genes of each regulon across cell types for different disease states
TFCell TypeTissueDisease StageTarget GeneRSSRegulon Activity
∗The dot plots of a searched regulon are shown for all cell subpopulations in each disease state of each tissue based on the regulon specific score inferred using pySCENIC and by calculating the average expression.
Page: 1 

Top

Somatic mutation of malignant transformation related genes

check buttonAnnotation of somatic variants for genes involved in malignant transformation
Hugo SymbolVariant ClassVariant ClassificationdbSNP RSHGVScHGVSpHGVSp ShortSWISSPROTBIOTYPESIFTPolyPhenTumor Sample BarcodeTissueHistologySexAgeStageTherapy TypesDrugsOutcome
ASCC2SNVMissense_Mutationc.1859N>Gp.Tyr620Cysp.Y620CQ9H1I8protein_codingdeleterious(0)possibly_damaging(0.85)TCGA-A8-A06Y-01Breastbreast invasive carcinomaFemale>=65I/IIHormone TherapyanastrozolePD
ASCC2SNVMissense_Mutationnovelc.919G>Tp.Asp307Tyrp.D307YQ9H1I8protein_codingtolerated(0.06)probably_damaging(0.979)TCGA-A8-A08F-01Breastbreast invasive carcinomaFemale<65III/IVChemotherapy5-fluorouracilCR
ASCC2SNVMissense_Mutationrs770062271c.209N>Cp.Leu70Prop.L70PQ9H1I8protein_codingdeleterious(0)probably_damaging(0.999)TCGA-D8-A1JK-01Breastbreast invasive carcinomaFemale>=65I/IIUnknownUnknownSD
ASCC2SNVMissense_Mutationrs770062271c.209T>Cp.Leu70Prop.L70PQ9H1I8protein_codingdeleterious(0)probably_damaging(0.999)TCGA-D8-A1XK-01Breastbreast invasive carcinomaFemale<65I/IIChemotherapydoxorubicine+cyclophosphamideSD
ASCC2SNVMissense_Mutationc.647N>Ap.Gly216Glup.G216EQ9H1I8protein_codingtolerated(1)benign(0.018)TCGA-D8-A1XQ-01Breastbreast invasive carcinomaFemale>=65I/IIUnknownUnknownSD
ASCC2SNVMissense_Mutationc.658N>Cp.Asn220Hisp.N220HQ9H1I8protein_codingdeleterious(0.02)benign(0.155)TCGA-D8-A1XS-01Breastbreast invasive carcinomaMale<65III/IVChemotherapyadriamycin+cyclophosphamideSD
ASCC2SNVMissense_Mutationnovelc.1405N>Tp.Asp469Tyrp.D469YQ9H1I8protein_codingdeleterious(0)probably_damaging(0.99)TCGA-E2-A2P6-01Breastbreast invasive carcinomaFemale>=65I/IIHormone TherapyanastrozoleSD
ASCC2insertionNonsense_Mutationnovelc.1221_1222insCGTCAGTAAACTTGTTGGAAAAGGACCTTGGATTAGTAGGAAGp.Arg409GlnfsTer2p.R409Qfs*2Q9H1I8protein_codingTCGA-A2-A0CQ-01Breastbreast invasive carcinomaFemale<65I/IIChemotherapyadriamycinSD
ASCC2insertionIn_Frame_Insnovelc.920_921insTTTTCCp.Asp307_Leu308insPheProp.D307_L308insFPQ9H1I8protein_codingTCGA-A8-A08F-01Breastbreast invasive carcinomaFemale<65III/IVChemotherapy5-fluorouracilCR
ASCC2insertionNonsense_Mutationnovelc.1562_1563insGAGCCGGGTGCACAAGGGCAAGAGGTGAGTGp.Asp522SerfsTer9p.D522Sfs*9Q9H1I8protein_codingTCGA-AO-A0J5-01Breastbreast invasive carcinomaFemale<65III/IVOther, specify in notesBisphosphonatezoledronicPD
Page: 1 2 3 4 5 6 7 8 

Top

Related drugs of malignant transformation related genes

check buttonIdentification of chemicals and drugs interact with genes involved in malignant transfromation
(DGIdb 4.0)
Entrez IDSymbolCategoryInteraction TypesDrug Claim NameDrug NamePMIDs
Page: 1