
|
|||||
|
 | |
| |
| |
| |
| |
| |
|
Gene: ASB13 |
Gene summary for ASB13 |
| Gene information | Species | Human | Gene symbol | ASB13 | Gene ID | 79754 |
| Gene name | ankyrin repeat and SOCS box containing 13 | |
| Gene Alias | ASB13 | |
| Cytomap | 10p15.1 | |
| Gene Type | protein-coding | GO ID | GO:0006464 | UniProtAcc | Q8WXK3 |
Top |
Malignant transformation analysis |
| Identification of the aberrant gene expression in precancerous and cancerous lesions by comparing the gene expression of stem-like cells in diseased tissues with normal stem cells |
| Entrez ID | Symbol | Replicates | Species | Organ | Tissue | Adj P-value | Log2FC | Malignancy |
| 79754 | ASB13 | P2T-E | Human | Esophagus | ESCC | 2.96e-07 | 1.86e-01 | 0.1177 |
| 79754 | ASB13 | P5T-E | Human | Esophagus | ESCC | 1.22e-05 | 1.10e-01 | 0.1327 |
| 79754 | ASB13 | P8T-E | Human | Esophagus | ESCC | 8.36e-12 | 8.23e-02 | 0.0889 |
| 79754 | ASB13 | P10T-E | Human | Esophagus | ESCC | 9.88e-06 | 6.33e-02 | 0.116 |
| 79754 | ASB13 | P12T-E | Human | Esophagus | ESCC | 2.23e-03 | 9.56e-02 | 0.1122 |
| 79754 | ASB13 | P15T-E | Human | Esophagus | ESCC | 9.68e-06 | 1.23e-01 | 0.1149 |
| 79754 | ASB13 | P16T-E | Human | Esophagus | ESCC | 6.18e-15 | 2.52e-01 | 0.1153 |
| 79754 | ASB13 | P17T-E | Human | Esophagus | ESCC | 8.40e-07 | 2.83e-01 | 0.1278 |
| 79754 | ASB13 | P19T-E | Human | Esophagus | ESCC | 1.04e-02 | 3.59e-01 | 0.1662 |
| 79754 | ASB13 | P20T-E | Human | Esophagus | ESCC | 1.30e-05 | 1.48e-01 | 0.1124 |
| 79754 | ASB13 | P21T-E | Human | Esophagus | ESCC | 1.57e-07 | 2.04e-01 | 0.1617 |
| 79754 | ASB13 | P22T-E | Human | Esophagus | ESCC | 1.50e-04 | 6.81e-02 | 0.1236 |
| 79754 | ASB13 | P23T-E | Human | Esophagus | ESCC | 3.96e-06 | 1.68e-01 | 0.108 |
| 79754 | ASB13 | P24T-E | Human | Esophagus | ESCC | 7.00e-14 | 1.59e-01 | 0.1287 |
| 79754 | ASB13 | P26T-E | Human | Esophagus | ESCC | 1.04e-08 | 1.37e-01 | 0.1276 |
| 79754 | ASB13 | P27T-E | Human | Esophagus | ESCC | 2.58e-13 | 2.12e-01 | 0.1055 |
| 79754 | ASB13 | P28T-E | Human | Esophagus | ESCC | 6.95e-06 | 8.32e-02 | 0.1149 |
| 79754 | ASB13 | P30T-E | Human | Esophagus | ESCC | 5.42e-05 | 2.64e-01 | 0.137 |
| 79754 | ASB13 | P31T-E | Human | Esophagus | ESCC | 9.33e-12 | 1.60e-01 | 0.1251 |
| 79754 | ASB13 | P32T-E | Human | Esophagus | ESCC | 8.74e-08 | 2.37e-01 | 0.1666 |
| Page: 1 2 3 |
| Tissue | Expression Dynamics | Abbreviation |
| Esophagus | 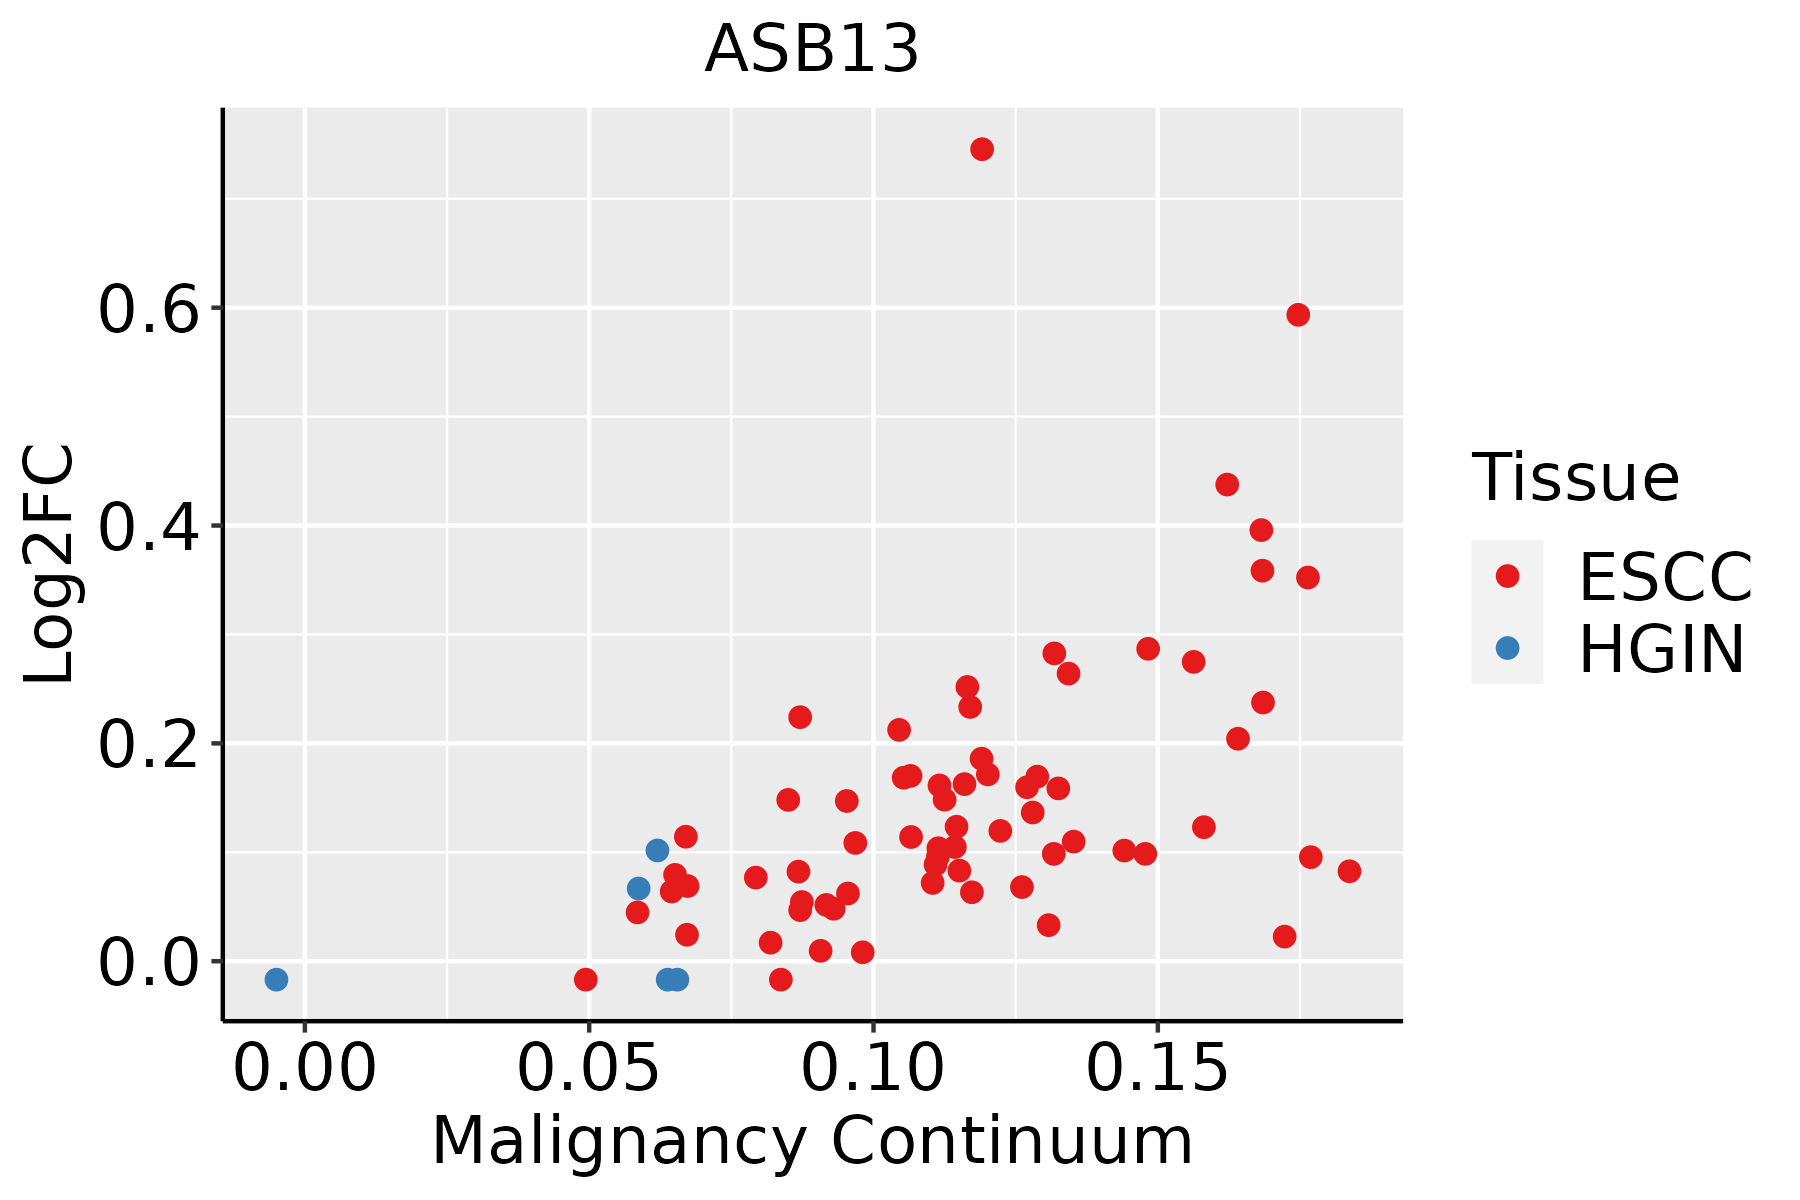 | ESCC: Esophageal squamous cell carcinoma |
| HGIN: High-grade intraepithelial neoplasias | ||
| LGIN: Low-grade intraepithelial neoplasias | ||
| Liver | 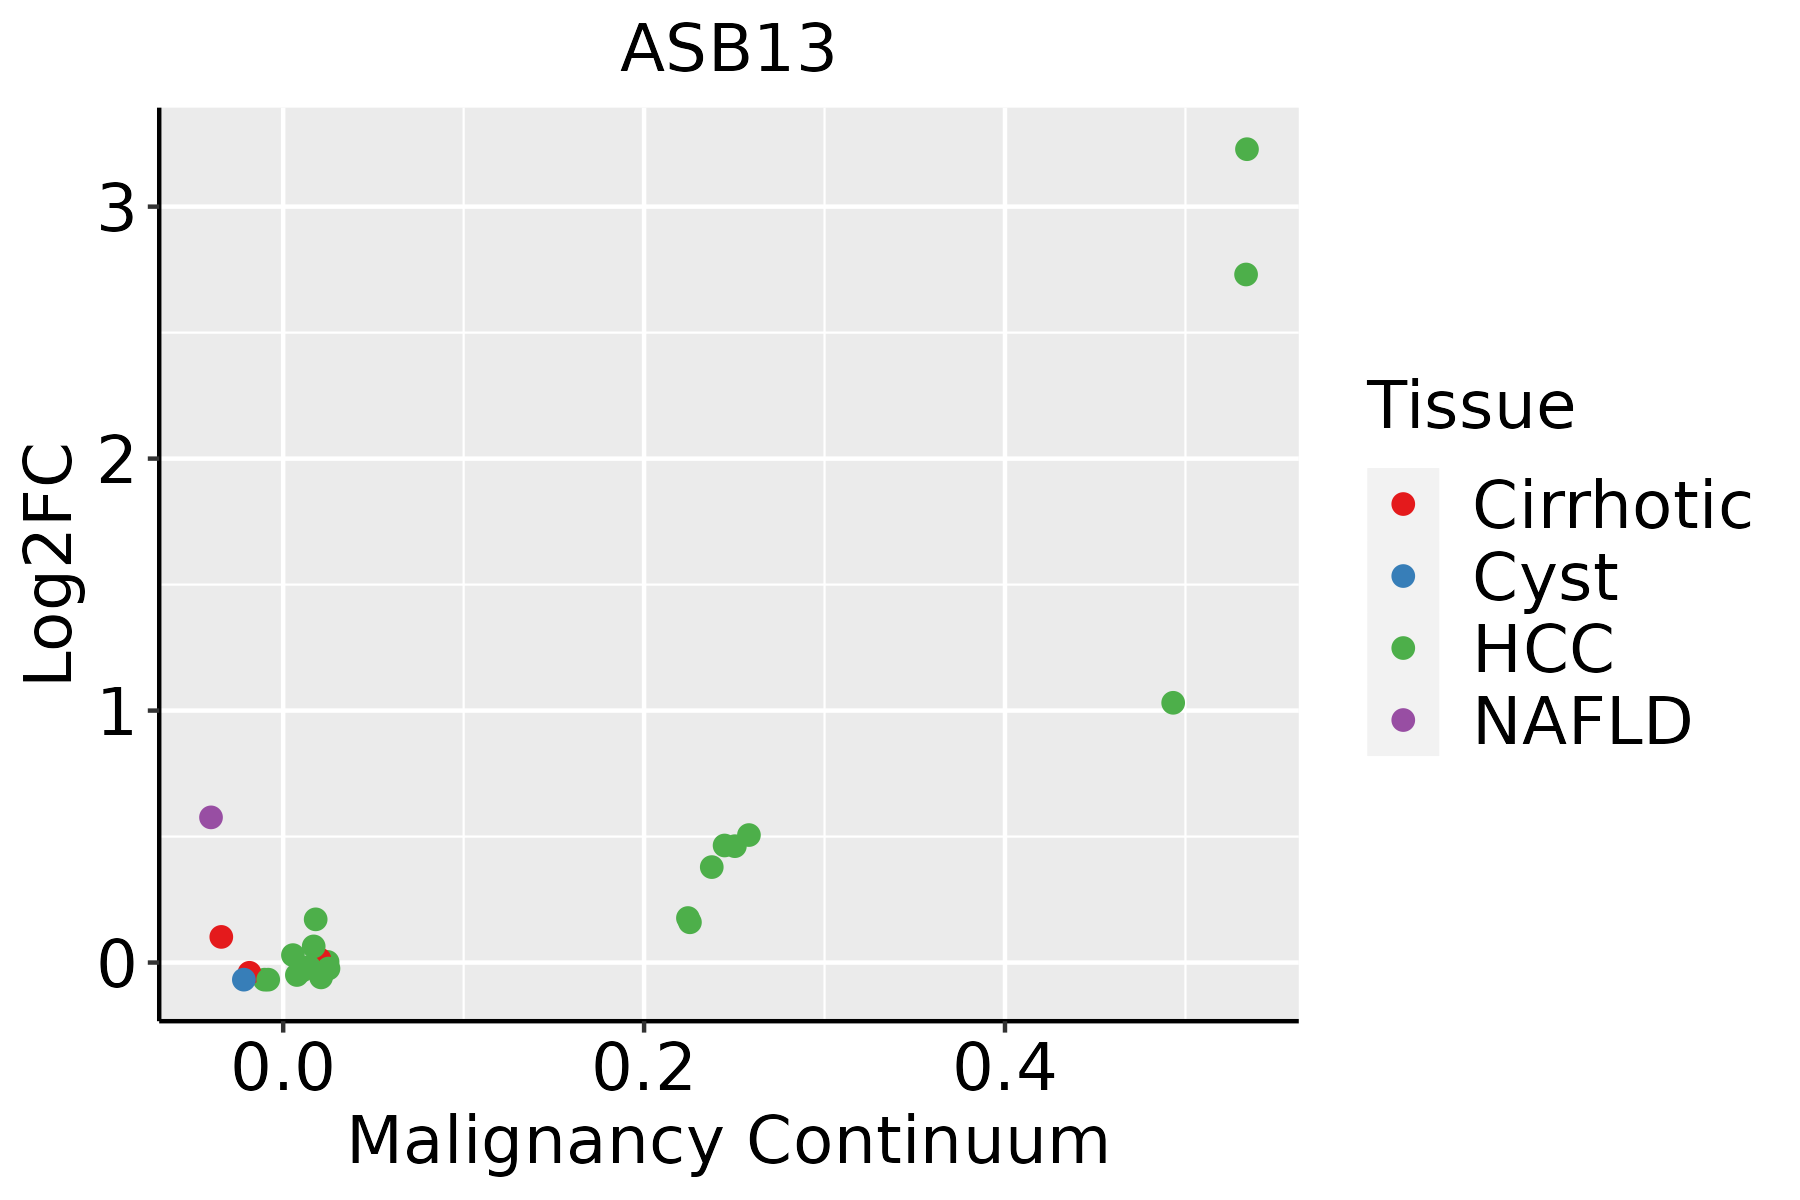 | HCC: Hepatocellular carcinoma |
| NAFLD: Non-alcoholic fatty liver disease |
| ∗log2FC in expression of this searched gene in stem-like cells from each diseased tissue sample relative to stem-like cells in normal samples in each tissue plotted against the malignancy continuum. Samples are colored based on if they are from different disease stage. |
Top |
Malignant transformation related pathway analysis |
| Find out the enriched GO biological processes and KEGG pathways involved in transition from healthy to precancer to cancer |
| Tissue | Disease Stage | Enriched GO biological Processes |
| Colorectum | AD |  |
| Colorectum | SER |  |
| Colorectum | MSS |  |
| Colorectum | MSI-H |  |
| Colorectum | FAP |  |
| ∗Top 15 enriched GO BP terms are showed in the bar plot of each disease state in each tissue. Each row represents a significant GO biological process which is colored according to the -log10(p.adjust). |
| Page: 1 2 3 4 5 6 7 8 9 |
| GO ID | Tissue | Disease Stage | Description | Gene Ratio | Bg Ratio | pvalue | p.adjust | Count |
| Page: 1 |
| Pathway ID | Tissue | Disease Stage | Description | Gene Ratio | Bg Ratio | pvalue | p.adjust | qvalue | Count |
| Page: 1 |
Top |
Cell-cell communication analysis |
| Identification of potential cell-cell interactions between two cell types and their ligand-receptor pairs for different disease states |
| Ligand | Receptor | LRpair | Pathway | Tissue | Disease Stage |
| Page: 1 |
Top |
Single-cell gene regulatory network inference analysis |
| Find out the significant the regulons (TFs) and the target genes of each regulon across cell types for different disease states |
| TF | Cell Type | Tissue | Disease Stage | Target Gene | RSS | Regulon Activity |
| ∗The dot plots of a searched regulon are shown for all cell subpopulations in each disease state of each tissue based on the regulon specific score inferred using pySCENIC and by calculating the average expression. |
| Page: 1 |
Top |
Somatic mutation of malignant transformation related genes |
| Annotation of somatic variants for genes involved in malignant transformation |
| Hugo Symbol | Variant Class | Variant Classification | dbSNP RS | HGVSc | HGVSp | HGVSp Short | SWISSPROT | BIOTYPE | SIFT | PolyPhen | Tumor Sample Barcode | Tissue | Histology | Sex | Age | Stage | Therapy Types | Drugs | Outcome |
| ASB13 | SNV | Missense_Mutation | c.791N>C | p.Lys264Thr | p.K264T | Q8WXK3 | protein_coding | deleterious(0.01) | benign(0.024) | TCGA-A8-A09K-01 | Breast | breast invasive carcinoma | Female | >=65 | I/II | Unknown | Unknown | SD | |
| ASB13 | SNV | Missense_Mutation | novel | c.653N>A | p.Pro218Gln | p.P218Q | Q8WXK3 | protein_coding | deleterious(0) | probably_damaging(0.999) | TCGA-C8-A3M7-01 | Breast | breast invasive carcinoma | Female | <65 | III/IV | Unknown | Unknown | PD |
| ASB13 | SNV | Missense_Mutation | novel | c.677N>A | p.Ser226Asn | p.S226N | Q8WXK3 | protein_coding | deleterious(0.03) | probably_damaging(0.975) | TCGA-LL-A5YL-01 | Breast | breast invasive carcinoma | Female | <65 | I/II | Chemotherapy | adriamycin | SD |
| ASB13 | deletion | Frame_Shift_Del | c.361delC | p.Leu121CysfsTer6 | p.L121Cfs*6 | Q8WXK3 | protein_coding | TCGA-BH-A18G-01 | Breast | breast invasive carcinoma | Female | >=65 | I/II | Unknown | Unknown | SD | |||
| ASB13 | deletion | Frame_Shift_Del | novel | c.501delA | p.Val168CysfsTer9 | p.V168Cfs*9 | Q8WXK3 | protein_coding | TCGA-D8-A27V-01 | Breast | breast invasive carcinoma | Female | <65 | I/II | Hormone Therapy | tamoxiphen | SD | ||
| ASB13 | SNV | Missense_Mutation | novel | c.151N>C | p.Asp51His | p.D51H | Q8WXK3 | protein_coding | deleterious(0) | probably_damaging(0.992) | TCGA-HM-A4S6-01 | Cervix | cervical & endocervical cancer | Female | <65 | III/IV | Chemotherapy | cisplatin | CR |
| ASB13 | SNV | Missense_Mutation | rs202154158 | c.526G>A | p.Val176Met | p.V176M | Q8WXK3 | protein_coding | deleterious(0) | probably_damaging(0.998) | TCGA-CA-5255-01 | Colorectum | colon adenocarcinoma | Male | <65 | I/II | Chemotherapy | oxaliplatin | CR |
| ASB13 | SNV | Missense_Mutation | c.481N>A | p.Glu161Lys | p.E161K | Q8WXK3 | protein_coding | tolerated(0.14) | benign(0.015) | TCGA-QG-A5YV-01 | Colorectum | colon adenocarcinoma | Female | <65 | III/IV | Chemotherapy | xeloda | CR | |
| ASB13 | SNV | Missense_Mutation | rs60413325 | c.133G>A | p.Val45Met | p.V45M | Q8WXK3 | protein_coding | deleterious(0) | probably_damaging(0.999) | TCGA-EI-6882-01 | Colorectum | rectum adenocarcinoma | Male | <65 | I/II | Unknown | Unknown | SD |
| ASB13 | deletion | Frame_Shift_Del | c.361delN | p.Leu121CysfsTer6 | p.L121Cfs*6 | Q8WXK3 | protein_coding | TCGA-A6-5665-01 | Colorectum | colon adenocarcinoma | Female | >=65 | I/II | Unknown | Unknown | PD |
| Page: 1 2 3 4 |
Top |
Related drugs of malignant transformation related genes |
| Identification of chemicals and drugs interact with genes involved in malignant transfromation |
| (DGIdb 4.0) |
| Entrez ID | Symbol | Category | Interaction Types | Drug Claim Name | Drug Name | PMIDs |
| Page: 1 |

Copyright 2023-Present -The University of Texas Health Science Center at Houston |