
|
|||||
|
 | |
| |
| |
| |
| |
| |
|
Gene: ASB1 |
Gene summary for ASB1 |
| Gene information | Species | Human | Gene symbol | ASB1 | Gene ID | 51665 |
| Gene name | ankyrin repeat and SOCS box containing 1 | |
| Gene Alias | ASB-1 | |
| Cytomap | 2q37.3 | |
| Gene Type | protein-coding | GO ID | GO:0000003 | UniProtAcc | Q9Y576 |
Top |
Malignant transformation analysis |
| Identification of the aberrant gene expression in precancerous and cancerous lesions by comparing the gene expression of stem-like cells in diseased tissues with normal stem cells |
| Entrez ID | Symbol | Replicates | Species | Organ | Tissue | Adj P-value | Log2FC | Malignancy |
| 51665 | ASB1 | LZE4T | Human | Esophagus | ESCC | 1.72e-02 | 1.30e-01 | 0.0811 |
| 51665 | ASB1 | LZE24T | Human | Esophagus | ESCC | 1.99e-18 | 4.41e-01 | 0.0596 |
| 51665 | ASB1 | P2T-E | Human | Esophagus | ESCC | 3.30e-13 | 3.07e-01 | 0.1177 |
| 51665 | ASB1 | P4T-E | Human | Esophagus | ESCC | 1.00e-13 | 3.25e-01 | 0.1323 |
| 51665 | ASB1 | P5T-E | Human | Esophagus | ESCC | 1.14e-16 | 2.99e-01 | 0.1327 |
| 51665 | ASB1 | P8T-E | Human | Esophagus | ESCC | 1.29e-12 | 2.29e-01 | 0.0889 |
| 51665 | ASB1 | P9T-E | Human | Esophagus | ESCC | 2.56e-05 | 1.57e-01 | 0.1131 |
| 51665 | ASB1 | P10T-E | Human | Esophagus | ESCC | 1.51e-10 | 2.39e-01 | 0.116 |
| 51665 | ASB1 | P11T-E | Human | Esophagus | ESCC | 2.67e-06 | 2.62e-01 | 0.1426 |
| 51665 | ASB1 | P12T-E | Human | Esophagus | ESCC | 1.05e-14 | 2.70e-01 | 0.1122 |
| 51665 | ASB1 | P15T-E | Human | Esophagus | ESCC | 1.07e-22 | 4.85e-01 | 0.1149 |
| 51665 | ASB1 | P16T-E | Human | Esophagus | ESCC | 9.75e-13 | 2.77e-01 | 0.1153 |
| 51665 | ASB1 | P17T-E | Human | Esophagus | ESCC | 2.47e-03 | 2.37e-01 | 0.1278 |
| 51665 | ASB1 | P19T-E | Human | Esophagus | ESCC | 1.30e-05 | 3.43e-01 | 0.1662 |
| 51665 | ASB1 | P20T-E | Human | Esophagus | ESCC | 2.67e-15 | 3.42e-01 | 0.1124 |
| 51665 | ASB1 | P21T-E | Human | Esophagus | ESCC | 7.50e-24 | 5.01e-01 | 0.1617 |
| 51665 | ASB1 | P22T-E | Human | Esophagus | ESCC | 1.19e-18 | 3.00e-01 | 0.1236 |
| 51665 | ASB1 | P23T-E | Human | Esophagus | ESCC | 6.34e-10 | 1.96e-01 | 0.108 |
| 51665 | ASB1 | P24T-E | Human | Esophagus | ESCC | 1.93e-11 | 2.47e-01 | 0.1287 |
| 51665 | ASB1 | P26T-E | Human | Esophagus | ESCC | 1.52e-19 | 3.66e-01 | 0.1276 |
| Page: 1 2 3 4 5 |
| Tissue | Expression Dynamics | Abbreviation |
| Esophagus |  | ESCC: Esophageal squamous cell carcinoma |
| HGIN: High-grade intraepithelial neoplasias | ||
| LGIN: Low-grade intraepithelial neoplasias | ||
| Liver | 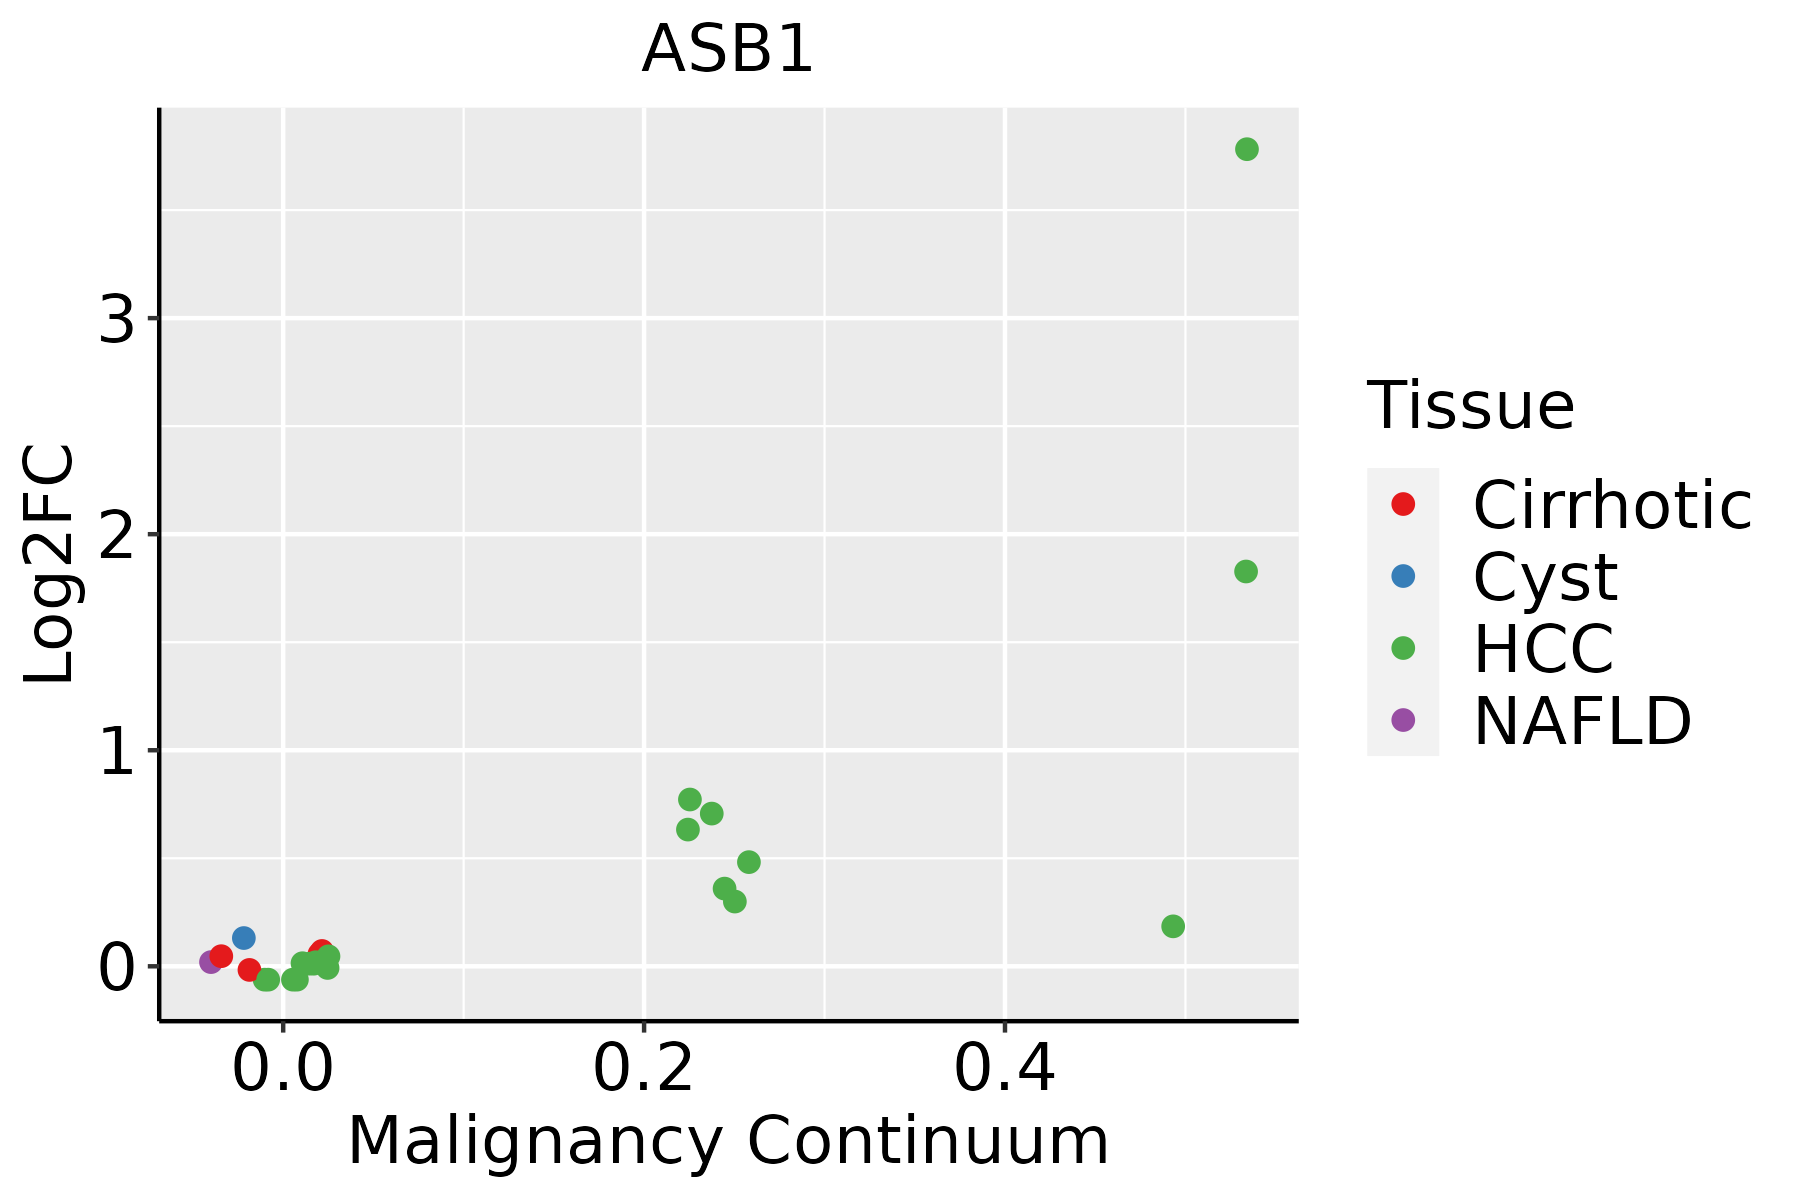 | HCC: Hepatocellular carcinoma |
| NAFLD: Non-alcoholic fatty liver disease | ||
| Oral Cavity |  | EOLP: Erosive Oral lichen planus |
| LP: leukoplakia | ||
| NEOLP: Non-erosive oral lichen planus | ||
| OSCC: Oral squamous cell carcinoma | ||
| Thyroid |  | ATC: Anaplastic thyroid cancer |
| HT: Hashimoto's thyroiditis | ||
| PTC: Papillary thyroid cancer |
| ∗log2FC in expression of this searched gene in stem-like cells from each diseased tissue sample relative to stem-like cells in normal samples in each tissue plotted against the malignancy continuum. Samples are colored based on if they are from different disease stage. |
Top |
Malignant transformation related pathway analysis |
| Find out the enriched GO biological processes and KEGG pathways involved in transition from healthy to precancer to cancer |
| Tissue | Disease Stage | Enriched GO biological Processes |
| Colorectum | AD |  |
| Colorectum | SER |  |
| Colorectum | MSS |  |
| Colorectum | MSI-H |  |
| Colorectum | FAP |  |
| ∗Top 15 enriched GO BP terms are showed in the bar plot of each disease state in each tissue. Each row represents a significant GO biological process which is colored according to the -log10(p.adjust). |
| Page: 1 2 3 4 5 6 7 8 9 |
| GO ID | Tissue | Disease Stage | Description | Gene Ratio | Bg Ratio | pvalue | p.adjust | Count |
| GO:0061458110 | Esophagus | ESCC | reproductive system development | 247/8552 | 427/18723 | 2.24e-07 | 3.42e-06 | 247 |
| GO:004860818 | Esophagus | ESCC | reproductive structure development | 245/8552 | 424/18723 | 2.82e-07 | 4.14e-06 | 245 |
| GO:000989622 | Liver | HCC | positive regulation of catabolic process | 335/7958 | 492/18723 | 3.83e-31 | 1.87e-28 | 335 |
| GO:004217622 | Liver | HCC | regulation of protein catabolic process | 267/7958 | 391/18723 | 2.45e-25 | 7.38e-23 | 267 |
| GO:004573222 | Liver | HCC | positive regulation of protein catabolic process | 163/7958 | 231/18723 | 4.00e-18 | 4.69e-16 | 163 |
| GO:006145811 | Liver | HCC | reproductive system development | 205/7958 | 427/18723 | 1.16e-02 | 4.27e-02 | 205 |
| GO:006145817 | Oral cavity | OSCC | reproductive system development | 217/7305 | 427/18723 | 3.75e-07 | 5.63e-06 | 217 |
| GO:004860816 | Oral cavity | OSCC | reproductive structure development | 214/7305 | 424/18723 | 8.58e-07 | 1.18e-05 | 214 |
| GO:0061458112 | Thyroid | PTC | reproductive system development | 173/5968 | 427/18723 | 8.70e-05 | 7.23e-04 | 173 |
| GO:0048608111 | Thyroid | PTC | reproductive structure development | 170/5968 | 424/18723 | 1.86e-04 | 1.41e-03 | 170 |
| GO:006145827 | Thyroid | ATC | reproductive system development | 193/6293 | 427/18723 | 3.32e-07 | 4.92e-06 | 193 |
| GO:004860825 | Thyroid | ATC | reproductive structure development | 190/6293 | 424/18723 | 8.40e-07 | 1.11e-05 | 190 |
| GO:004666112 | Thyroid | ATC | male sex differentiation | 77/6293 | 165/18723 | 3.27e-04 | 2.04e-03 | 77 |
| Page: 1 |
| Pathway ID | Tissue | Disease Stage | Description | Gene Ratio | Bg Ratio | pvalue | p.adjust | qvalue | Count |
| Page: 1 |
Top |
Cell-cell communication analysis |
| Identification of potential cell-cell interactions between two cell types and their ligand-receptor pairs for different disease states |
| Ligand | Receptor | LRpair | Pathway | Tissue | Disease Stage |
| Page: 1 |
Top |
Single-cell gene regulatory network inference analysis |
| Find out the significant the regulons (TFs) and the target genes of each regulon across cell types for different disease states |
| TF | Cell Type | Tissue | Disease Stage | Target Gene | RSS | Regulon Activity |
| ∗The dot plots of a searched regulon are shown for all cell subpopulations in each disease state of each tissue based on the regulon specific score inferred using pySCENIC and by calculating the average expression. |
| Page: 1 |
Top |
Somatic mutation of malignant transformation related genes |
| Annotation of somatic variants for genes involved in malignant transformation |
| Hugo Symbol | Variant Class | Variant Classification | dbSNP RS | HGVSc | HGVSp | HGVSp Short | SWISSPROT | BIOTYPE | SIFT | PolyPhen | Tumor Sample Barcode | Tissue | Histology | Sex | Age | Stage | Therapy Types | Drugs | Outcome |
| ASB1 | SNV | Missense_Mutation | novel | c.737N>C | p.His246Pro | p.H246P | Q9Y576 | protein_coding | deleterious(0) | possibly_damaging(0.852) | TCGA-D8-A147-01 | Breast | breast invasive carcinoma | Female | <65 | I/II | Chemotherapy | doxorubicine | SD |
| ASB1 | SNV | Missense_Mutation | c.788N>C | p.Leu263Pro | p.L263P | Q9Y576 | protein_coding | tolerated(0.13) | benign(0.027) | TCGA-D8-A1XK-01 | Breast | breast invasive carcinoma | Female | <65 | I/II | Chemotherapy | doxorubicine+cyclophosphamide | SD | |
| ASB1 | SNV | Missense_Mutation | rs367834361 | c.53G>A | p.Arg18His | p.R18H | Q9Y576 | protein_coding | tolerated_low_confidence(0.07) | benign(0.181) | TCGA-2W-A8YY-01 | Cervix | cervical & endocervical cancer | Female | <65 | I/II | Chemotherapy | cisplatin | CR |
| ASB1 | SNV | Missense_Mutation | rs150540319 | c.598G>A | p.Ala200Thr | p.A200T | Q9Y576 | protein_coding | deleterious(0.03) | possibly_damaging(0.762) | TCGA-AA-3864-01 | Colorectum | colon adenocarcinoma | Male | >=65 | I/II | Unknown | Unknown | SD |
| ASB1 | SNV | Missense_Mutation | c.296N>A | p.Arg99Gln | p.R99Q | Q9Y576 | protein_coding | tolerated(0.58) | benign(0.001) | TCGA-D5-6540-01 | Colorectum | colon adenocarcinoma | Male | >=65 | I/II | Unknown | Unknown | SD | |
| ASB1 | SNV | Missense_Mutation | rs376136799 | c.451N>A | p.Ala151Thr | p.A151T | Q9Y576 | protein_coding | deleterious(0.03) | benign(0.271) | TCGA-WS-AB45-01 | Colorectum | colon adenocarcinoma | Female | <65 | I/II | Unknown | Unknown | SD |
| ASB1 | SNV | Missense_Mutation | c.533C>A | p.Pro178His | p.P178H | Q9Y576 | protein_coding | deleterious(0) | possibly_damaging(0.65) | TCGA-EI-6507-01 | Colorectum | rectum adenocarcinoma | Male | <65 | I/II | Unknown | Unknown | SD | |
| ASB1 | SNV | Missense_Mutation | c.296N>A | p.Arg99Gln | p.R99Q | Q9Y576 | protein_coding | tolerated(0.58) | benign(0.001) | TCGA-EI-6882-01 | Colorectum | rectum adenocarcinoma | Male | <65 | I/II | Unknown | Unknown | SD | |
| ASB1 | SNV | Missense_Mutation | novel | c.817N>T | p.Pro273Ser | p.P273S | Q9Y576 | protein_coding | tolerated(0.6) | benign(0.01) | TCGA-A5-A0G2-01 | Endometrium | uterine corpus endometrioid carcinoma | Female | <65 | III/IV | Unknown | Unknown | SD |
| ASB1 | SNV | Missense_Mutation | rs780761258 | c.248N>A | p.Arg83Gln | p.R83Q | Q9Y576 | protein_coding | deleterious(0.01) | probably_damaging(0.961) | TCGA-AJ-A3EL-01 | Endometrium | uterine corpus endometrioid carcinoma | Female | <65 | I/II | Unknown | Unknown | SD |
| Page: 1 2 3 4 |
Top |
Related drugs of malignant transformation related genes |
| Identification of chemicals and drugs interact with genes involved in malignant transfromation |
| (DGIdb 4.0) |
| Entrez ID | Symbol | Category | Interaction Types | Drug Claim Name | Drug Name | PMIDs |
| Page: 1 |

Copyright 2023-Present -The University of Texas Health Science Center at Houston |