| Tissue | Expression Dynamics | Abbreviation |
| Cervix |  | CC: Cervix cancer |
| HSIL_HPV: HPV-infected high-grade squamous intraepithelial lesions |
| N_HPV: HPV-infected normal cervix |
| Endometrium |  | AEH: Atypical endometrial hyperplasia |
| EEC: Endometrioid Cancer |
| Esophagus |  | ESCC: Esophageal squamous cell carcinoma |
| HGIN: High-grade intraepithelial neoplasias |
| LGIN: Low-grade intraepithelial neoplasias |
| Liver |  | HCC: Hepatocellular carcinoma |
| NAFLD: Non-alcoholic fatty liver disease |
| Lung |  | AAH: Atypical adenomatous hyperplasia |
| AIS: Adenocarcinoma in situ |
| IAC: Invasive lung adenocarcinoma |
| MIA: Minimally invasive adenocarcinoma |
| Oral Cavity | 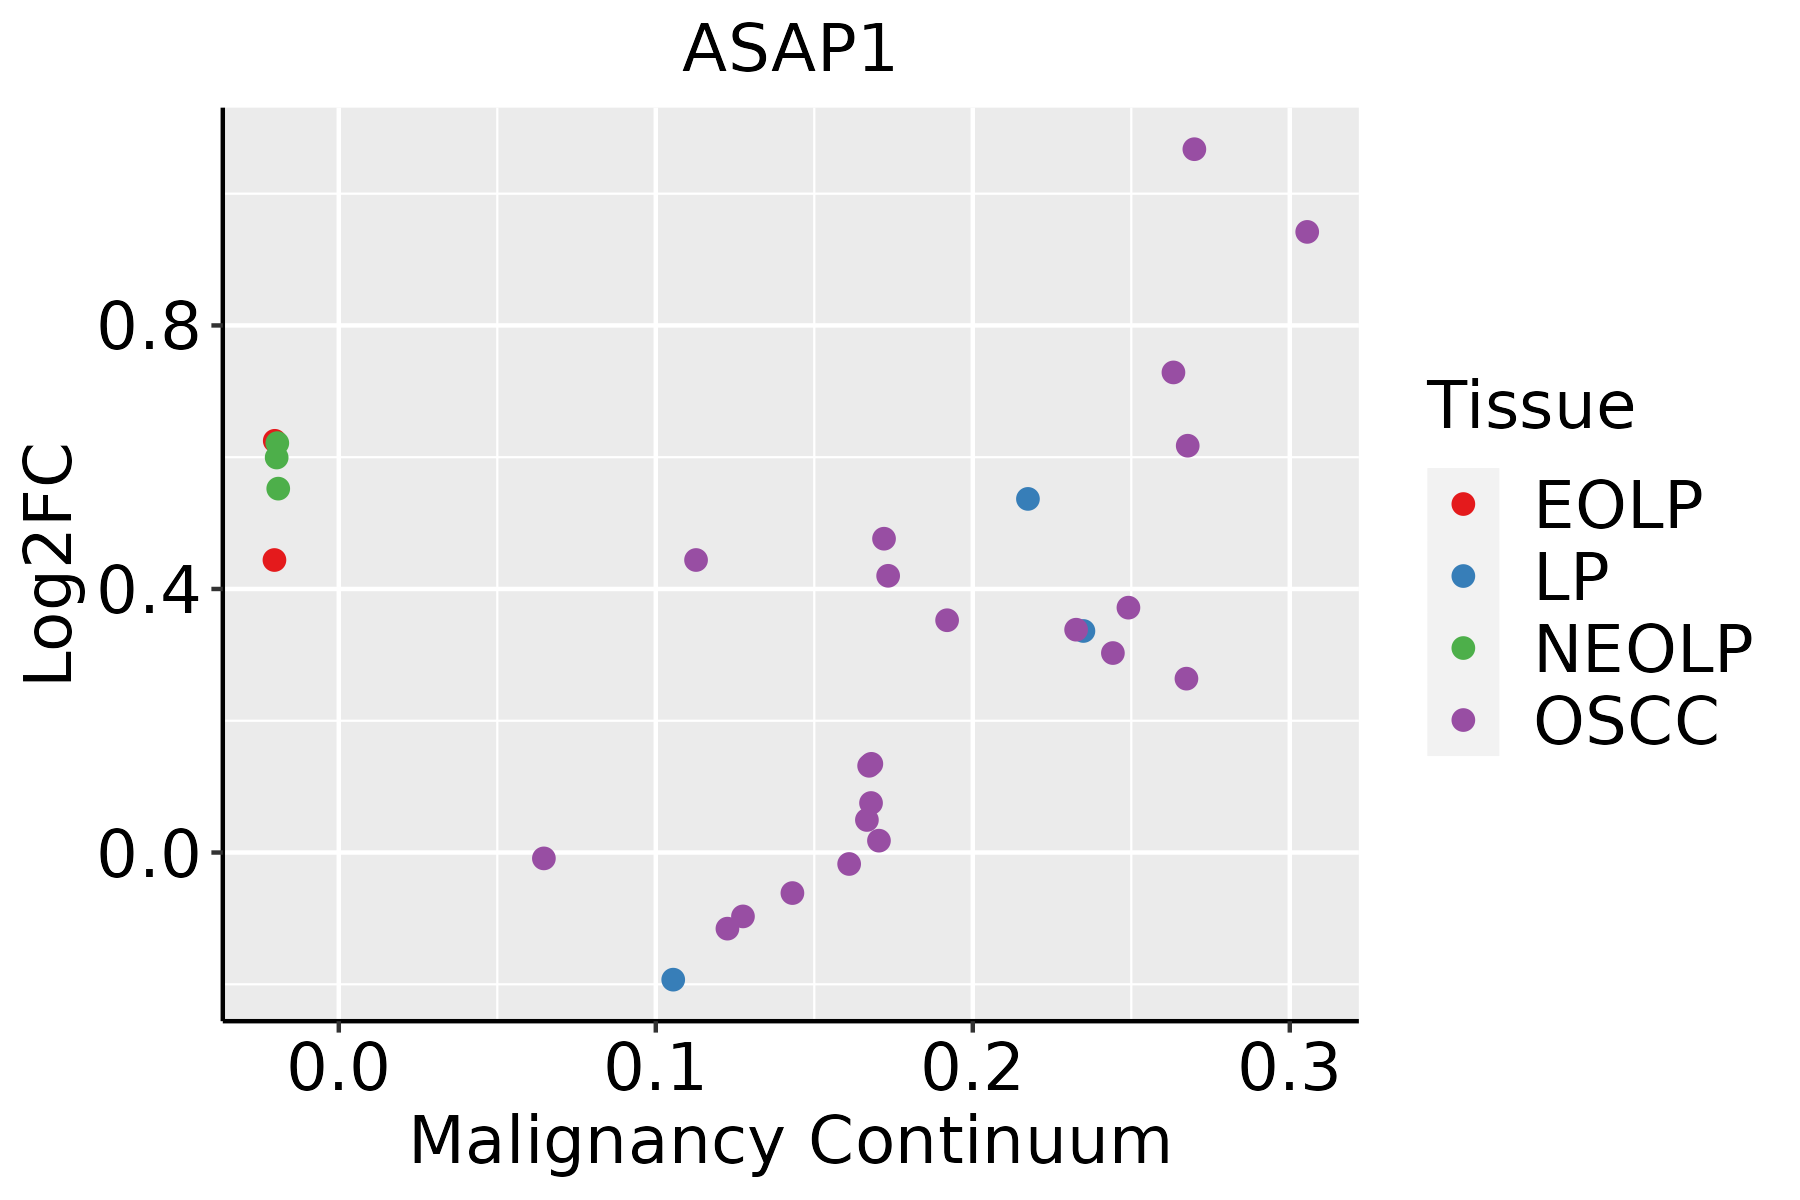 | EOLP: Erosive Oral lichen planus |
| LP: leukoplakia |
| NEOLP: Non-erosive oral lichen planus |
| OSCC: Oral squamous cell carcinoma |
| Prostate | 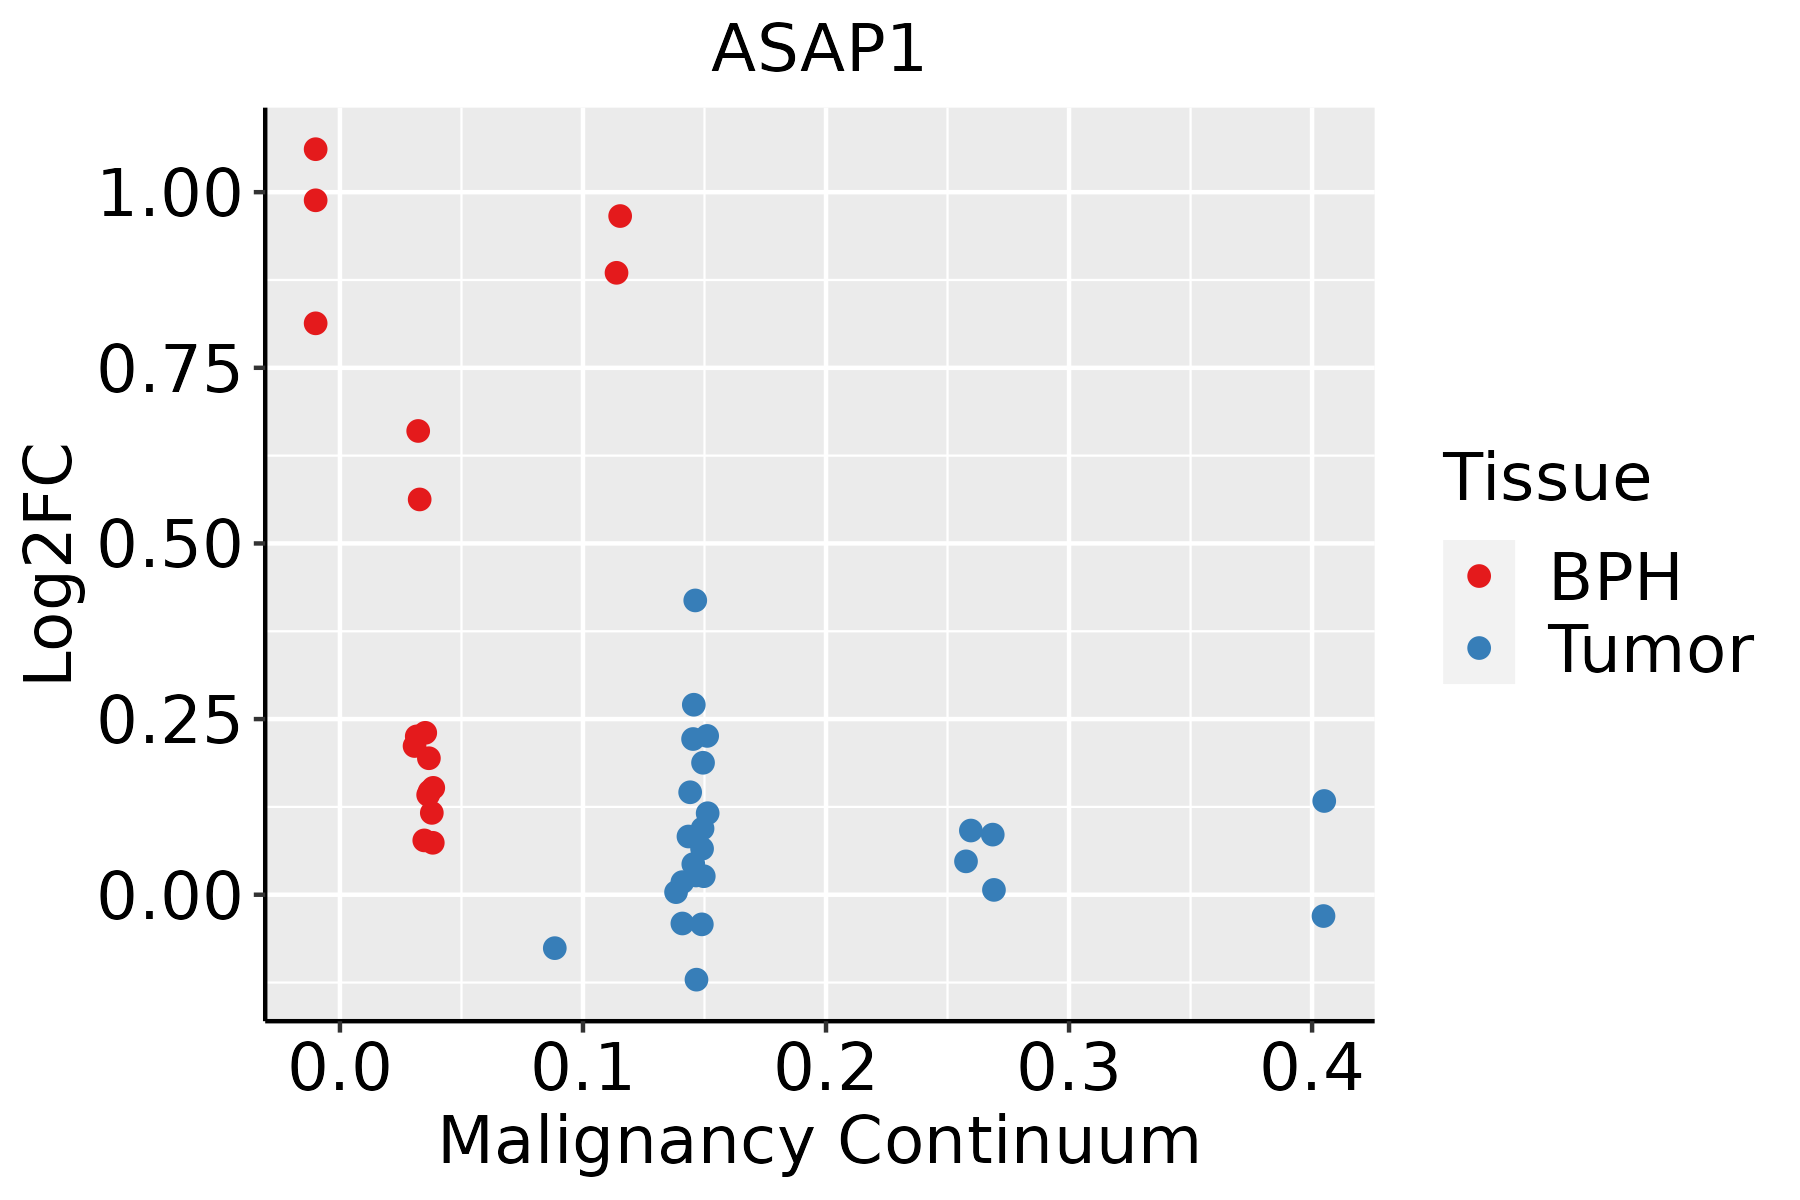 | BPH: Benign Prostatic Hyperplasia |
| Skin |  | AK: Actinic keratosis |
| cSCC: Cutaneous squamous cell carcinoma |
| SCCIS:squamous cell carcinoma in situ |
| Thyroid | 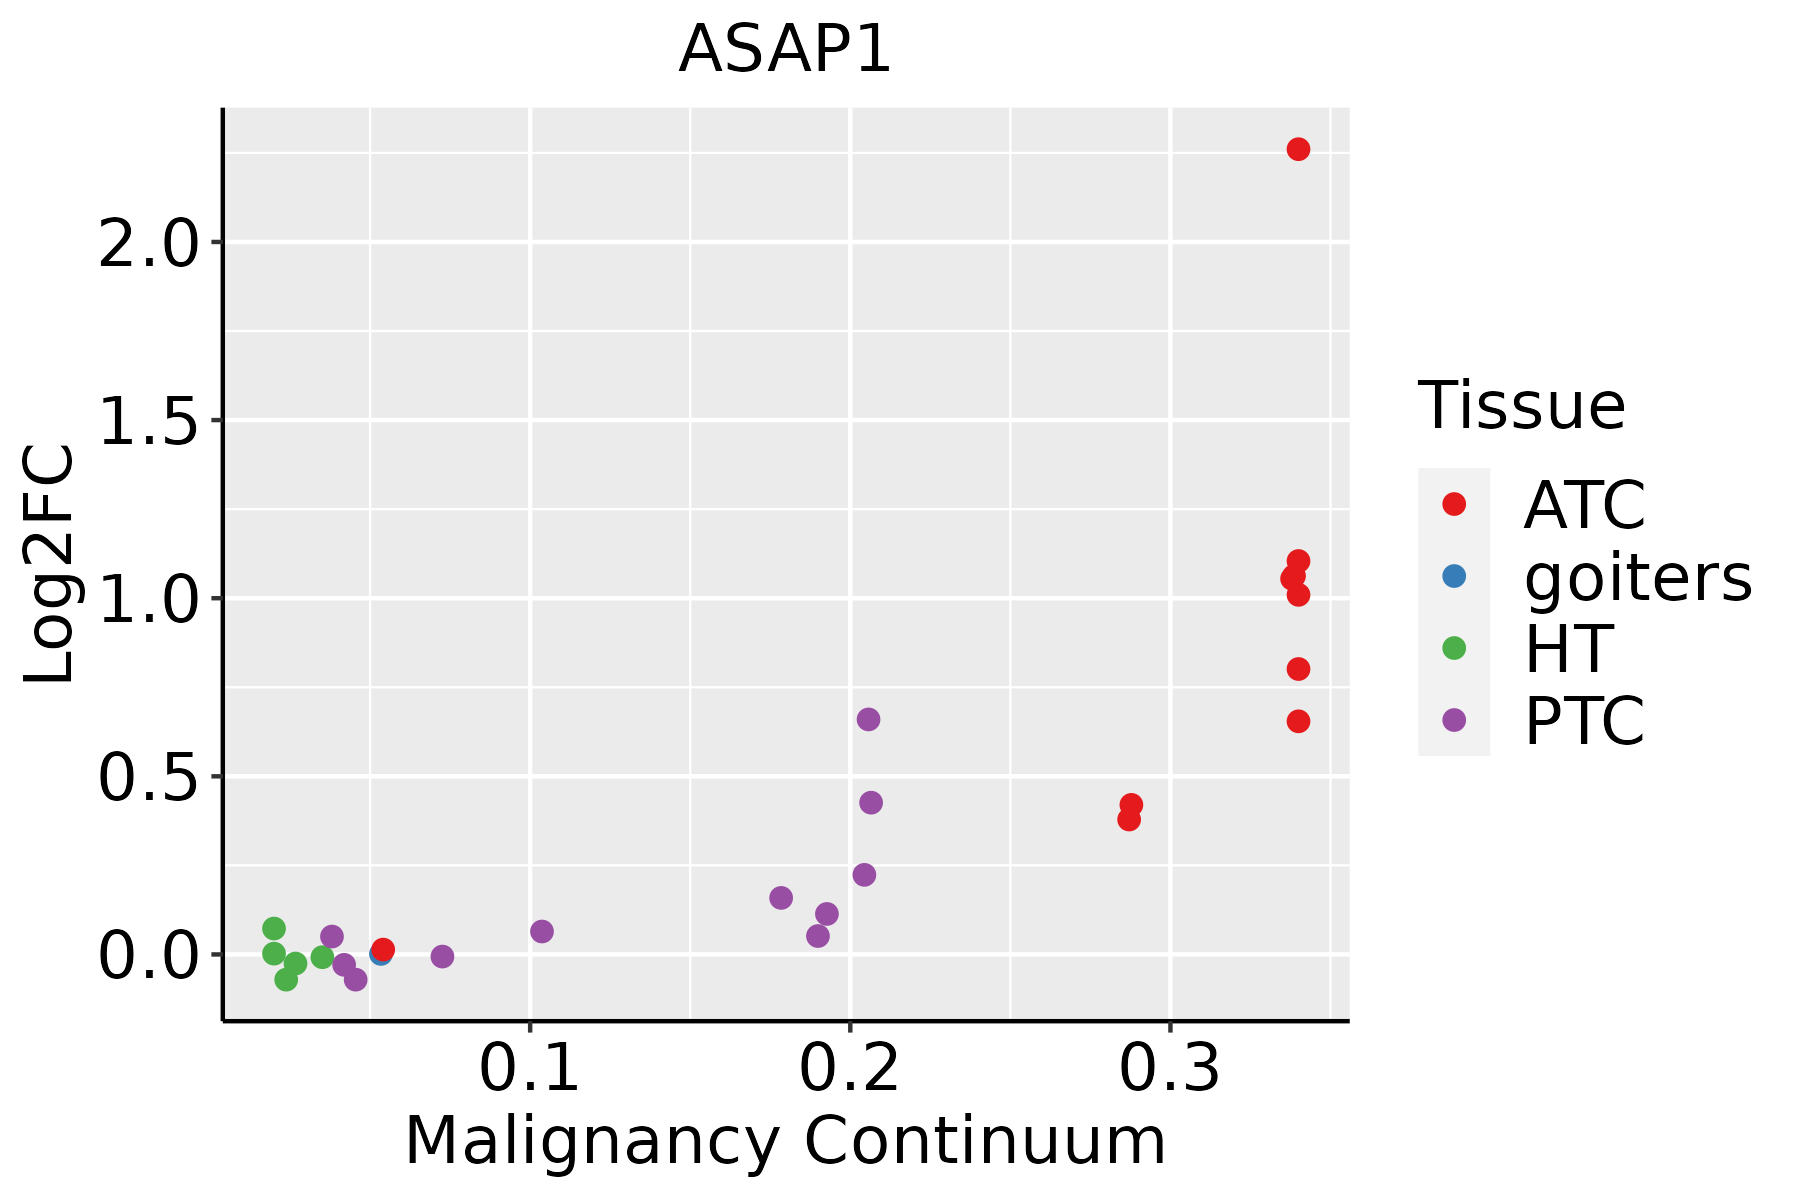 | ATC: Anaplastic thyroid cancer |
| HT: Hashimoto's thyroiditis |
| PTC: Papillary thyroid cancer |
| GO ID | Tissue | Disease Stage | Description | Gene Ratio | Bg Ratio | pvalue | p.adjust | Count |
| GO:004325410 | Cervix | CC | regulation of protein-containing complex assembly | 96/2311 | 428/18723 | 2.91e-09 | 3.05e-07 | 96 |
| GO:00430877 | Cervix | CC | regulation of GTPase activity | 79/2311 | 348/18723 | 4.21e-08 | 2.60e-06 | 79 |
| GO:00163587 | Cervix | CC | dendrite development | 58/2311 | 243/18723 | 4.52e-07 | 1.76e-05 | 58 |
| GO:003133410 | Cervix | CC | positive regulation of protein-containing complex assembly | 55/2311 | 237/18723 | 2.25e-06 | 6.73e-05 | 55 |
| GO:00609965 | Cervix | CC | dendritic spine development | 28/2311 | 99/18723 | 1.61e-05 | 3.15e-04 | 28 |
| GO:00435476 | Cervix | CC | positive regulation of GTPase activity | 53/2311 | 255/18723 | 8.72e-05 | 1.16e-03 | 53 |
| GO:00609984 | Cervix | CC | regulation of dendritic spine development | 18/2311 | 61/18723 | 2.84e-04 | 3.07e-03 | 18 |
| GO:19021153 | Cervix | CC | regulation of organelle assembly | 40/2311 | 186/18723 | 2.92e-04 | 3.15e-03 | 40 |
| GO:19021171 | Cervix | CC | positive regulation of organelle assembly | 19/2311 | 67/18723 | 3.42e-04 | 3.58e-03 | 19 |
| GO:00070092 | Cervix | CC | plasma membrane organization | 28/2311 | 142/18723 | 7.85e-03 | 4.14e-02 | 28 |
| GO:004325416 | Endometrium | AEH | regulation of protein-containing complex assembly | 83/2100 | 428/18723 | 3.90e-07 | 1.63e-05 | 83 |
| GO:003133416 | Endometrium | AEH | positive regulation of protein-containing complex assembly | 52/2100 | 237/18723 | 1.43e-06 | 4.60e-05 | 52 |
| GO:00430878 | Endometrium | AEH | regulation of GTPase activity | 66/2100 | 348/18723 | 1.26e-05 | 2.77e-04 | 66 |
| GO:00435477 | Endometrium | AEH | positive regulation of GTPase activity | 48/2100 | 255/18723 | 2.18e-04 | 2.67e-03 | 48 |
| GO:00163588 | Endometrium | AEH | dendrite development | 46/2100 | 243/18723 | 2.56e-04 | 3.03e-03 | 46 |
| GO:004325417 | Endometrium | EEC | regulation of protein-containing complex assembly | 83/2168 | 428/18723 | 1.44e-06 | 4.64e-05 | 83 |
| GO:003133417 | Endometrium | EEC | positive regulation of protein-containing complex assembly | 52/2168 | 237/18723 | 3.68e-06 | 9.90e-05 | 52 |
| GO:004308712 | Endometrium | EEC | regulation of GTPase activity | 67/2168 | 348/18723 | 1.84e-05 | 3.43e-04 | 67 |
| GO:004354712 | Endometrium | EEC | positive regulation of GTPase activity | 50/2168 | 255/18723 | 1.26e-04 | 1.66e-03 | 50 |
| GO:001635813 | Endometrium | EEC | dendrite development | 44/2168 | 243/18723 | 1.72e-03 | 1.34e-02 | 44 |
| Pathway ID | Tissue | Disease Stage | Description | Gene Ratio | Bg Ratio | pvalue | p.adjust | qvalue | Count |
| hsa0414418 | Cervix | CC | Endocytosis | 64/1267 | 251/8465 | 6.97e-06 | 6.10e-05 | 3.61e-05 | 64 |
| hsa0466612 | Cervix | CC | Fc gamma R-mediated phagocytosis | 31/1267 | 97/8465 | 1.78e-05 | 1.42e-04 | 8.40e-05 | 31 |
| hsa0414419 | Cervix | CC | Endocytosis | 64/1267 | 251/8465 | 6.97e-06 | 6.10e-05 | 3.61e-05 | 64 |
| hsa0466613 | Cervix | CC | Fc gamma R-mediated phagocytosis | 31/1267 | 97/8465 | 1.78e-05 | 1.42e-04 | 8.40e-05 | 31 |
| hsa0414420 | Endometrium | AEH | Endocytosis | 56/1197 | 251/8465 | 2.58e-04 | 2.15e-03 | 1.57e-03 | 56 |
| hsa0466614 | Endometrium | AEH | Fc gamma R-mediated phagocytosis | 27/1197 | 97/8465 | 3.02e-04 | 2.39e-03 | 1.75e-03 | 27 |
| hsa04144110 | Endometrium | AEH | Endocytosis | 56/1197 | 251/8465 | 2.58e-04 | 2.15e-03 | 1.57e-03 | 56 |
| hsa0466615 | Endometrium | AEH | Fc gamma R-mediated phagocytosis | 27/1197 | 97/8465 | 3.02e-04 | 2.39e-03 | 1.75e-03 | 27 |
| hsa0414424 | Endometrium | EEC | Endocytosis | 57/1237 | 251/8465 | 3.34e-04 | 2.82e-03 | 2.10e-03 | 57 |
| hsa0466621 | Endometrium | EEC | Fc gamma R-mediated phagocytosis | 27/1237 | 97/8465 | 5.15e-04 | 3.83e-03 | 2.85e-03 | 27 |
| hsa0414434 | Endometrium | EEC | Endocytosis | 57/1237 | 251/8465 | 3.34e-04 | 2.82e-03 | 2.10e-03 | 57 |
| hsa0466631 | Endometrium | EEC | Fc gamma R-mediated phagocytosis | 27/1237 | 97/8465 | 5.15e-04 | 3.83e-03 | 2.85e-03 | 27 |
| hsa04144210 | Esophagus | ESCC | Endocytosis | 186/4205 | 251/8465 | 9.74e-16 | 4.66e-14 | 2.39e-14 | 186 |
| hsa0466620 | Esophagus | ESCC | Fc gamma R-mediated phagocytosis | 63/4205 | 97/8465 | 1.63e-03 | 4.89e-03 | 2.50e-03 | 63 |
| hsa0414437 | Esophagus | ESCC | Endocytosis | 186/4205 | 251/8465 | 9.74e-16 | 4.66e-14 | 2.39e-14 | 186 |
| hsa04666110 | Esophagus | ESCC | Fc gamma R-mediated phagocytosis | 63/4205 | 97/8465 | 1.63e-03 | 4.89e-03 | 2.50e-03 | 63 |
| hsa0414422 | Liver | HCC | Endocytosis | 178/4020 | 251/8465 | 2.03e-14 | 5.22e-13 | 2.91e-13 | 178 |
| hsa0466610 | Liver | HCC | Fc gamma R-mediated phagocytosis | 58/4020 | 97/8465 | 9.65e-03 | 2.52e-02 | 1.40e-02 | 58 |
| hsa0414432 | Liver | HCC | Endocytosis | 178/4020 | 251/8465 | 2.03e-14 | 5.22e-13 | 2.91e-13 | 178 |
| hsa0466611 | Liver | HCC | Fc gamma R-mediated phagocytosis | 58/4020 | 97/8465 | 9.65e-03 | 2.52e-02 | 1.40e-02 | 58 |
| Hugo Symbol | Variant Class | Variant Classification | dbSNP RS | HGVSc | HGVSp | HGVSp Short | SWISSPROT | BIOTYPE | SIFT | PolyPhen | Tumor Sample Barcode | Tissue | Histology | Sex | Age | Stage | Therapy Types | Drugs | Outcome |
| ASAP1 | SNV | Missense_Mutation | | c.727T>G | p.Tyr243Asp | p.Y243D | Q9ULH1 | protein_coding | deleterious(0) | possibly_damaging(0.622) | TCGA-A8-A09I-01 | Breast | breast invasive carcinoma | Female | >=65 | I/II | Hormone Therapy | anastrozole | SD |
| ASAP1 | SNV | Missense_Mutation | | c.2701N>A | p.Val901Met | p.V901M | Q9ULH1 | protein_coding | tolerated(0.13) | probably_damaging(0.994) | TCGA-A8-A09Z-01 | Breast | breast invasive carcinoma | Female | >=65 | I/II | Unknown | Unknown | SD |
| ASAP1 | SNV | Missense_Mutation | novel | c.2365N>A | p.Glu789Lys | p.E789K | Q9ULH1 | protein_coding | tolerated(0.42) | benign(0.03) | TCGA-AC-A23H-01 | Breast | breast invasive carcinoma | Female | >=65 | I/II | Unknown | Unknown | PD |
| ASAP1 | SNV | Missense_Mutation | novel | c.489N>C | p.Lys163Asn | p.K163N | Q9ULH1 | protein_coding | deleterious(0) | probably_damaging(0.994) | TCGA-AC-A23H-01 | Breast | breast invasive carcinoma | Female | >=65 | I/II | Unknown | Unknown | PD |
| ASAP1 | SNV | Missense_Mutation | | c.1705N>A | p.Glu569Lys | p.E569K | Q9ULH1 | protein_coding | deleterious(0.03) | benign(0.005) | TCGA-D8-A1JA-01 | Breast | breast invasive carcinoma | Female | <65 | III/IV | Chemotherapy | adriamycin | PD |
| ASAP1 | SNV | Missense_Mutation | | c.2503N>G | p.Lys835Glu | p.K835E | Q9ULH1 | protein_coding | deleterious(0.04) | probably_damaging(0.971) | TCGA-D8-A1XQ-01 | Breast | breast invasive carcinoma | Female | >=65 | I/II | Unknown | Unknown | SD |
| ASAP1 | SNV | Missense_Mutation | | c.403N>G | p.Leu135Val | p.L135V | Q9ULH1 | protein_coding | deleterious(0.04) | benign(0.1) | TCGA-E9-A1R2-01 | Breast | breast invasive carcinoma | Female | <65 | III/IV | Chemotherapy | taxotere | CR |
| ASAP1 | SNV | Missense_Mutation | novel | c.1148N>G | p.Lys383Arg | p.K383R | Q9ULH1 | protein_coding | tolerated(0.14) | probably_damaging(0.996) | TCGA-LQ-A4E4-01 | Breast | breast invasive carcinoma | Female | >=65 | III/IV | Hormone Therapy | anastrozole | PD |
| ASAP1 | insertion | Frame_Shift_Ins | novel | c.3206_3207insATGTACTTTACCCATGGTATCATGTAACCTTGTGAGTTGTAGGC | p.Arg1070CysfsTer18 | p.R1070Cfs*18 | Q9ULH1 | protein_coding | | | TCGA-A2-A0D1-01 | Breast | breast invasive carcinoma | Female | >=65 | I/II | Chemotherapy | taxotere | SD |
| ASAP1 | insertion | Nonsense_Mutation | novel | c.310_311insTATGAC | p.Ser104delinsIleTerArg | p.S104delinsI*R | Q9ULH1 | protein_coding | | | TCGA-AC-A3QQ-01 | Breast | breast invasive carcinoma | Female | <65 | I/II | Unknown | Unknown | SD |


