
|
|||||
|
 | |
| |
| |
| |
| |
| |
|
Gene: ARVCF |
Gene summary for ARVCF |
| Gene information | Species | Human | Gene symbol | ARVCF | Gene ID | 421 |
| Gene name | ARVCF delta catenin family member | |
| Gene Alias | ARVCF | |
| Cytomap | 22q11.21 | |
| Gene Type | protein-coding | GO ID | GO:0007043 | UniProtAcc | O00192 |
Top |
Malignant transformation analysis |
| Identification of the aberrant gene expression in precancerous and cancerous lesions by comparing the gene expression of stem-like cells in diseased tissues with normal stem cells |
| Entrez ID | Symbol | Replicates | Species | Organ | Tissue | Adj P-value | Log2FC | Malignancy |
| 421 | ARVCF | LZE24T | Human | Esophagus | ESCC | 5.13e-03 | 9.11e-02 | 0.0596 |
| 421 | ARVCF | P1T-E | Human | Esophagus | ESCC | 4.62e-03 | 1.50e-01 | 0.0875 |
| 421 | ARVCF | P2T-E | Human | Esophagus | ESCC | 1.88e-04 | 1.14e-01 | 0.1177 |
| 421 | ARVCF | P4T-E | Human | Esophagus | ESCC | 1.36e-04 | 1.21e-01 | 0.1323 |
| 421 | ARVCF | P8T-E | Human | Esophagus | ESCC | 4.31e-06 | 1.33e-01 | 0.0889 |
| 421 | ARVCF | P10T-E | Human | Esophagus | ESCC | 2.05e-07 | 1.41e-01 | 0.116 |
| 421 | ARVCF | P11T-E | Human | Esophagus | ESCC | 3.25e-05 | 2.22e-01 | 0.1426 |
| 421 | ARVCF | P12T-E | Human | Esophagus | ESCC | 1.76e-12 | 2.18e-01 | 0.1122 |
| 421 | ARVCF | P16T-E | Human | Esophagus | ESCC | 9.21e-12 | 1.74e-01 | 0.1153 |
| 421 | ARVCF | P17T-E | Human | Esophagus | ESCC | 4.79e-04 | 1.59e-01 | 0.1278 |
| 421 | ARVCF | P20T-E | Human | Esophagus | ESCC | 3.97e-02 | 9.27e-02 | 0.1124 |
| 421 | ARVCF | P21T-E | Human | Esophagus | ESCC | 5.46e-18 | 4.32e-01 | 0.1617 |
| 421 | ARVCF | P23T-E | Human | Esophagus | ESCC | 1.48e-05 | 1.41e-01 | 0.108 |
| 421 | ARVCF | P24T-E | Human | Esophagus | ESCC | 1.66e-02 | 8.04e-02 | 0.1287 |
| 421 | ARVCF | P26T-E | Human | Esophagus | ESCC | 2.02e-06 | 1.36e-01 | 0.1276 |
| 421 | ARVCF | P27T-E | Human | Esophagus | ESCC | 8.40e-04 | 1.01e-01 | 0.1055 |
| 421 | ARVCF | P28T-E | Human | Esophagus | ESCC | 8.40e-04 | 8.49e-02 | 0.1149 |
| 421 | ARVCF | P30T-E | Human | Esophagus | ESCC | 1.02e-02 | 1.32e-01 | 0.137 |
| 421 | ARVCF | P37T-E | Human | Esophagus | ESCC | 6.05e-08 | 1.69e-01 | 0.1371 |
| 421 | ARVCF | P38T-E | Human | Esophagus | ESCC | 2.66e-02 | 1.15e-01 | 0.127 |
| Page: 1 2 3 |
| Tissue | Expression Dynamics | Abbreviation |
| Esophagus | 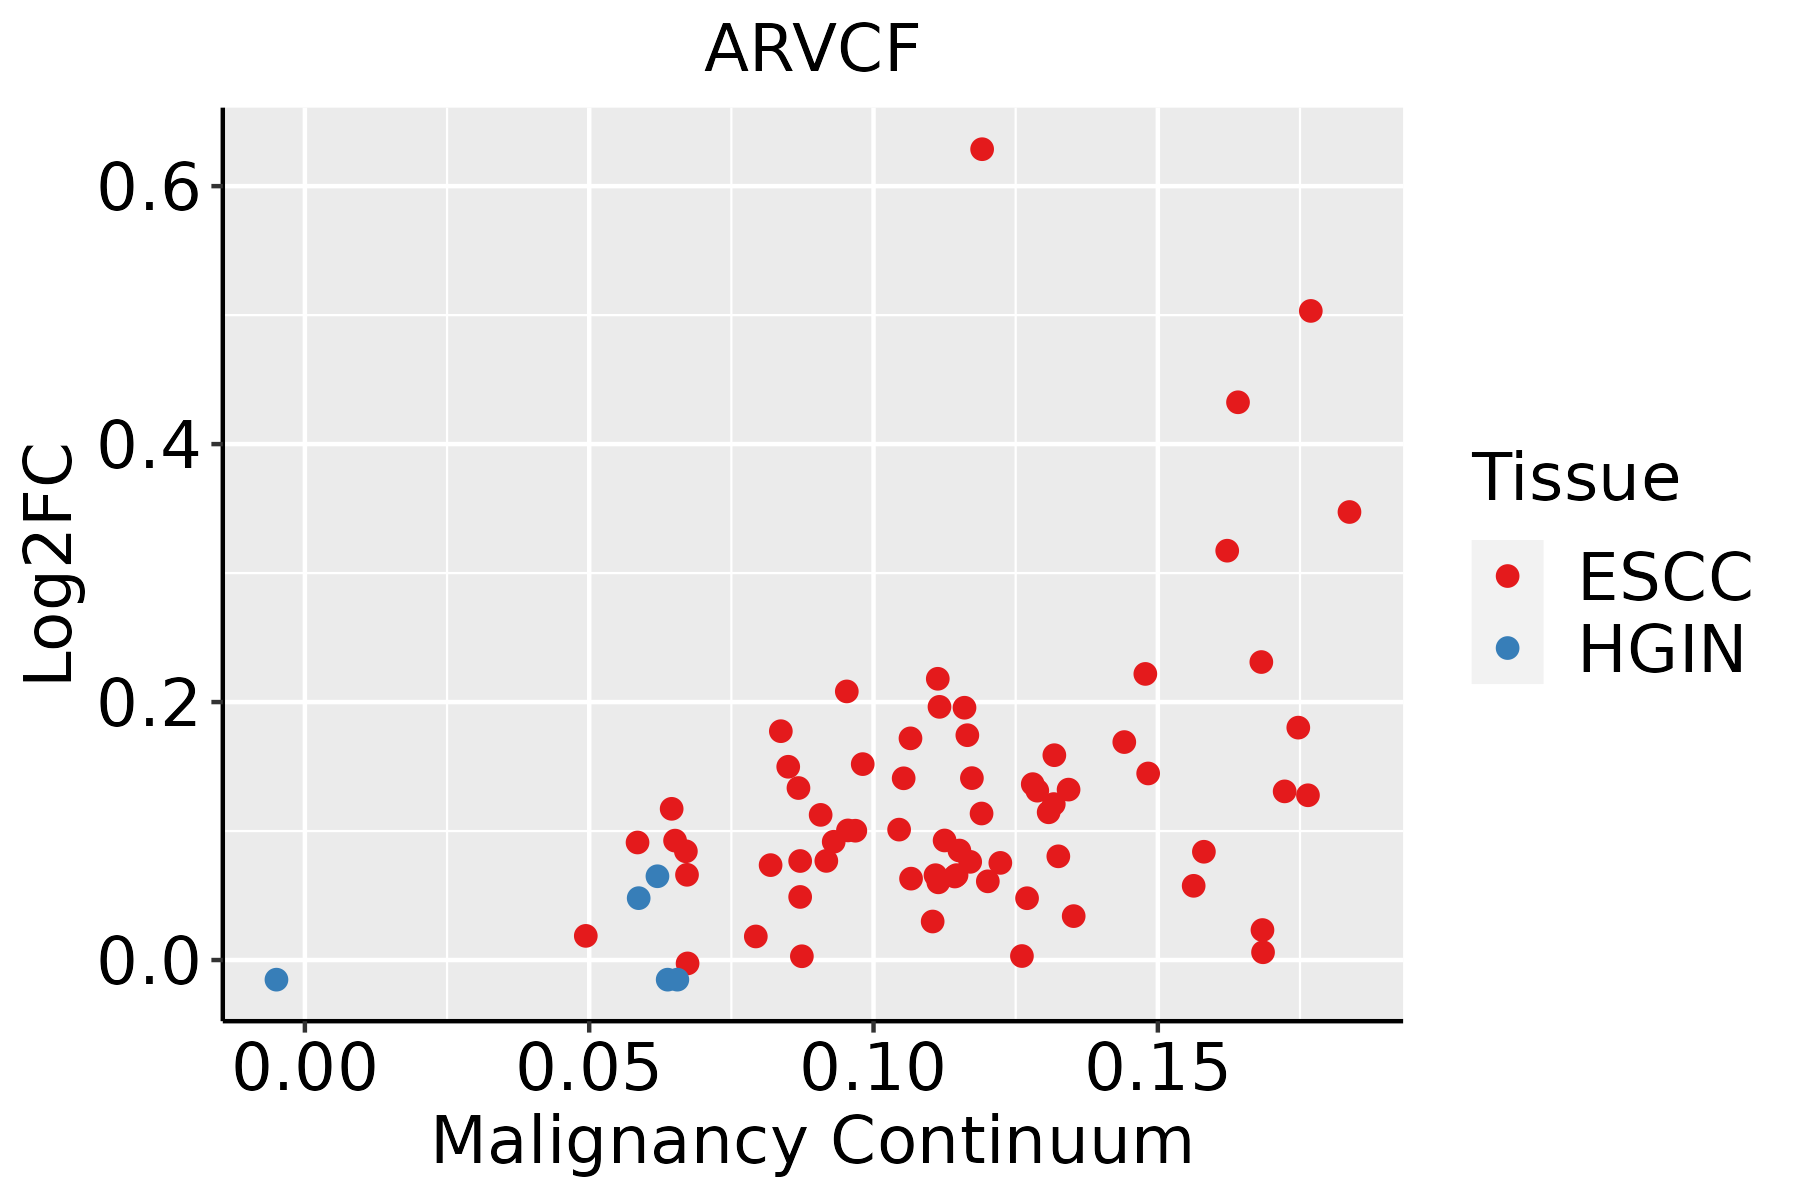 | ESCC: Esophageal squamous cell carcinoma |
| HGIN: High-grade intraepithelial neoplasias | ||
| LGIN: Low-grade intraepithelial neoplasias |
| ∗log2FC in expression of this searched gene in stem-like cells from each diseased tissue sample relative to stem-like cells in normal samples in each tissue plotted against the malignancy continuum. Samples are colored based on if they are from different disease stage. |
Top |
Malignant transformation related pathway analysis |
| Find out the enriched GO biological processes and KEGG pathways involved in transition from healthy to precancer to cancer |
| Tissue | Disease Stage | Enriched GO biological Processes |
| Colorectum | AD |  |
| Colorectum | SER |  |
| Colorectum | MSS |  |
| Colorectum | MSI-H |  |
| Colorectum | FAP |  |
| ∗Top 15 enriched GO BP terms are showed in the bar plot of each disease state in each tissue. Each row represents a significant GO biological process which is colored according to the -log10(p.adjust). |
| Page: 1 2 3 4 5 6 7 8 9 |
| GO ID | Tissue | Disease Stage | Description | Gene Ratio | Bg Ratio | pvalue | p.adjust | Count |
| GO:003432918 | Esophagus | ESCC | cell junction assembly | 227/8552 | 420/18723 | 3.06e-04 | 1.83e-03 | 227 |
| GO:004521620 | Esophagus | ESCC | cell-cell junction organization | 114/8552 | 200/18723 | 8.04e-04 | 4.16e-03 | 114 |
| Page: 1 |
| Pathway ID | Tissue | Disease Stage | Description | Gene Ratio | Bg Ratio | pvalue | p.adjust | qvalue | Count |
| Page: 1 |
Top |
Cell-cell communication analysis |
| Identification of potential cell-cell interactions between two cell types and their ligand-receptor pairs for different disease states |
| Ligand | Receptor | LRpair | Pathway | Tissue | Disease Stage |
| Page: 1 |
Top |
Single-cell gene regulatory network inference analysis |
| Find out the significant the regulons (TFs) and the target genes of each regulon across cell types for different disease states |
| TF | Cell Type | Tissue | Disease Stage | Target Gene | RSS | Regulon Activity |
| ∗The dot plots of a searched regulon are shown for all cell subpopulations in each disease state of each tissue based on the regulon specific score inferred using pySCENIC and by calculating the average expression. |
| Page: 1 |
Top |
Somatic mutation of malignant transformation related genes |
| Annotation of somatic variants for genes involved in malignant transformation |
| Hugo Symbol | Variant Class | Variant Classification | dbSNP RS | HGVSc | HGVSp | HGVSp Short | SWISSPROT | BIOTYPE | SIFT | PolyPhen | Tumor Sample Barcode | Tissue | Histology | Sex | Age | Stage | Therapy Types | Drugs | Outcome |
| ARVCF | SNV | Missense_Mutation | c.1966N>C | p.Glu656Gln | p.E656Q | O00192 | protein_coding | tolerated(0.17) | probably_damaging(0.997) | TCGA-AC-A23H-01 | Breast | breast invasive carcinoma | Female | >=65 | I/II | Unknown | Unknown | PD | |
| ARVCF | SNV | Missense_Mutation | c.2294N>A | p.Pro765Gln | p.P765Q | O00192 | protein_coding | tolerated(0.39) | benign(0) | TCGA-AO-A128-01 | Breast | breast invasive carcinoma | Female | <65 | I/II | Chemotherapy | doxorubicin | SD | |
| ARVCF | SNV | Missense_Mutation | novel | c.1921G>A | p.Asp641Asn | p.D641N | O00192 | protein_coding | tolerated(0.08) | probably_damaging(0.954) | TCGA-B6-A0RS-01 | Breast | breast invasive carcinoma | Female | <65 | I/II | Unknown | Unknown | PD |
| ARVCF | SNV | Missense_Mutation | c.1538N>A | p.Ala513Asp | p.A513D | O00192 | protein_coding | deleterious(0.03) | possibly_damaging(0.885) | TCGA-BH-A1FN-01 | Breast | breast invasive carcinoma | Female | <65 | I/II | Unknown | Unknown | PD | |
| ARVCF | SNV | Missense_Mutation | rs756681144 | c.2468C>T | p.Ser823Leu | p.S823L | O00192 | protein_coding | deleterious(0) | possibly_damaging(0.829) | TCGA-C8-A26Y-01 | Breast | breast invasive carcinoma | Female | >=65 | I/II | Unknown | Unknown | SD |
| ARVCF | deletion | Frame_Shift_Del | c.2588_2595delNNNNNNNN | p.Leu863ArgfsTer5 | p.L863Rfs*5 | O00192 | protein_coding | TCGA-GM-A2DB-01 | Breast | breast invasive carcinoma | Female | <65 | I/II | Chemotherapy | taxol | CR | |||
| ARVCF | SNV | Missense_Mutation | rs747415960 | c.1726N>T | p.Arg576Trp | p.R576W | O00192 | protein_coding | deleterious(0) | probably_damaging(1) | TCGA-BI-A0VR-01 | Cervix | cervical & endocervical cancer | Female | <65 | III/IV | Unknown | Unknown | SD |
| ARVCF | SNV | Missense_Mutation | novel | c.2257N>C | p.Glu753Gln | p.E753Q | O00192 | protein_coding | tolerated(0.06) | benign(0.001) | TCGA-C5-A2LZ-01 | Cervix | cervical & endocervical cancer | Female | >=65 | III/IV | Unknown | Unknown | PD |
| ARVCF | SNV | Missense_Mutation | c.1274G>A | p.Arg425His | p.R425H | O00192 | protein_coding | deleterious(0) | probably_damaging(0.993) | TCGA-EA-A410-01 | Cervix | cervical & endocervical cancer | Female | <65 | I/II | Unknown | Unknown | SD | |
| ARVCF | SNV | Missense_Mutation | c.2051N>T | p.Ala684Val | p.A684V | O00192 | protein_coding | deleterious(0.01) | probably_damaging(0.934) | TCGA-A6-3809-01 | Colorectum | colon adenocarcinoma | Female | >=65 | I/II | Unknown | Unknown | SD |
| Page: 1 2 3 4 5 6 7 8 |
Top |
Related drugs of malignant transformation related genes |
| Identification of chemicals and drugs interact with genes involved in malignant transfromation |
| (DGIdb 4.0) |
| Entrez ID | Symbol | Category | Interaction Types | Drug Claim Name | Drug Name | PMIDs |
| Page: 1 |

Copyright 2023-Present -The University of Texas Health Science Center at Houston |