
|
|||||
|
 | |
| |
| |
| |
| |
| |
|
Gene: ARV1 |
Gene summary for ARV1 |
| Gene information | Species | Human | Gene symbol | ARV1 | Gene ID | 64801 |
| Gene name | ARV1 homolog, fatty acid homeostasis modulator | |
| Gene Alias | DEE38 | |
| Cytomap | 1q42.2 | |
| Gene Type | protein-coding | GO ID | GO:0006066 | UniProtAcc | Q9H2C2 |
Top |
Malignant transformation analysis |
| Identification of the aberrant gene expression in precancerous and cancerous lesions by comparing the gene expression of stem-like cells in diseased tissues with normal stem cells |
| Entrez ID | Symbol | Replicates | Species | Organ | Tissue | Adj P-value | Log2FC | Malignancy |
| 64801 | ARV1 | LZE4T | Human | Esophagus | ESCC | 3.82e-07 | 2.23e-01 | 0.0811 |
| 64801 | ARV1 | LZE20T | Human | Esophagus | ESCC | 1.42e-04 | 9.98e-02 | 0.0662 |
| 64801 | ARV1 | LZE24T | Human | Esophagus | ESCC | 2.22e-15 | 3.69e-01 | 0.0596 |
| 64801 | ARV1 | P2T-E | Human | Esophagus | ESCC | 5.61e-18 | 2.08e-01 | 0.1177 |
| 64801 | ARV1 | P4T-E | Human | Esophagus | ESCC | 1.08e-06 | 2.99e-01 | 0.1323 |
| 64801 | ARV1 | P5T-E | Human | Esophagus | ESCC | 2.54e-10 | 1.98e-01 | 0.1327 |
| 64801 | ARV1 | P8T-E | Human | Esophagus | ESCC | 6.18e-12 | 1.94e-01 | 0.0889 |
| 64801 | ARV1 | P9T-E | Human | Esophagus | ESCC | 5.29e-10 | 3.03e-01 | 0.1131 |
| 64801 | ARV1 | P10T-E | Human | Esophagus | ESCC | 1.75e-31 | 6.89e-01 | 0.116 |
| 64801 | ARV1 | P11T-E | Human | Esophagus | ESCC | 1.67e-04 | 2.19e-01 | 0.1426 |
| 64801 | ARV1 | P12T-E | Human | Esophagus | ESCC | 1.57e-17 | 2.58e-01 | 0.1122 |
| 64801 | ARV1 | P15T-E | Human | Esophagus | ESCC | 8.72e-15 | 3.73e-01 | 0.1149 |
| 64801 | ARV1 | P16T-E | Human | Esophagus | ESCC | 3.79e-16 | 2.77e-01 | 0.1153 |
| 64801 | ARV1 | P17T-E | Human | Esophagus | ESCC | 3.07e-07 | 1.94e-01 | 0.1278 |
| 64801 | ARV1 | P19T-E | Human | Esophagus | ESCC | 1.19e-06 | 3.30e-01 | 0.1662 |
| 64801 | ARV1 | P20T-E | Human | Esophagus | ESCC | 4.09e-18 | 3.77e-01 | 0.1124 |
| 64801 | ARV1 | P21T-E | Human | Esophagus | ESCC | 9.04e-22 | 4.45e-01 | 0.1617 |
| 64801 | ARV1 | P22T-E | Human | Esophagus | ESCC | 2.46e-18 | 4.16e-01 | 0.1236 |
| 64801 | ARV1 | P23T-E | Human | Esophagus | ESCC | 4.06e-23 | 6.68e-01 | 0.108 |
| 64801 | ARV1 | P24T-E | Human | Esophagus | ESCC | 1.42e-11 | 1.88e-01 | 0.1287 |
| Page: 1 2 3 4 |
| Tissue | Expression Dynamics | Abbreviation |
| Esophagus | 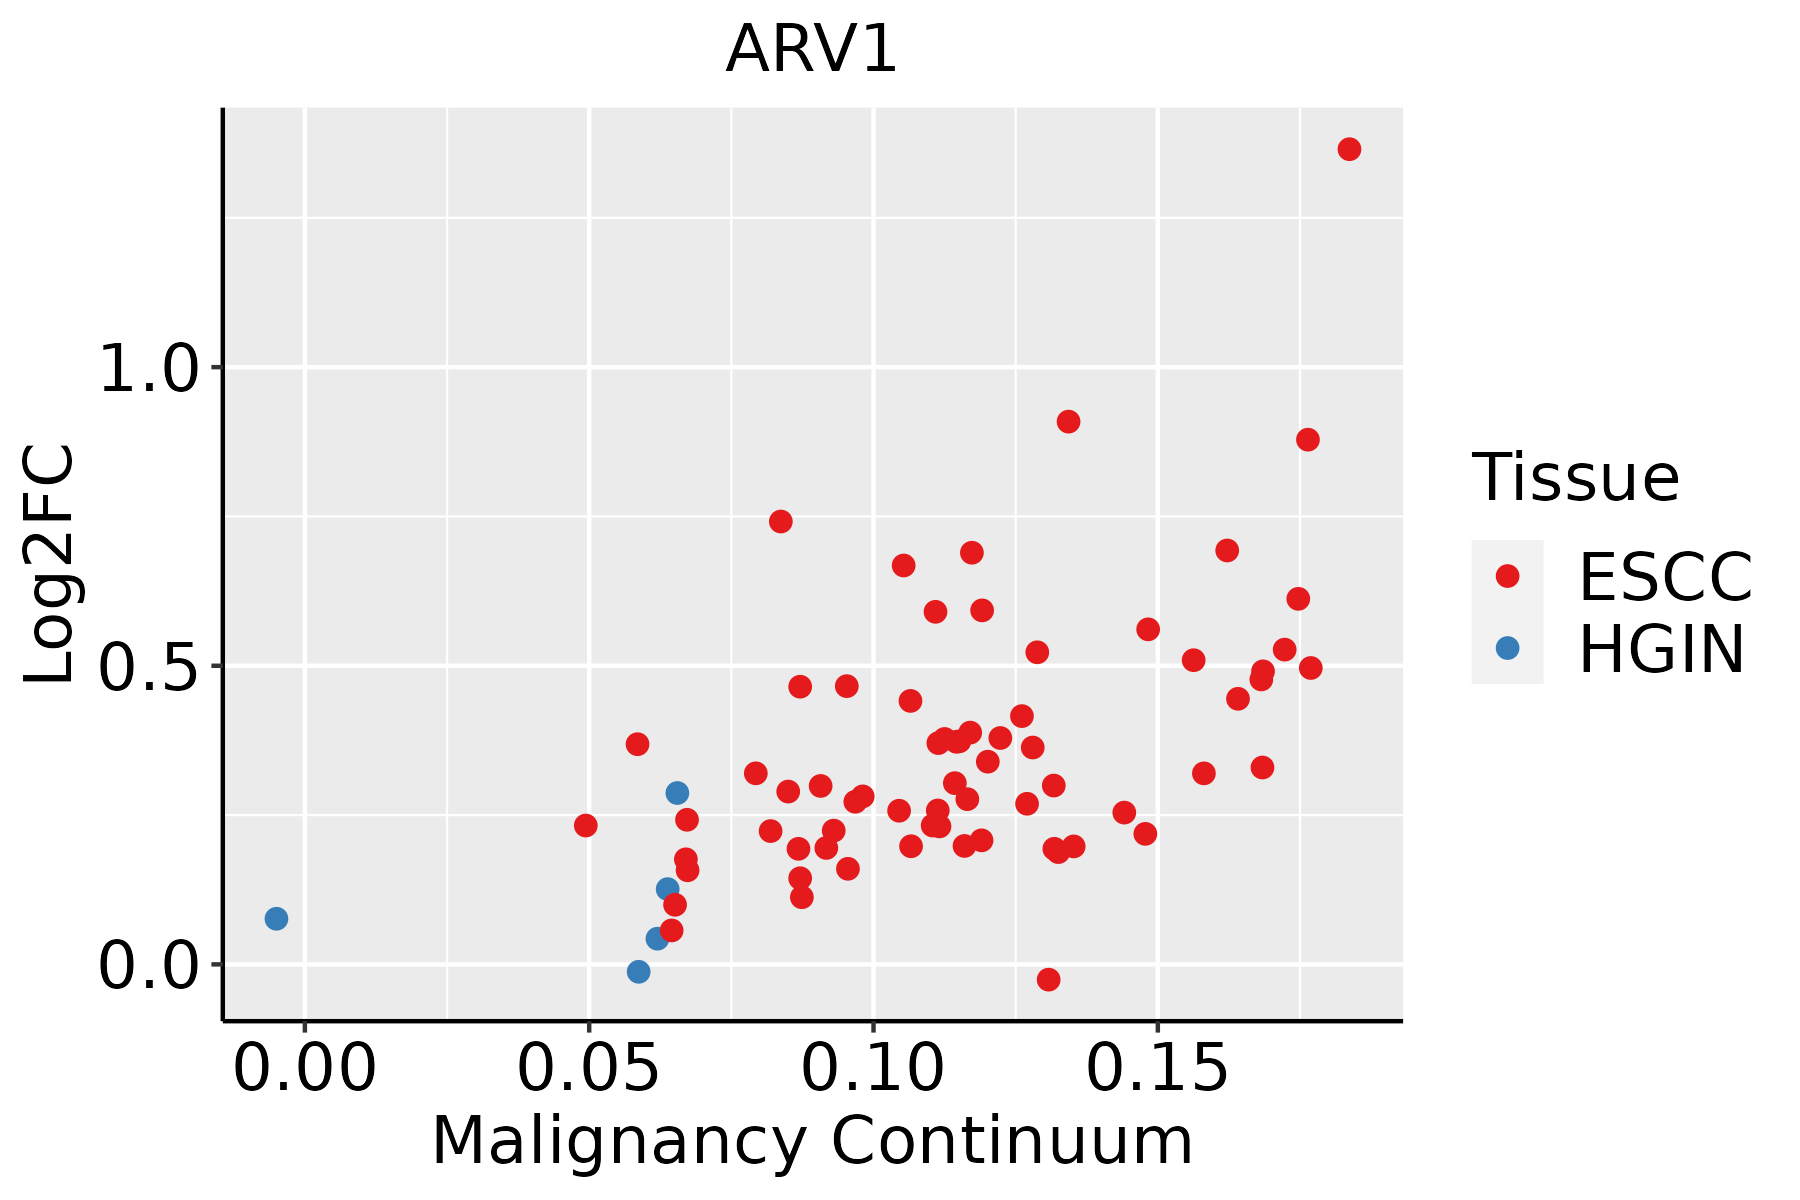 | ESCC: Esophageal squamous cell carcinoma |
| HGIN: High-grade intraepithelial neoplasias | ||
| LGIN: Low-grade intraepithelial neoplasias | ||
| Oral Cavity | 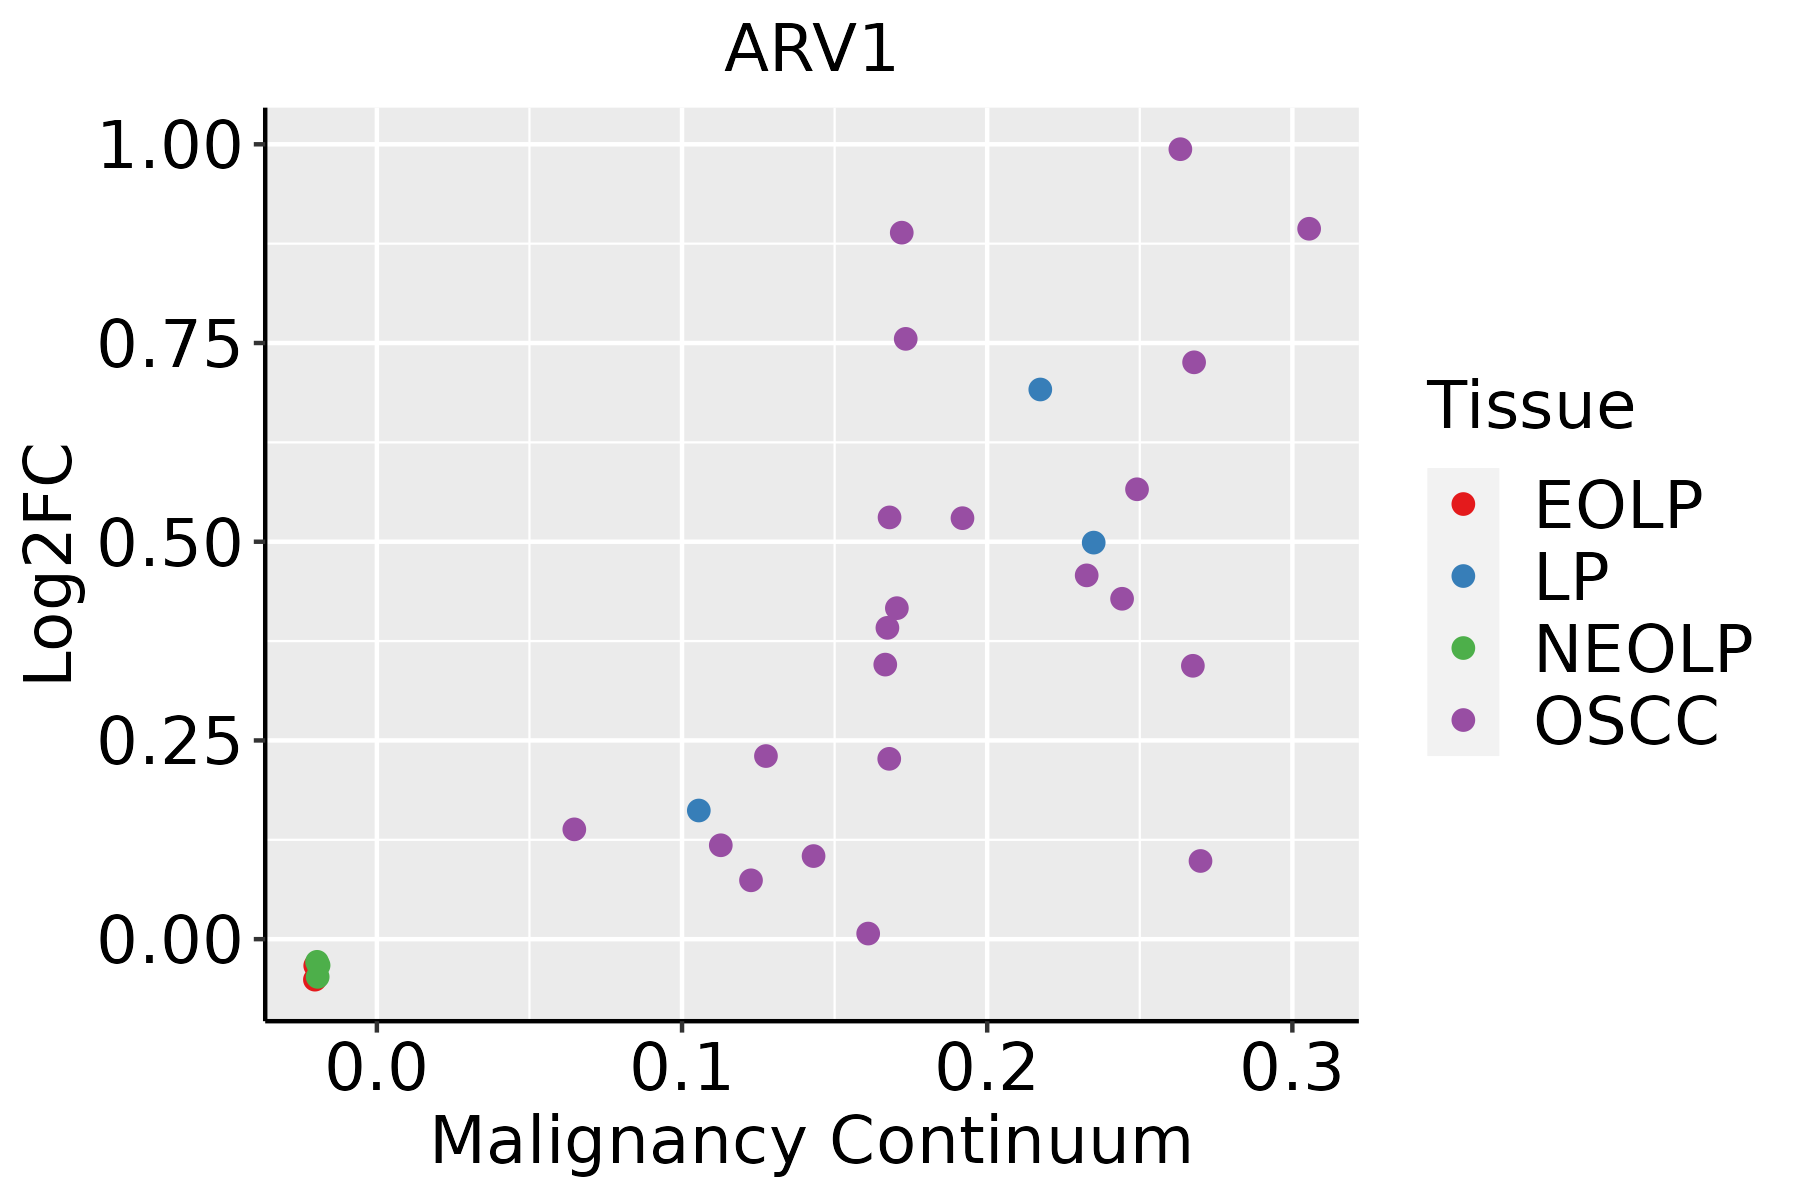 | EOLP: Erosive Oral lichen planus |
| LP: leukoplakia | ||
| NEOLP: Non-erosive oral lichen planus | ||
| OSCC: Oral squamous cell carcinoma | ||
| Skin |  | AK: Actinic keratosis |
| cSCC: Cutaneous squamous cell carcinoma | ||
| SCCIS:squamous cell carcinoma in situ |
| ∗log2FC in expression of this searched gene in stem-like cells from each diseased tissue sample relative to stem-like cells in normal samples in each tissue plotted against the malignancy continuum. Samples are colored based on if they are from different disease stage. |
Top |
Malignant transformation related pathway analysis |
| Find out the enriched GO biological processes and KEGG pathways involved in transition from healthy to precancer to cancer |
| Tissue | Disease Stage | Enriched GO biological Processes |
| Colorectum | AD |  |
| Colorectum | SER |  |
| Colorectum | MSS |  |
| Colorectum | MSI-H |  |
| Colorectum | FAP |  |
| ∗Top 15 enriched GO BP terms are showed in the bar plot of each disease state in each tissue. Each row represents a significant GO biological process which is colored according to the -log10(p.adjust). |
| Page: 1 2 3 4 5 6 7 8 9 |
| GO ID | Tissue | Disease Stage | Description | Gene Ratio | Bg Ratio | pvalue | p.adjust | Count |
| GO:003238618 | Esophagus | ESCC | regulation of intracellular transport | 243/8552 | 337/18723 | 3.20e-23 | 7.25e-21 | 243 |
| GO:00066433 | Esophagus | ESCC | membrane lipid metabolic process | 130/8552 | 203/18723 | 9.29e-08 | 1.54e-06 | 130 |
| GO:00060668 | Esophagus | ESCC | alcohol metabolic process | 202/8552 | 353/18723 | 7.32e-06 | 7.26e-05 | 202 |
| GO:00161263 | Esophagus | ESCC | sterol biosynthetic process | 46/8552 | 64/18723 | 1.91e-05 | 1.67e-04 | 46 |
| GO:00066652 | Esophagus | ESCC | sphingolipid metabolic process | 96/8552 | 155/18723 | 3.21e-05 | 2.66e-04 | 96 |
| GO:00066953 | Esophagus | ESCC | cholesterol biosynthetic process | 41/8552 | 57/18723 | 5.25e-05 | 4.06e-04 | 41 |
| GO:19026533 | Esophagus | ESCC | secondary alcohol biosynthetic process | 41/8552 | 57/18723 | 5.25e-05 | 4.06e-04 | 41 |
| GO:00620129 | Esophagus | ESCC | regulation of small molecule metabolic process | 184/8552 | 334/18723 | 3.11e-04 | 1.85e-03 | 184 |
| GO:19026524 | Esophagus | ESCC | secondary alcohol metabolic process | 87/8552 | 147/18723 | 6.58e-04 | 3.50e-03 | 87 |
| GO:00461653 | Esophagus | ESCC | alcohol biosynthetic process | 83/8552 | 140/18723 | 8.04e-04 | 4.16e-03 | 83 |
| GO:00066946 | Esophagus | ESCC | steroid biosynthetic process | 98/8552 | 173/18723 | 2.34e-03 | 1.03e-02 | 98 |
| GO:00082034 | Esophagus | ESCC | cholesterol metabolic process | 79/8552 | 137/18723 | 3.11e-03 | 1.29e-02 | 79 |
| GO:00161254 | Esophagus | ESCC | sterol metabolic process | 86/8552 | 152/18723 | 4.37e-03 | 1.73e-02 | 86 |
| GO:19016174 | Esophagus | ESCC | organic hydroxy compound biosynthetic process | 128/8552 | 237/18723 | 5.86e-03 | 2.16e-02 | 128 |
| GO:00323661 | Esophagus | ESCC | intracellular sterol transport | 20/8552 | 29/18723 | 9.66e-03 | 3.34e-02 | 20 |
| GO:00323671 | Esophagus | ESCC | intracellular cholesterol transport | 20/8552 | 29/18723 | 9.66e-03 | 3.34e-02 | 20 |
| GO:00192168 | Esophagus | ESCC | regulation of lipid metabolic process | 172/8552 | 331/18723 | 1.20e-02 | 4.02e-02 | 172 |
| GO:003238615 | Oral cavity | OSCC | regulation of intracellular transport | 218/7305 | 337/18723 | 6.91e-22 | 1.41e-19 | 218 |
| GO:00066432 | Oral cavity | OSCC | membrane lipid metabolic process | 111/7305 | 203/18723 | 4.02e-06 | 4.69e-05 | 111 |
| GO:00060667 | Oral cavity | OSCC | alcohol metabolic process | 179/7305 | 353/18723 | 4.54e-06 | 5.21e-05 | 179 |
| Page: 1 2 3 |
| Pathway ID | Tissue | Disease Stage | Description | Gene Ratio | Bg Ratio | pvalue | p.adjust | qvalue | Count |
| Page: 1 |
Top |
Cell-cell communication analysis |
| Identification of potential cell-cell interactions between two cell types and their ligand-receptor pairs for different disease states |
| Ligand | Receptor | LRpair | Pathway | Tissue | Disease Stage |
| Page: 1 |
Top |
Single-cell gene regulatory network inference analysis |
| Find out the significant the regulons (TFs) and the target genes of each regulon across cell types for different disease states |
| TF | Cell Type | Tissue | Disease Stage | Target Gene | RSS | Regulon Activity |
| ∗The dot plots of a searched regulon are shown for all cell subpopulations in each disease state of each tissue based on the regulon specific score inferred using pySCENIC and by calculating the average expression. |
| Page: 1 |
Top |
Somatic mutation of malignant transformation related genes |
| Annotation of somatic variants for genes involved in malignant transformation |
| Hugo Symbol | Variant Class | Variant Classification | dbSNP RS | HGVSc | HGVSp | HGVSp Short | SWISSPROT | BIOTYPE | SIFT | PolyPhen | Tumor Sample Barcode | Tissue | Histology | Sex | Age | Stage | Therapy Types | Drugs | Outcome |
| ARV1 | SNV | Missense_Mutation | novel | c.127N>C | p.Glu43Gln | p.E43Q | Q9H2C2 | protein_coding | tolerated(0.08) | probably_damaging(0.999) | TCGA-Z7-A8R6-01 | Breast | breast invasive carcinoma | Female | <65 | I/II | Chemotherapy | taxol | CR |
| ARV1 | SNV | Missense_Mutation | c.58G>A | p.Ala20Thr | p.A20T | Q9H2C2 | protein_coding | tolerated_low_confidence(0.55) | benign(0) | TCGA-2W-A8YY-01 | Cervix | cervical & endocervical cancer | Female | <65 | I/II | Chemotherapy | cisplatin | CR | |
| ARV1 | SNV | Missense_Mutation | novel | c.253N>T | p.Ala85Ser | p.A85S | Q9H2C2 | protein_coding | tolerated(0.1) | benign(0.341) | TCGA-FU-A3EO-01 | Cervix | cervical & endocervical cancer | Female | <65 | I/II | Unknown | Unknown | SD |
| ARV1 | SNV | Missense_Mutation | c.504G>T | p.Met168Ile | p.M168I | Q9H2C2 | protein_coding | tolerated(0.45) | benign(0.001) | TCGA-IR-A3LL-01 | Cervix | cervical & endocervical cancer | Female | <65 | I/II | Chemotherapy | cisplatin | CR | |
| ARV1 | SNV | Missense_Mutation | novel | c.127N>C | p.Glu43Gln | p.E43Q | Q9H2C2 | protein_coding | tolerated(0.08) | probably_damaging(0.999) | TCGA-MA-AA41-01 | Cervix | cervical & endocervical cancer | Female | <65 | I/II | Unknown | Unknown | SD |
| ARV1 | SNV | Missense_Mutation | rs368169867 | c.692N>A | p.Arg231His | p.R231H | Q9H2C2 | protein_coding | tolerated(0.11) | probably_damaging(0.959) | TCGA-AA-3492-01 | Colorectum | colon adenocarcinoma | Female | >=65 | I/II | Unknown | Unknown | SD |
| ARV1 | SNV | Missense_Mutation | c.361G>T | p.Asp121Tyr | p.D121Y | Q9H2C2 | protein_coding | deleterious(0.01) | probably_damaging(0.979) | TCGA-AA-3977-01 | Colorectum | colon adenocarcinoma | Male | >=65 | I/II | Unknown | Unknown | SD | |
| ARV1 | SNV | Missense_Mutation | c.701C>T | p.Ser234Phe | p.S234F | Q9H2C2 | protein_coding | deleterious(0.05) | benign(0.332) | TCGA-AA-A02J-01 | Colorectum | colon adenocarcinoma | Female | >=65 | III/IV | Unknown | Unknown | PD | |
| ARV1 | SNV | Missense_Mutation | novel | c.803C>T | p.Ser268Phe | p.S268F | Q9H2C2 | protein_coding | tolerated_low_confidence(0.06) | benign(0) | TCGA-AZ-4315-01 | Colorectum | colon adenocarcinoma | Male | <65 | I/II | Unknown | Unknown | SD |
| ARV1 | SNV | Missense_Mutation | novel | c.317N>G | p.Phe106Cys | p.F106C | Q9H2C2 | protein_coding | deleterious(0) | probably_damaging(0.999) | TCGA-EI-6917-01 | Colorectum | rectum adenocarcinoma | Male | <65 | III/IV | Chemotherapy | 5fluorouracil+oxaciplatina+l-folinian | SD |
| Page: 1 2 3 4 |
Top |
Related drugs of malignant transformation related genes |
| Identification of chemicals and drugs interact with genes involved in malignant transfromation |
| (DGIdb 4.0) |
| Entrez ID | Symbol | Category | Interaction Types | Drug Claim Name | Drug Name | PMIDs |
| Page: 1 |

Copyright 2023-Present -The University of Texas Health Science Center at Houston |