
|
|||||
|
 | |
| |
| |
| |
| |
| |
|
Gene: ARTN |
Gene summary for ARTN |
| Gene information | Species | Human | Gene symbol | ARTN | Gene ID | 9048 |
| Gene name | artemin | |
| Gene Alias | ART | |
| Cytomap | 1p34.1 | |
| Gene Type | protein-coding | GO ID | GO:0000902 | UniProtAcc | Q5T4W7 |
Top |
Malignant transformation analysis |
| Identification of the aberrant gene expression in precancerous and cancerous lesions by comparing the gene expression of stem-like cells in diseased tissues with normal stem cells |
| Entrez ID | Symbol | Replicates | Species | Organ | Tissue | Adj P-value | Log2FC | Malignancy |
| 9048 | ARTN | C04 | Human | Oral cavity | OSCC | 7.87e-06 | 4.67e-01 | 0.2633 |
| 9048 | ARTN | C21 | Human | Oral cavity | OSCC | 2.73e-05 | 3.53e-01 | 0.2678 |
| 9048 | ARTN | C30 | Human | Oral cavity | OSCC | 3.86e-08 | 6.26e-01 | 0.3055 |
| 9048 | ARTN | SYSMH1 | Human | Oral cavity | OSCC | 3.36e-36 | 7.91e-01 | 0.1127 |
| 9048 | ARTN | SYSMH3 | Human | Oral cavity | OSCC | 1.66e-16 | 4.34e-01 | 0.2442 |
| Page: 1 |
| Tissue | Expression Dynamics | Abbreviation |
| Oral Cavity | 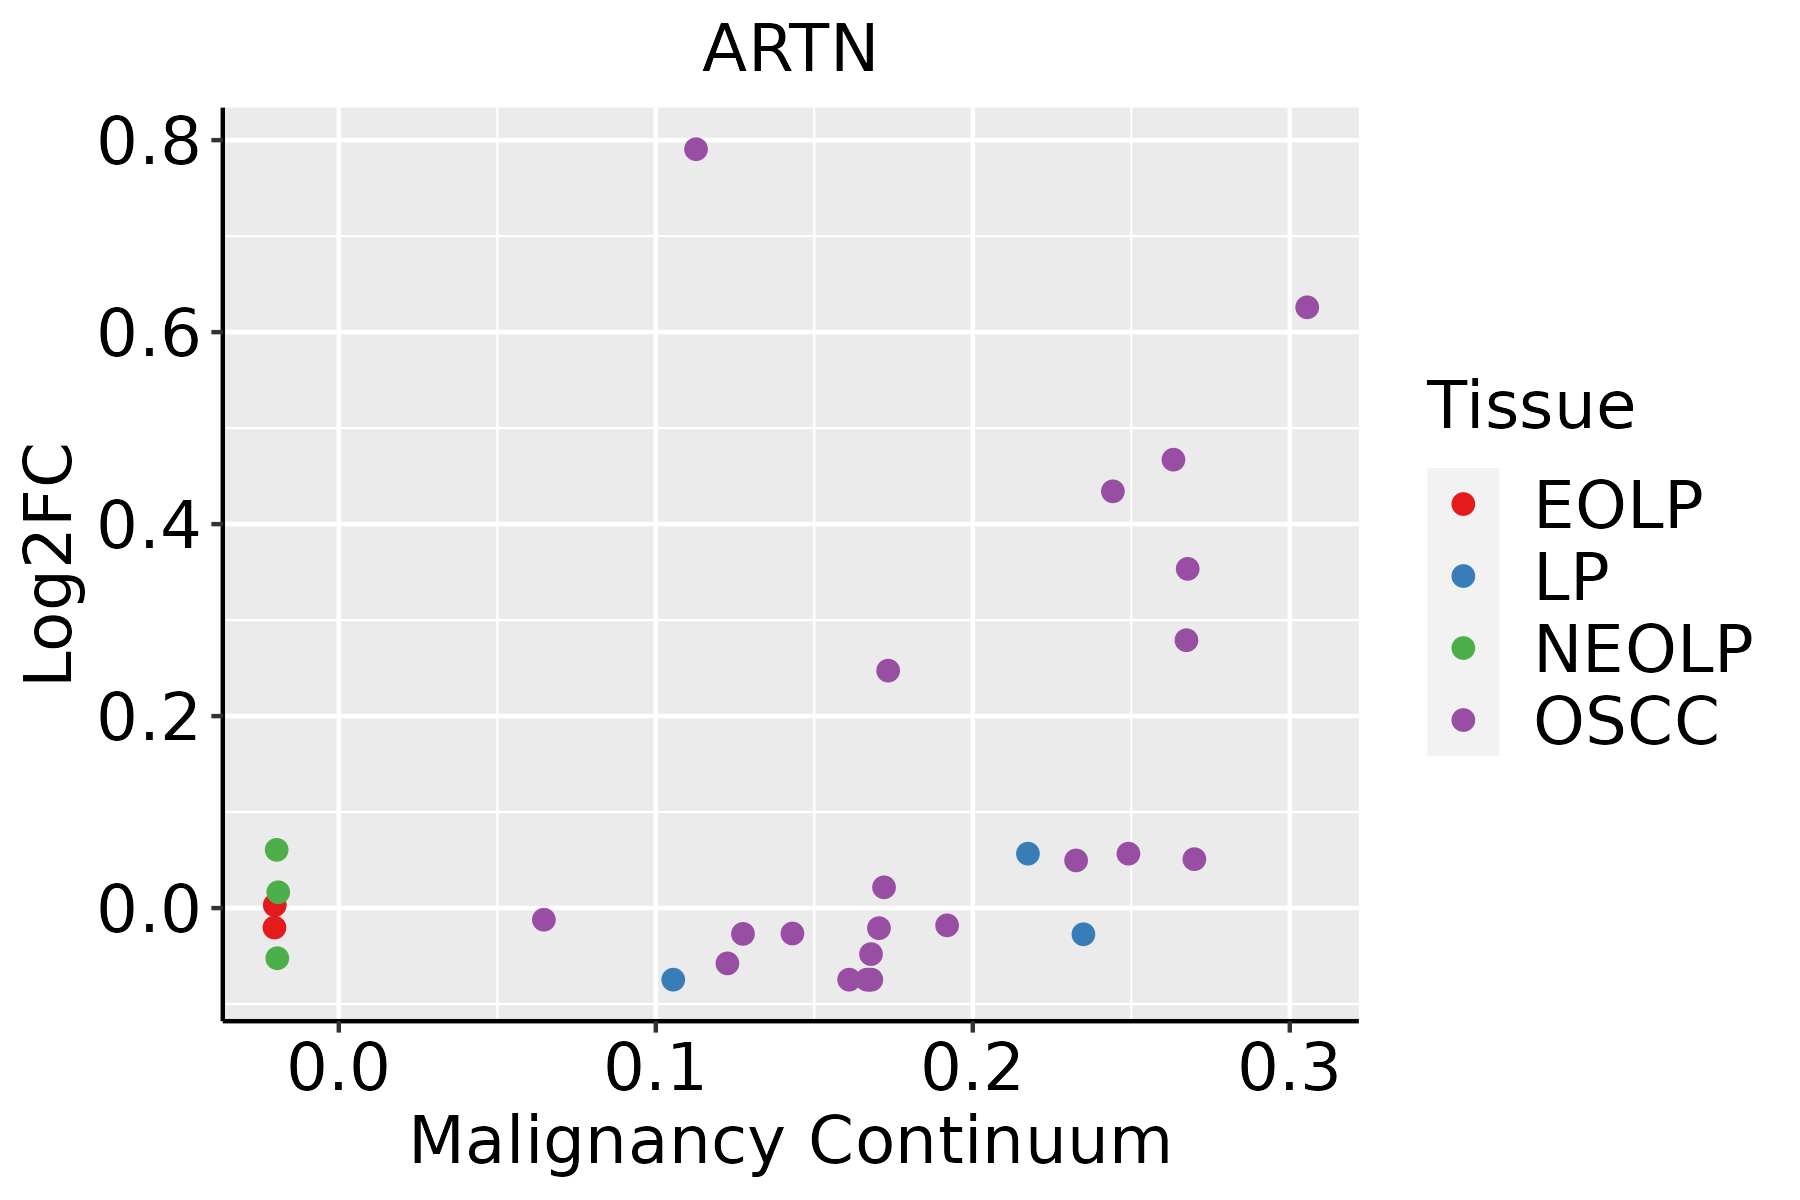 | EOLP: Erosive Oral lichen planus |
| LP: leukoplakia | ||
| NEOLP: Non-erosive oral lichen planus | ||
| OSCC: Oral squamous cell carcinoma |
| ∗log2FC in expression of this searched gene in stem-like cells from each diseased tissue sample relative to stem-like cells in normal samples in each tissue plotted against the malignancy continuum. Samples are colored based on if they are from different disease stage. |
Top |
Malignant transformation related pathway analysis |
| Find out the enriched GO biological processes and KEGG pathways involved in transition from healthy to precancer to cancer |
| Tissue | Disease Stage | Enriched GO biological Processes |
| Colorectum | AD |  |
| Colorectum | SER |  |
| Colorectum | MSS |  |
| Colorectum | MSI-H |  |
| Colorectum | FAP |  |
| ∗Top 15 enriched GO BP terms are showed in the bar plot of each disease state in each tissue. Each row represents a significant GO biological process which is colored according to the -log10(p.adjust). |
| Page: 1 2 3 4 5 6 7 8 9 |
| GO ID | Tissue | Disease Stage | Description | Gene Ratio | Bg Ratio | pvalue | p.adjust | Count |
| GO:00321037 | Oral cavity | OSCC | positive regulation of response to external stimulus | 203/7305 | 427/18723 | 1.79e-04 | 1.22e-03 | 203 |
| GO:00509216 | Oral cavity | OSCC | positive regulation of chemotaxis | 76/7305 | 141/18723 | 2.30e-04 | 1.49e-03 | 76 |
| GO:005090010 | Oral cavity | OSCC | leukocyte migration | 176/7305 | 369/18723 | 3.80e-04 | 2.31e-03 | 176 |
| GO:00509204 | Oral cavity | OSCC | regulation of chemotaxis | 105/7305 | 223/18723 | 8.27e-03 | 3.01e-02 | 105 |
| GO:006156410 | Oral cavity | OSCC | axon development | 207/7305 | 467/18723 | 1.01e-02 | 3.51e-02 | 207 |
| Page: 1 |
| Pathway ID | Tissue | Disease Stage | Description | Gene Ratio | Bg Ratio | pvalue | p.adjust | qvalue | Count |
| hsa0401014 | Oral cavity | OSCC | MAPK signaling pathway | 165/3704 | 302/8465 | 7.11e-05 | 2.74e-04 | 1.40e-04 | 165 |
| hsa0401015 | Oral cavity | OSCC | MAPK signaling pathway | 165/3704 | 302/8465 | 7.11e-05 | 2.74e-04 | 1.40e-04 | 165 |
| Page: 1 |
Top |
Cell-cell communication analysis |
| Identification of potential cell-cell interactions between two cell types and their ligand-receptor pairs for different disease states |
| Ligand | Receptor | LRpair | Pathway | Tissue | Disease Stage |
| Page: 1 |
Top |
Single-cell gene regulatory network inference analysis |
| Find out the significant the regulons (TFs) and the target genes of each regulon across cell types for different disease states |
| TF | Cell Type | Tissue | Disease Stage | Target Gene | RSS | Regulon Activity |
| ∗The dot plots of a searched regulon are shown for all cell subpopulations in each disease state of each tissue based on the regulon specific score inferred using pySCENIC and by calculating the average expression. |
| Page: 1 |
Top |
Somatic mutation of malignant transformation related genes |
| Annotation of somatic variants for genes involved in malignant transformation |
| Hugo Symbol | Variant Class | Variant Classification | dbSNP RS | HGVSc | HGVSp | HGVSp Short | SWISSPROT | BIOTYPE | SIFT | PolyPhen | Tumor Sample Barcode | Tissue | Histology | Sex | Age | Stage | Therapy Types | Drugs | Outcome |
| ARTN | SNV | Missense_Mutation | novel | c.610G>A | p.Val204Ile | p.V204I | Q5T4W7 | protein_coding | deleterious(0.01) | benign(0.109) | TCGA-LL-A5YM-01 | Breast | breast invasive carcinoma | Female | >=65 | III/IV | Unspecific | letrozole | PD |
| ARTN | SNV | Missense_Mutation | c.592N>T | p.Pro198Ser | p.P198S | Q5T4W7 | protein_coding | deleterious(0) | probably_damaging(0.998) | TCGA-AZ-6598-01 | Colorectum | colon adenocarcinoma | Female | >=65 | I/II | Unknown | Unknown | SD | |
| ARTN | SNV | Missense_Mutation | novel | c.98C>A | p.Pro33His | p.P33H | Q5T4W7 | protein_coding | deleterious(0) | probably_damaging(0.988) | TCGA-B5-A1MX-01 | Endometrium | uterine corpus endometrioid carcinoma | Female | <65 | I/II | Hormone Therapy | megace | SD |
| ARTN | SNV | Missense_Mutation | novel | c.116C>T | p.Ala39Val | p.A39V | Q5T4W7 | protein_coding | tolerated(0.07) | benign(0.006) | TCGA-B5-A3FC-01 | Endometrium | uterine corpus endometrioid carcinoma | Female | <65 | I/II | Unknown | Unknown | SD |
| ARTN | SNV | Missense_Mutation | novel | c.44C>A | p.Pro15His | p.P15H | Q5T4W7 | protein_coding | tolerated(0.26) | possibly_damaging(0.54) | TCGA-DF-A2KZ-01 | Endometrium | uterine corpus endometrioid carcinoma | Female | >=65 | I/II | Unknown | Unknown | SD |
| ARTN | SNV | Missense_Mutation | novel | c.136N>A | p.Glu46Lys | p.E46K | Q5T4W7 | protein_coding | tolerated(0.13) | possibly_damaging(0.87) | TCGA-DI-A1BU-01 | Endometrium | uterine corpus endometrioid carcinoma | Female | <65 | I/II | Chemotherapy | paclitaxel | SD |
| ARTN | SNV | Missense_Mutation | novel | c.487N>G | p.Arg163Gly | p.R163G | Q5T4W7 | protein_coding | deleterious(0.02) | possibly_damaging(0.551) | TCGA-DD-AAD2-01 | Liver | liver hepatocellular carcinoma | Male | >=65 | I/II | Unknown | Unknown | SD |
| Page: 1 |
Top |
Related drugs of malignant transformation related genes |
| Identification of chemicals and drugs interact with genes involved in malignant transfromation |
| (DGIdb 4.0) |
| Entrez ID | Symbol | Category | Interaction Types | Drug Claim Name | Drug Name | PMIDs |
| Page: 1 |

Copyright 2023-Present -The University of Texas Health Science Center at Houston |