
|
|||||
|
 | |
| |
| |
| |
| |
| |
|
Gene: ARSK |
Gene summary for ARSK |
| Gene information | Species | Human | Gene symbol | ARSK | Gene ID | 153642 |
| Gene name | arylsulfatase family member K | |
| Gene Alias | TSULF | |
| Cytomap | 5q15 | |
| Gene Type | protein-coding | GO ID | GO:0000323 | UniProtAcc | Q6UWY0 |
Top |
Malignant transformation analysis |
| Identification of the aberrant gene expression in precancerous and cancerous lesions by comparing the gene expression of stem-like cells in diseased tissues with normal stem cells |
| Entrez ID | Symbol | Replicates | Species | Organ | Tissue | Adj P-value | Log2FC | Malignancy |
| 153642 | ARSK | HCC1_Meng | Human | Liver | HCC | 1.75e-29 | -1.78e-05 | 0.0246 |
| 153642 | ARSK | HCC1 | Human | Liver | HCC | 1.42e-09 | 2.67e+00 | 0.5336 |
| 153642 | ARSK | HCC2 | Human | Liver | HCC | 1.03e-16 | 2.34e+00 | 0.5341 |
| 153642 | ARSK | HCC5 | Human | Liver | HCC | 4.51e-05 | 6.40e-01 | 0.4932 |
| 153642 | ARSK | S014 | Human | Liver | HCC | 2.71e-03 | 1.84e-01 | 0.2254 |
| 153642 | ARSK | S015 | Human | Liver | HCC | 1.87e-02 | 1.94e-01 | 0.2375 |
| 153642 | ARSK | S016 | Human | Liver | HCC | 1.24e-06 | 2.24e-01 | 0.2243 |
| Page: 1 |
| Tissue | Expression Dynamics | Abbreviation |
| Liver | 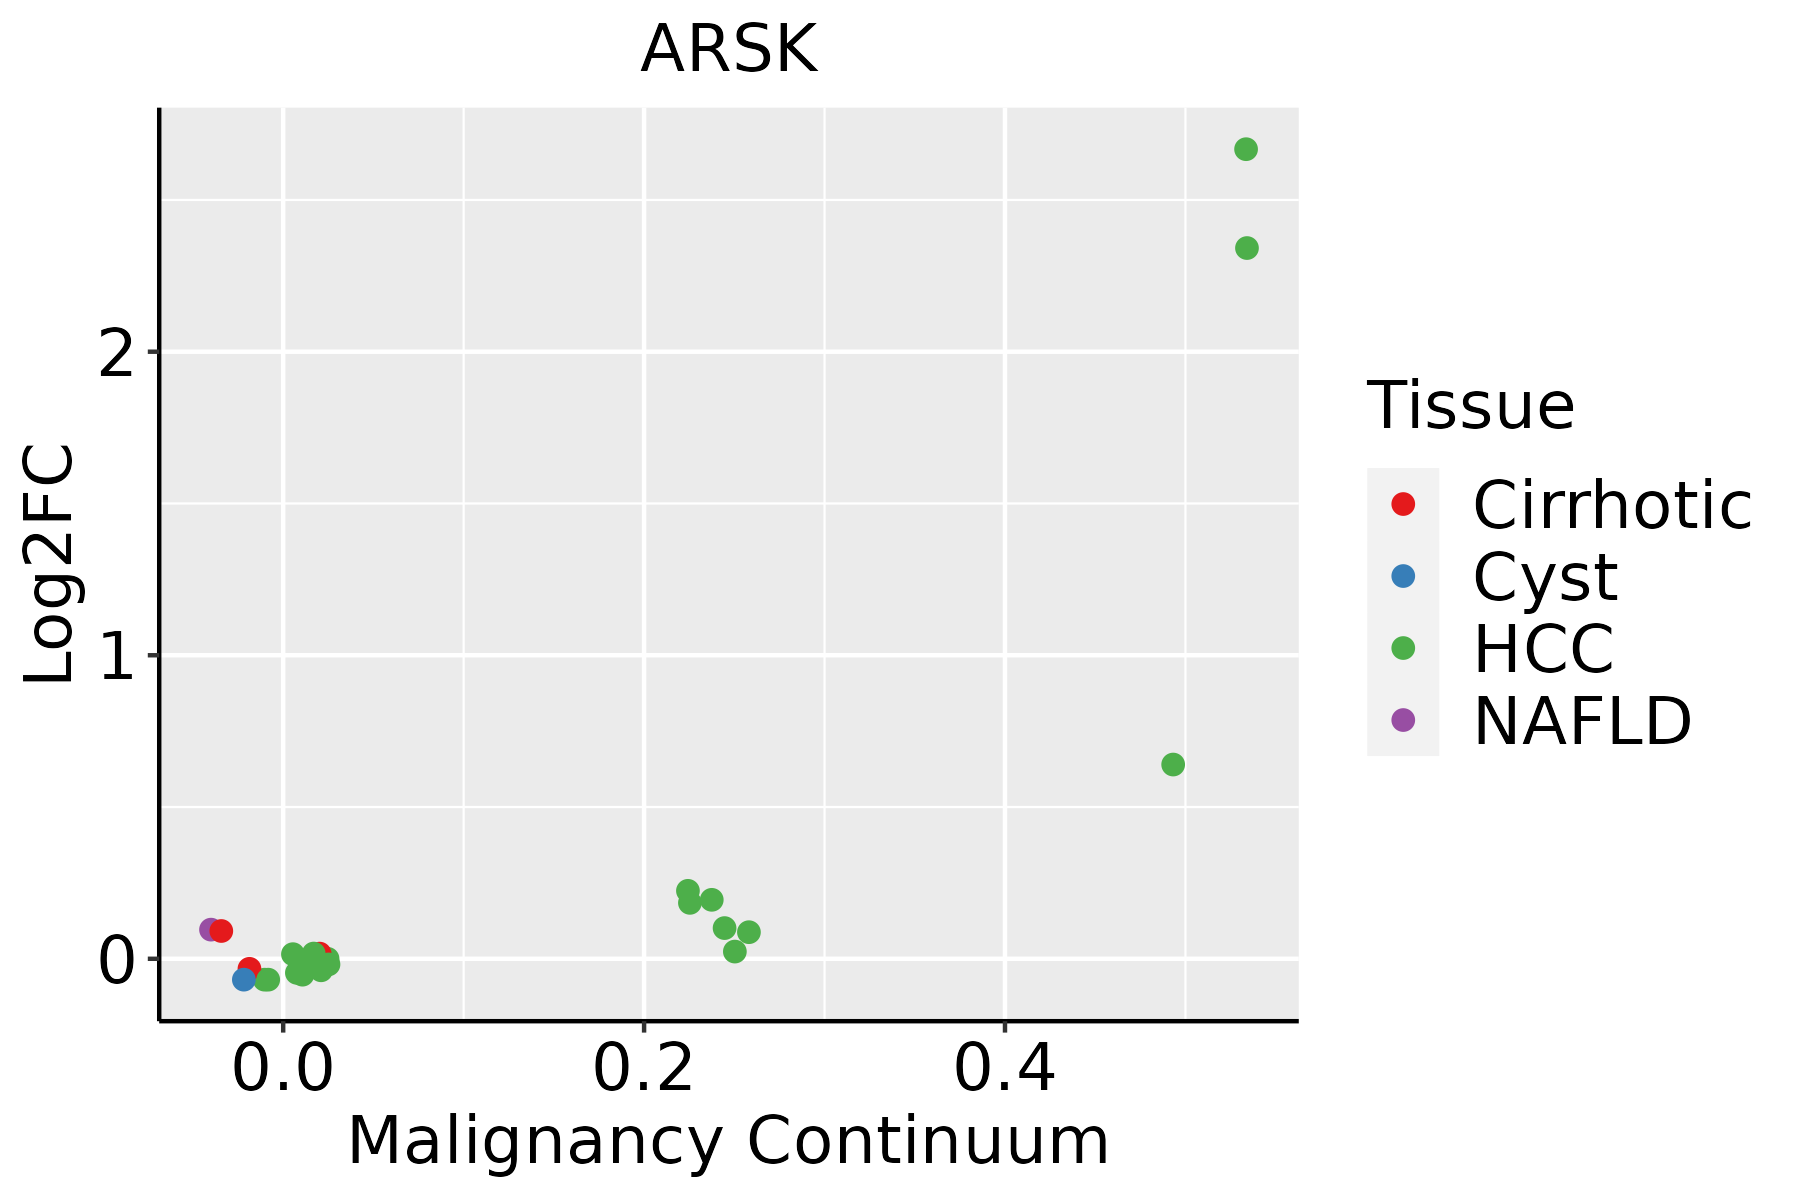 | HCC: Hepatocellular carcinoma |
| NAFLD: Non-alcoholic fatty liver disease |
| ∗log2FC in expression of this searched gene in stem-like cells from each diseased tissue sample relative to stem-like cells in normal samples in each tissue plotted against the malignancy continuum. Samples are colored based on if they are from different disease stage. |
Top |
Malignant transformation related pathway analysis |
| Find out the enriched GO biological processes and KEGG pathways involved in transition from healthy to precancer to cancer |
| Tissue | Disease Stage | Enriched GO biological Processes |
| Colorectum | AD |  |
| Colorectum | SER |  |
| Colorectum | MSS |  |
| Colorectum | MSI-H |  |
| Colorectum | FAP |  |
| ∗Top 15 enriched GO BP terms are showed in the bar plot of each disease state in each tissue. Each row represents a significant GO biological process which is colored according to the -log10(p.adjust). |
| Page: 1 2 3 4 5 6 7 8 9 |
| GO ID | Tissue | Disease Stage | Description | Gene Ratio | Bg Ratio | pvalue | p.adjust | Count |
| Page: 1 |
| Pathway ID | Tissue | Disease Stage | Description | Gene Ratio | Bg Ratio | pvalue | p.adjust | qvalue | Count |
| Page: 1 |
Top |
Cell-cell communication analysis |
| Identification of potential cell-cell interactions between two cell types and their ligand-receptor pairs for different disease states |
| Ligand | Receptor | LRpair | Pathway | Tissue | Disease Stage |
| Page: 1 |
Top |
Single-cell gene regulatory network inference analysis |
| Find out the significant the regulons (TFs) and the target genes of each regulon across cell types for different disease states |
| TF | Cell Type | Tissue | Disease Stage | Target Gene | RSS | Regulon Activity |
| ∗The dot plots of a searched regulon are shown for all cell subpopulations in each disease state of each tissue based on the regulon specific score inferred using pySCENIC and by calculating the average expression. |
| Page: 1 |
Top |
Somatic mutation of malignant transformation related genes |
| Annotation of somatic variants for genes involved in malignant transformation |
| Hugo Symbol | Variant Class | Variant Classification | dbSNP RS | HGVSc | HGVSp | HGVSp Short | SWISSPROT | BIOTYPE | SIFT | PolyPhen | Tumor Sample Barcode | Tissue | Histology | Sex | Age | Stage | Therapy Types | Drugs | Outcome |
| ARSK | SNV | Missense_Mutation | c.1597C>G | p.Pro533Ala | p.P533A | Q6UWY0 | protein_coding | tolerated_low_confidence(0.21) | benign(0) | TCGA-A2-A0D0-01 | Breast | breast invasive carcinoma | Female | <65 | I/II | Chemotherapy | cytoxan | SD | |
| ARSK | SNV | Missense_Mutation | rs368614197 | c.1504N>A | p.Val502Ile | p.V502I | Q6UWY0 | protein_coding | tolerated(0.06) | benign(0.165) | TCGA-AN-A046-01 | Breast | breast invasive carcinoma | Female | >=65 | I/II | Unknown | Unknown | SD |
| ARSK | SNV | Missense_Mutation | c.1020N>A | p.Met340Ile | p.M340I | Q6UWY0 | protein_coding | tolerated(0.89) | benign(0.001) | TCGA-D8-A1J8-01 | Breast | breast invasive carcinoma | Female | >=65 | I/II | Hormone Therapy | nolvadex | SD | |
| ARSK | SNV | Missense_Mutation | c.1159N>C | p.Glu387Gln | p.E387Q | Q6UWY0 | protein_coding | tolerated(0.27) | benign(0.021) | TCGA-D8-A1JN-01 | Breast | breast invasive carcinoma | Female | >=65 | III/IV | Hormone Therapy | anastrozolum | SD | |
| ARSK | SNV | Missense_Mutation | rs761190693 | c.1019N>C | p.Met340Thr | p.M340T | Q6UWY0 | protein_coding | deleterious(0.01) | benign(0.079) | TCGA-E2-A14R-01 | Breast | breast invasive carcinoma | Female | <65 | I/II | Chemotherapy | doxorubicin | PD |
| ARSK | SNV | Missense_Mutation | rs375563497 | c.991N>A | p.Glu331Lys | p.E331K | Q6UWY0 | protein_coding | deleterious(0) | probably_damaging(0.998) | TCGA-E2-A1L6-01 | Breast | breast invasive carcinoma | Female | <65 | I/II | Chemotherapy | cyclophosphamide | SD |
| ARSK | deletion | Frame_Shift_Del | c.813_828delAATTAAGAATATTAGA | p.Ile272HisfsTer24 | p.I272Hfs*24 | Q6UWY0 | protein_coding | TCGA-D8-A1Y0-01 | Breast | breast invasive carcinoma | Female | >=65 | III/IV | Chemotherapy | cyclophosphamide+methotrexatum+fluorouracillum | SD | |||
| ARSK | SNV | Missense_Mutation | novel | c.512N>C | p.Arg171Thr | p.R171T | Q6UWY0 | protein_coding | deleterious(0.01) | probably_damaging(0.983) | TCGA-EA-A3HU-01 | Cervix | cervical & endocervical cancer | Female | <65 | I/II | Unknown | Unknown | SD |
| ARSK | SNV | Missense_Mutation | rs761684946 | c.709N>A | p.Asp237Asn | p.D237N | Q6UWY0 | protein_coding | tolerated(0.12) | benign(0.003) | TCGA-VS-A8EK-01 | Cervix | cervical & endocervical cancer | Female | >=65 | I/II | Chemotherapy | cisplatin | PD |
| ARSK | insertion | Nonsense_Mutation | novel | c.104_105insTGCTTGATA | p.Val35_Leu36insAlaTerTer | p.V35_L36insA** | Q6UWY0 | protein_coding | TCGA-DS-A1OC-01 | Cervix | cervical & endocervical cancer | Female | <65 | I/II | Chemotherapy | gemcitabine | SD |
| Page: 1 2 3 4 5 6 |
Top |
Related drugs of malignant transformation related genes |
| Identification of chemicals and drugs interact with genes involved in malignant transfromation |
| (DGIdb 4.0) |
| Entrez ID | Symbol | Category | Interaction Types | Drug Claim Name | Drug Name | PMIDs |
| Page: 1 |

Copyright 2023-Present -The University of Texas Health Science Center at Houston |