
|
|||||
|
 | |
| |
| |
| |
| |
| |
|
Gene: ARSJ |
Gene summary for ARSJ |
| Gene information | Species | Human | Gene symbol | ARSJ | Gene ID | 79642 |
| Gene name | arylsulfatase family member J | |
| Gene Alias | ASJ | |
| Cytomap | 4q26 | |
| Gene Type | protein-coding | GO ID | GO:0005575 | UniProtAcc | Q5FYB0 |
Top |
Malignant transformation analysis |
| Identification of the aberrant gene expression in precancerous and cancerous lesions by comparing the gene expression of stem-like cells in diseased tissues with normal stem cells |
| Entrez ID | Symbol | Replicates | Species | Organ | Tissue | Adj P-value | Log2FC | Malignancy |
| 79642 | ARSJ | LZE7T | Human | Esophagus | ESCC | 1.41e-06 | 1.63e-01 | 0.0667 |
| 79642 | ARSJ | LZE8T | Human | Esophagus | ESCC | 2.36e-05 | 1.40e-01 | 0.067 |
| 79642 | ARSJ | LZE24T | Human | Esophagus | ESCC | 3.23e-03 | 6.71e-02 | 0.0596 |
| 79642 | ARSJ | P2T-E | Human | Esophagus | ESCC | 1.37e-30 | 5.84e-01 | 0.1177 |
| 79642 | ARSJ | P4T-E | Human | Esophagus | ESCC | 8.06e-10 | 4.71e-01 | 0.1323 |
| 79642 | ARSJ | P5T-E | Human | Esophagus | ESCC | 2.31e-10 | 2.39e-01 | 0.1327 |
| 79642 | ARSJ | P8T-E | Human | Esophagus | ESCC | 1.22e-16 | 4.11e-01 | 0.0889 |
| 79642 | ARSJ | P9T-E | Human | Esophagus | ESCC | 6.90e-07 | 1.18e-01 | 0.1131 |
| 79642 | ARSJ | P10T-E | Human | Esophagus | ESCC | 1.42e-05 | 1.34e-01 | 0.116 |
| 79642 | ARSJ | P12T-E | Human | Esophagus | ESCC | 2.28e-49 | 1.15e+00 | 0.1122 |
| 79642 | ARSJ | P15T-E | Human | Esophagus | ESCC | 1.89e-15 | 5.30e-01 | 0.1149 |
| 79642 | ARSJ | P16T-E | Human | Esophagus | ESCC | 3.52e-28 | 6.36e-01 | 0.1153 |
| 79642 | ARSJ | P21T-E | Human | Esophagus | ESCC | 2.18e-12 | 3.32e-01 | 0.1617 |
| 79642 | ARSJ | P23T-E | Human | Esophagus | ESCC | 6.71e-04 | 2.65e-01 | 0.108 |
| 79642 | ARSJ | P24T-E | Human | Esophagus | ESCC | 5.79e-12 | 1.45e-01 | 0.1287 |
| 79642 | ARSJ | P26T-E | Human | Esophagus | ESCC | 2.82e-52 | 1.13e+00 | 0.1276 |
| 79642 | ARSJ | P27T-E | Human | Esophagus | ESCC | 1.05e-14 | 4.32e-01 | 0.1055 |
| 79642 | ARSJ | P28T-E | Human | Esophagus | ESCC | 4.27e-03 | -7.65e-03 | 0.1149 |
| 79642 | ARSJ | P31T-E | Human | Esophagus | ESCC | 7.20e-26 | 7.16e-01 | 0.1251 |
| 79642 | ARSJ | P32T-E | Human | Esophagus | ESCC | 5.07e-36 | 7.24e-01 | 0.1666 |
| Page: 1 2 3 4 |
| Tissue | Expression Dynamics | Abbreviation |
| Esophagus | 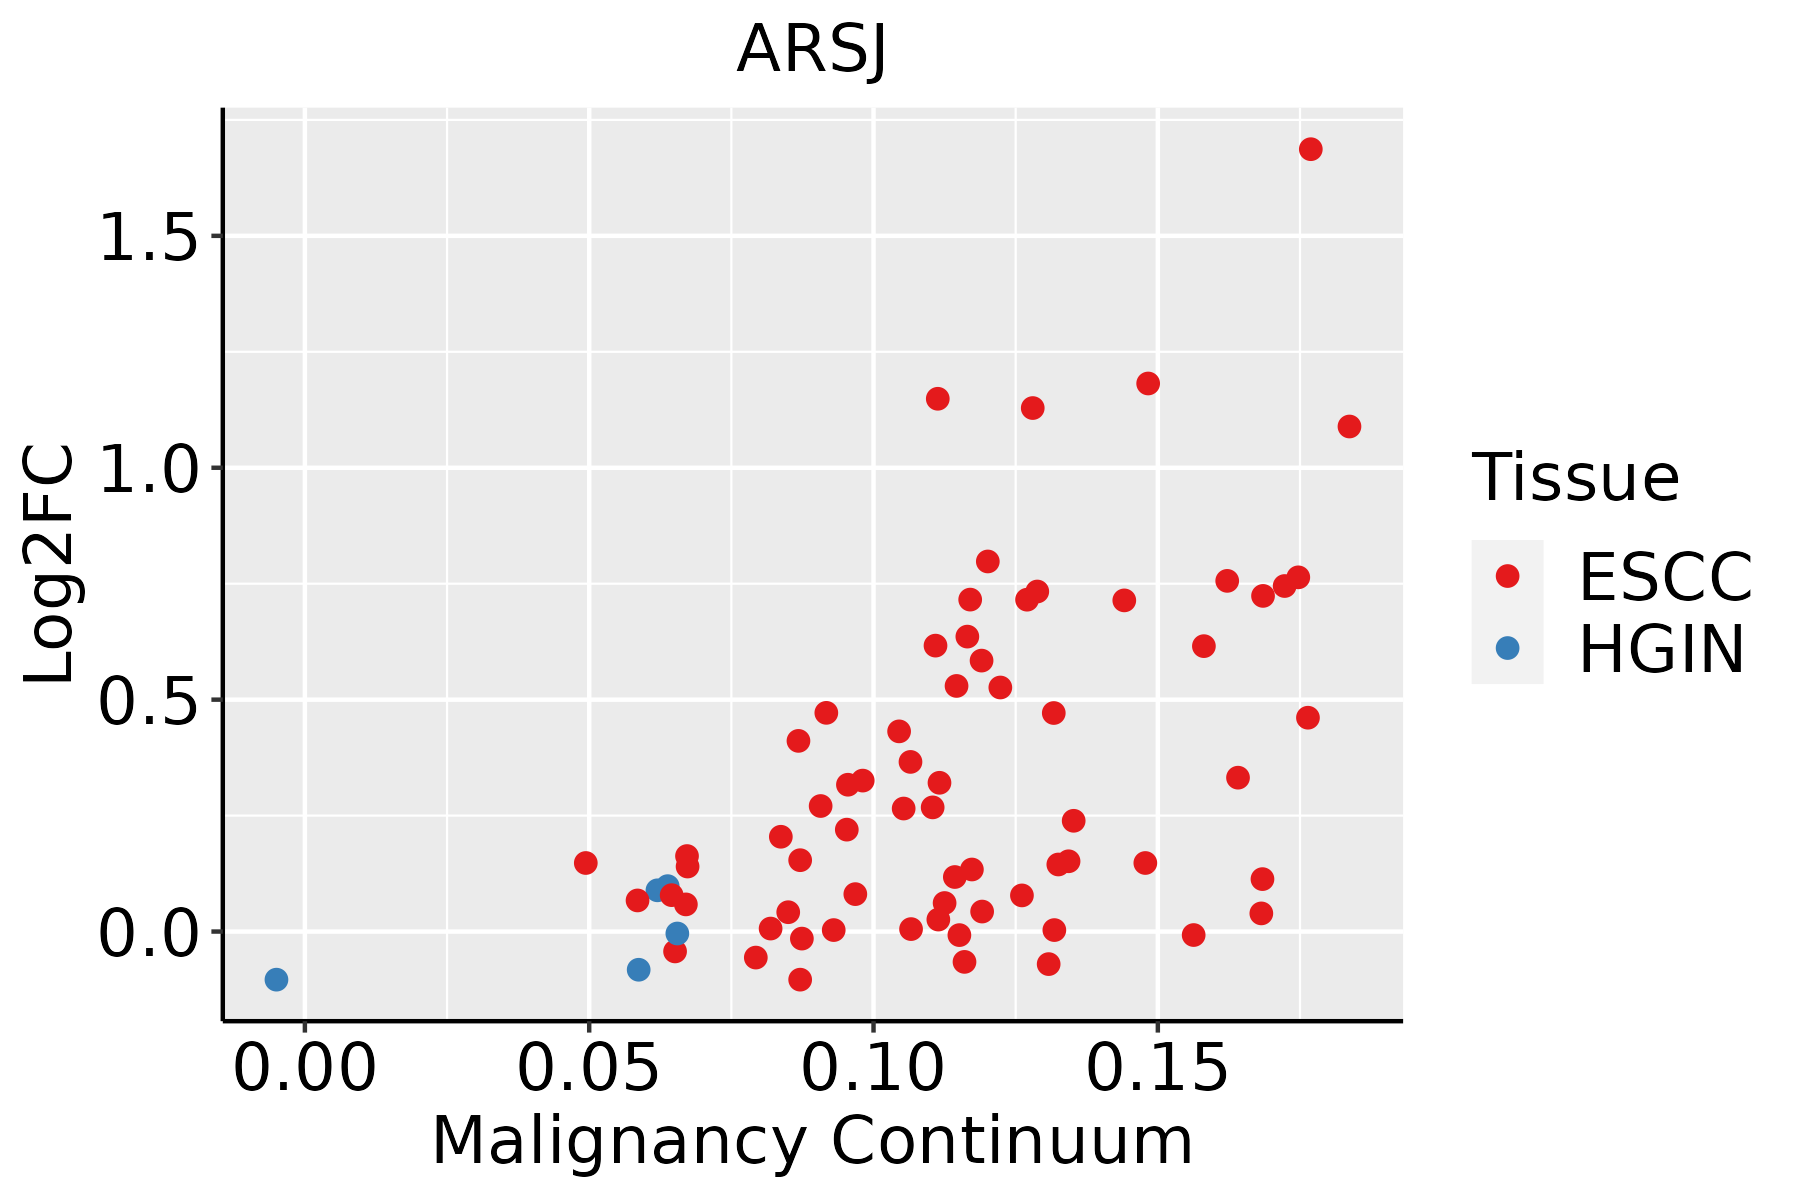 | ESCC: Esophageal squamous cell carcinoma |
| HGIN: High-grade intraepithelial neoplasias | ||
| LGIN: Low-grade intraepithelial neoplasias | ||
| Liver | 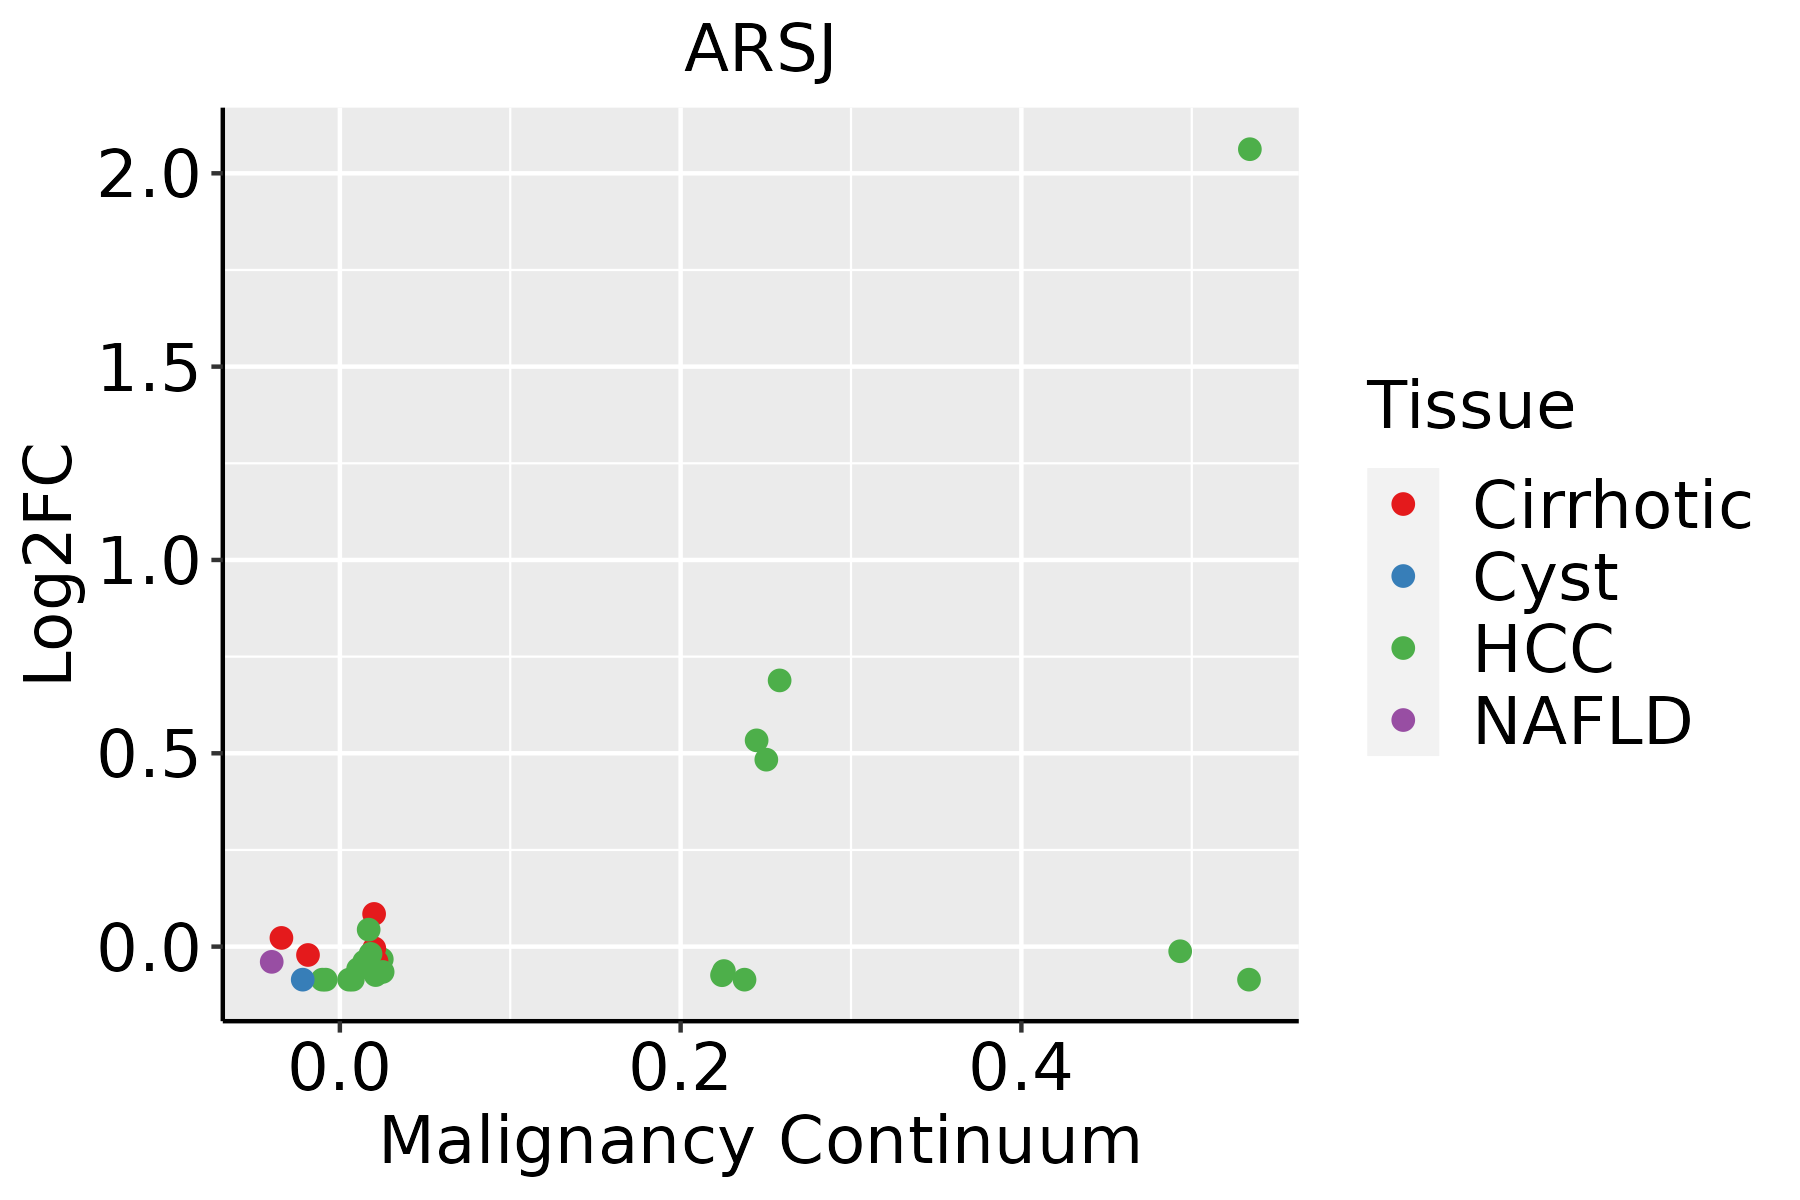 | HCC: Hepatocellular carcinoma |
| NAFLD: Non-alcoholic fatty liver disease | ||
| Oral Cavity | 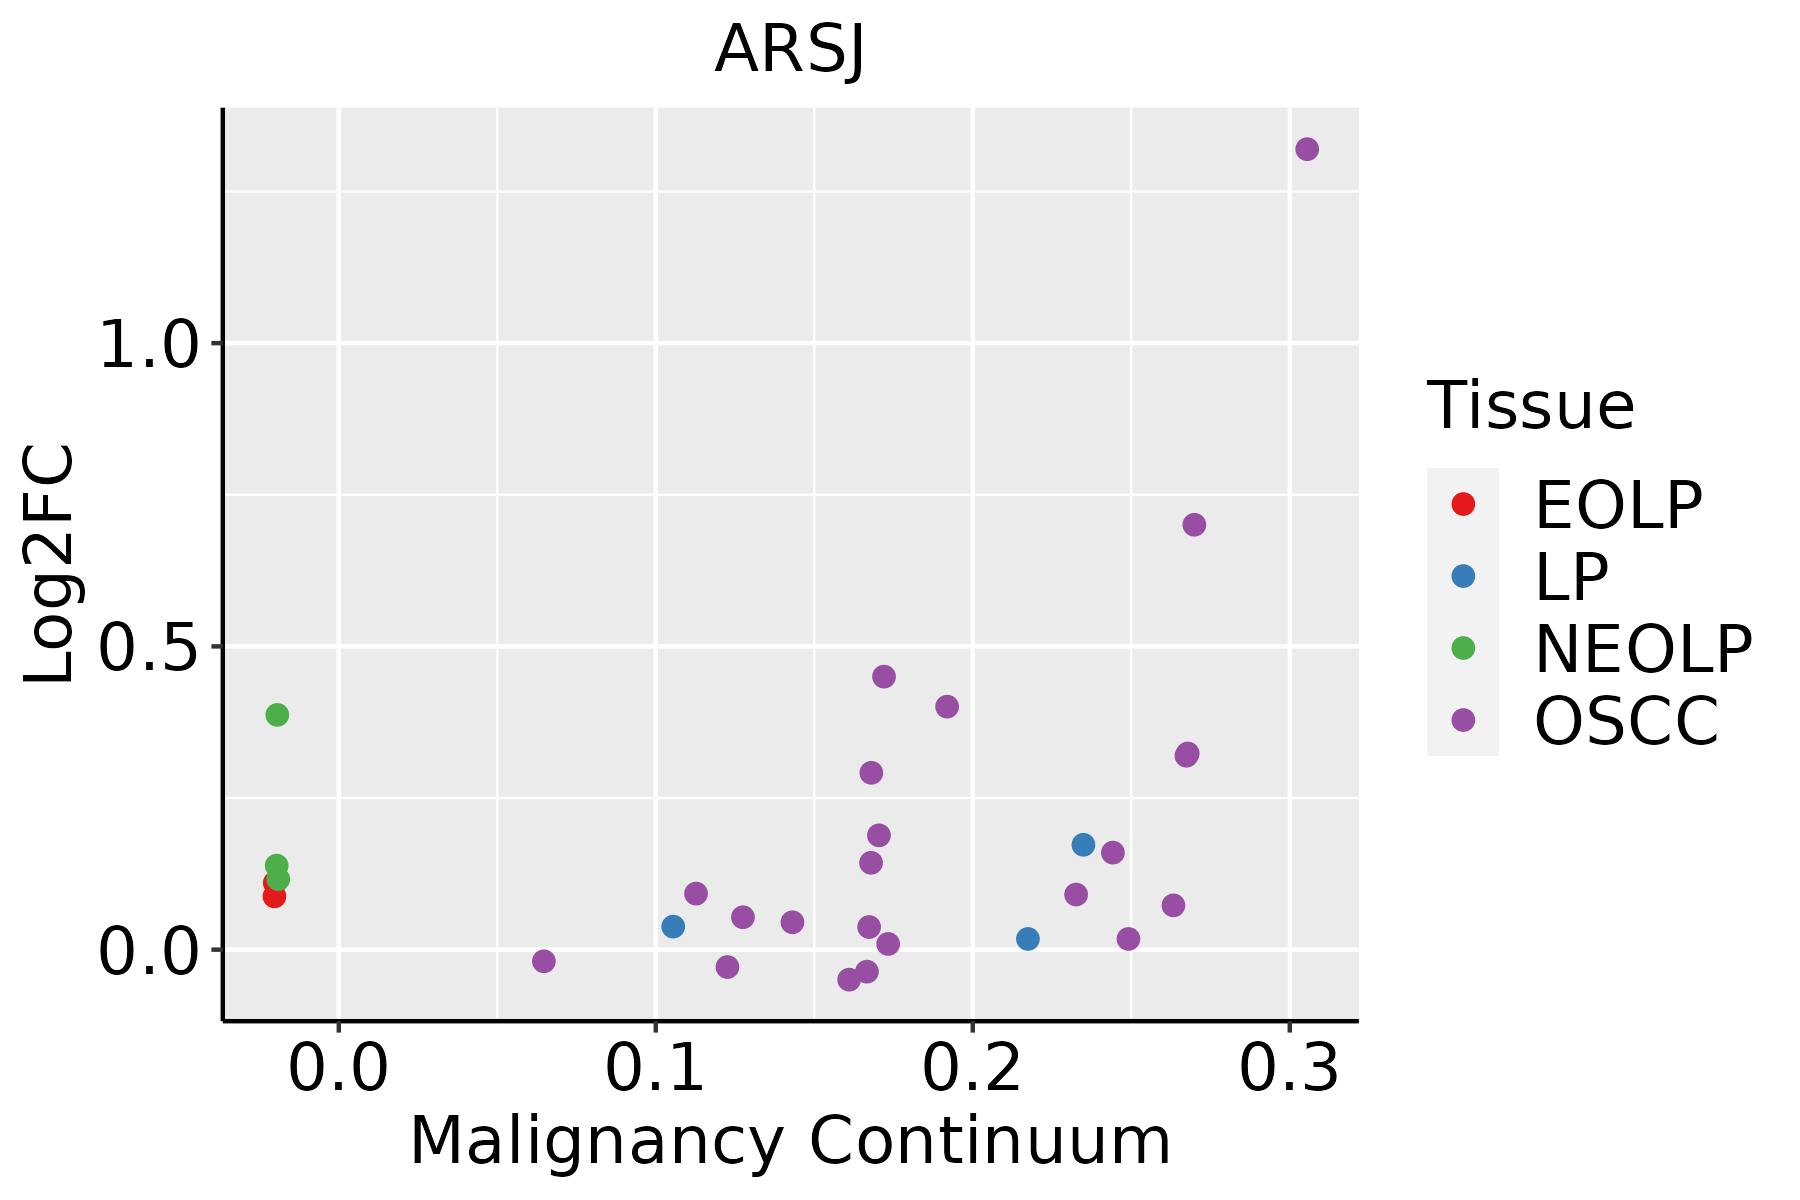 | EOLP: Erosive Oral lichen planus |
| LP: leukoplakia | ||
| NEOLP: Non-erosive oral lichen planus | ||
| OSCC: Oral squamous cell carcinoma | ||
| Prostate |  | BPH: Benign Prostatic Hyperplasia |
| ∗log2FC in expression of this searched gene in stem-like cells from each diseased tissue sample relative to stem-like cells in normal samples in each tissue plotted against the malignancy continuum. Samples are colored based on if they are from different disease stage. |
Top |
Malignant transformation related pathway analysis |
| Find out the enriched GO biological processes and KEGG pathways involved in transition from healthy to precancer to cancer |
| Tissue | Disease Stage | Enriched GO biological Processes |
| Colorectum | AD |  |
| Colorectum | SER |  |
| Colorectum | MSS |  |
| Colorectum | MSI-H |  |
| Colorectum | FAP |  |
| ∗Top 15 enriched GO BP terms are showed in the bar plot of each disease state in each tissue. Each row represents a significant GO biological process which is colored according to the -log10(p.adjust). |
| Page: 1 2 3 4 5 6 7 8 9 |
| GO ID | Tissue | Disease Stage | Description | Gene Ratio | Bg Ratio | pvalue | p.adjust | Count |
| Page: 1 |
| Pathway ID | Tissue | Disease Stage | Description | Gene Ratio | Bg Ratio | pvalue | p.adjust | qvalue | Count |
| Page: 1 |
Top |
Cell-cell communication analysis |
| Identification of potential cell-cell interactions between two cell types and their ligand-receptor pairs for different disease states |
| Ligand | Receptor | LRpair | Pathway | Tissue | Disease Stage |
| Page: 1 |
Top |
Single-cell gene regulatory network inference analysis |
| Find out the significant the regulons (TFs) and the target genes of each regulon across cell types for different disease states |
| TF | Cell Type | Tissue | Disease Stage | Target Gene | RSS | Regulon Activity |
| ∗The dot plots of a searched regulon are shown for all cell subpopulations in each disease state of each tissue based on the regulon specific score inferred using pySCENIC and by calculating the average expression. |
| Page: 1 |
Top |
Somatic mutation of malignant transformation related genes |
| Annotation of somatic variants for genes involved in malignant transformation |
| Hugo Symbol | Variant Class | Variant Classification | dbSNP RS | HGVSc | HGVSp | HGVSp Short | SWISSPROT | BIOTYPE | SIFT | PolyPhen | Tumor Sample Barcode | Tissue | Histology | Sex | Age | Stage | Therapy Types | Drugs | Outcome |
| ARSJ | SNV | Missense_Mutation | novel | c.1382C>T | p.Pro461Leu | p.P461L | Q5FYB0 | protein_coding | deleterious(0.01) | probably_damaging(0.949) | TCGA-AN-A046-01 | Breast | breast invasive carcinoma | Female | >=65 | I/II | Unknown | Unknown | SD |
| ARSJ | SNV | Missense_Mutation | novel | c.569G>T | p.Arg190Ile | p.R190I | Q5FYB0 | protein_coding | deleterious(0.01) | possibly_damaging(0.637) | TCGA-AN-A046-01 | Breast | breast invasive carcinoma | Female | >=65 | I/II | Unknown | Unknown | SD |
| ARSJ | insertion | In_Frame_Ins | novel | c.936_937insCTCCTACGGAGG | p.Lys312_Thr313insLeuLeuArgArg | p.K312_T313insLLRR | Q5FYB0 | protein_coding | TCGA-A7-A0CJ-01 | Breast | breast invasive carcinoma | Female | <65 | I/II | Chemotherapy | cytoxan | SD | ||
| ARSJ | insertion | Frame_Shift_Ins | novel | c.211_212insAAATTTTTTTTACTCTTGGTGCATTCTTAAAT | p.Thr71LysfsTer23 | p.T71Kfs*23 | Q5FYB0 | protein_coding | TCGA-AN-A0FX-01 | Breast | breast invasive carcinoma | Female | <65 | I/II | Unknown | Unknown | SD | ||
| ARSJ | insertion | Nonsense_Mutation | novel | c.698_699insTCAAAAGTATTTACAGTAGAA | p.Asp233_Asn234insGlnLysTyrLeuGlnTerAsn | p.D233_N234insQKYLQ*N | Q5FYB0 | protein_coding | TCGA-AQ-A54N-01 | Breast | breast invasive carcinoma | Female | <65 | I/II | Unknown | Unknown | SD | ||
| ARSJ | SNV | Missense_Mutation | novel | c.574G>A | p.Gly192Arg | p.G192R | Q5FYB0 | protein_coding | deleterious(0) | probably_damaging(1) | TCGA-2W-A8YY-01 | Cervix | cervical & endocervical cancer | Female | <65 | I/II | Chemotherapy | cisplatin | CR |
| ARSJ | SNV | Missense_Mutation | c.1708N>C | p.Glu570Gln | p.E570Q | Q5FYB0 | protein_coding | tolerated_low_confidence(0.41) | benign(0) | TCGA-EX-A3L1-01 | Cervix | cervical & endocervical cancer | Female | <65 | I/II | Chemotherapy | cisplatin | CR | |
| ARSJ | SNV | Missense_Mutation | rs756542116 | c.523N>A | p.Gly175Arg | p.G175R | Q5FYB0 | protein_coding | deleterious(0) | probably_damaging(0.991) | TCGA-AA-3977-01 | Colorectum | colon adenocarcinoma | Male | >=65 | I/II | Unknown | Unknown | SD |
| ARSJ | SNV | Missense_Mutation | novel | c.1318N>G | p.Ile440Val | p.I440V | Q5FYB0 | protein_coding | tolerated(0.28) | benign(0.163) | TCGA-AA-A01R-01 | Colorectum | colon adenocarcinoma | Male | <65 | III/IV | Chemotherapy | 5-fluorouracil | PD |
| ARSJ | SNV | Missense_Mutation | novel | c.1722N>T | p.Lys574Asn | p.K574N | Q5FYB0 | protein_coding | tolerated_low_confidence(0.42) | benign(0) | TCGA-CA-6717-01 | Colorectum | colon adenocarcinoma | Male | <65 | I/II | Chemotherapy | oxaliplatin | CR |
| Page: 1 2 3 4 5 6 7 8 9 10 11 12 |
Top |
Related drugs of malignant transformation related genes |
| Identification of chemicals and drugs interact with genes involved in malignant transfromation |
| (DGIdb 4.0) |
| Entrez ID | Symbol | Category | Interaction Types | Drug Claim Name | Drug Name | PMIDs |
| Page: 1 |

Copyright 2023-Present -The University of Texas Health Science Center at Houston |