
|
|||||
|
 | |
| |
| |
| |
| |
| |
|
Gene: ARSD |
Gene summary for ARSD |
| Gene information | Species | Human | Gene symbol | ARSD | Gene ID | 414 |
| Gene name | arylsulfatase D | |
| Gene Alias | ASD | |
| Cytomap | Xp22.33 | |
| Gene Type | protein-coding | GO ID | GO:0000323 | UniProtAcc | A0A140VK06 |
Top |
Malignant transformation analysis |
| Identification of the aberrant gene expression in precancerous and cancerous lesions by comparing the gene expression of stem-like cells in diseased tissues with normal stem cells |
| Entrez ID | Symbol | Replicates | Species | Organ | Tissue | Adj P-value | Log2FC | Malignancy |
| 414 | ARSD | HTA11_2487_2000001011 | Human | Colorectum | SER | 1.03e-05 | 3.72e-01 | -0.1808 |
| 414 | ARSD | HTA11_1938_2000001011 | Human | Colorectum | AD | 3.58e-20 | 8.24e-01 | -0.0811 |
| 414 | ARSD | HTA11_347_2000001011 | Human | Colorectum | AD | 4.38e-40 | 9.33e-01 | -0.1954 |
| 414 | ARSD | HTA11_8622_2000001021 | Human | Colorectum | SER | 1.08e-11 | 8.18e-01 | 0.0528 |
| 414 | ARSD | HTA11_10711_2000001011 | Human | Colorectum | AD | 4.67e-13 | 6.78e-01 | 0.0338 |
| 414 | ARSD | HTA11_99999965104_69814 | Human | Colorectum | MSS | 4.40e-08 | 4.32e-01 | 0.281 |
| 414 | ARSD | A015-C-203 | Human | Colorectum | FAP | 4.93e-12 | 3.61e-01 | -0.1294 |
| 414 | ARSD | A002-C-201 | Human | Colorectum | FAP | 2.13e-02 | 1.19e-01 | 0.0324 |
| 414 | ARSD | A002-C-021 | Human | Colorectum | FAP | 3.14e-11 | 4.16e-01 | 0.1171 |
| 414 | ARSD | A002-C-205 | Human | Colorectum | FAP | 3.86e-07 | 1.93e-01 | -0.1236 |
| 414 | ARSD | A015-C-006 | Human | Colorectum | FAP | 7.75e-04 | 6.58e-02 | -0.0994 |
| 414 | ARSD | A002-C-114 | Human | Colorectum | FAP | 9.48e-05 | 1.83e-01 | -0.1561 |
| 414 | ARSD | A015-C-104 | Human | Colorectum | FAP | 2.00e-14 | 3.59e-01 | -0.1899 |
| 414 | ARSD | A015-C-202 | Human | Colorectum | FAP | 7.42e-08 | 4.03e-01 | -0.0849 |
| 414 | ARSD | A002-C-016 | Human | Colorectum | FAP | 4.65e-04 | 5.20e-02 | 0.0521 |
| 414 | ARSD | A015-C-002 | Human | Colorectum | FAP | 3.29e-02 | 1.21e-01 | -0.0763 |
| 414 | ARSD | A002-C-116 | Human | Colorectum | FAP | 8.46e-08 | 4.40e-02 | -0.0452 |
| 414 | ARSD | A018-E-020 | Human | Colorectum | FAP | 3.08e-02 | -3.75e-02 | -0.2034 |
| 414 | ARSD | F034 | Human | Colorectum | FAP | 1.62e-02 | 1.75e-01 | -0.0665 |
| 414 | ARSD | CRC-3-11773 | Human | Colorectum | CRC | 6.50e-04 | -2.19e-01 | 0.2564 |
| Page: 1 2 3 4 5 6 |
| Tissue | Expression Dynamics | Abbreviation |
| Colorectum (GSE201348) |  | FAP: Familial adenomatous polyposis |
| CRC: Colorectal cancer | ||
| Colorectum (HTA11) |  | AD: Adenomas |
| SER: Sessile serrated lesions | ||
| MSI-H: Microsatellite-high colorectal cancer | ||
| MSS: Microsatellite stable colorectal cancer | ||
| Esophagus | 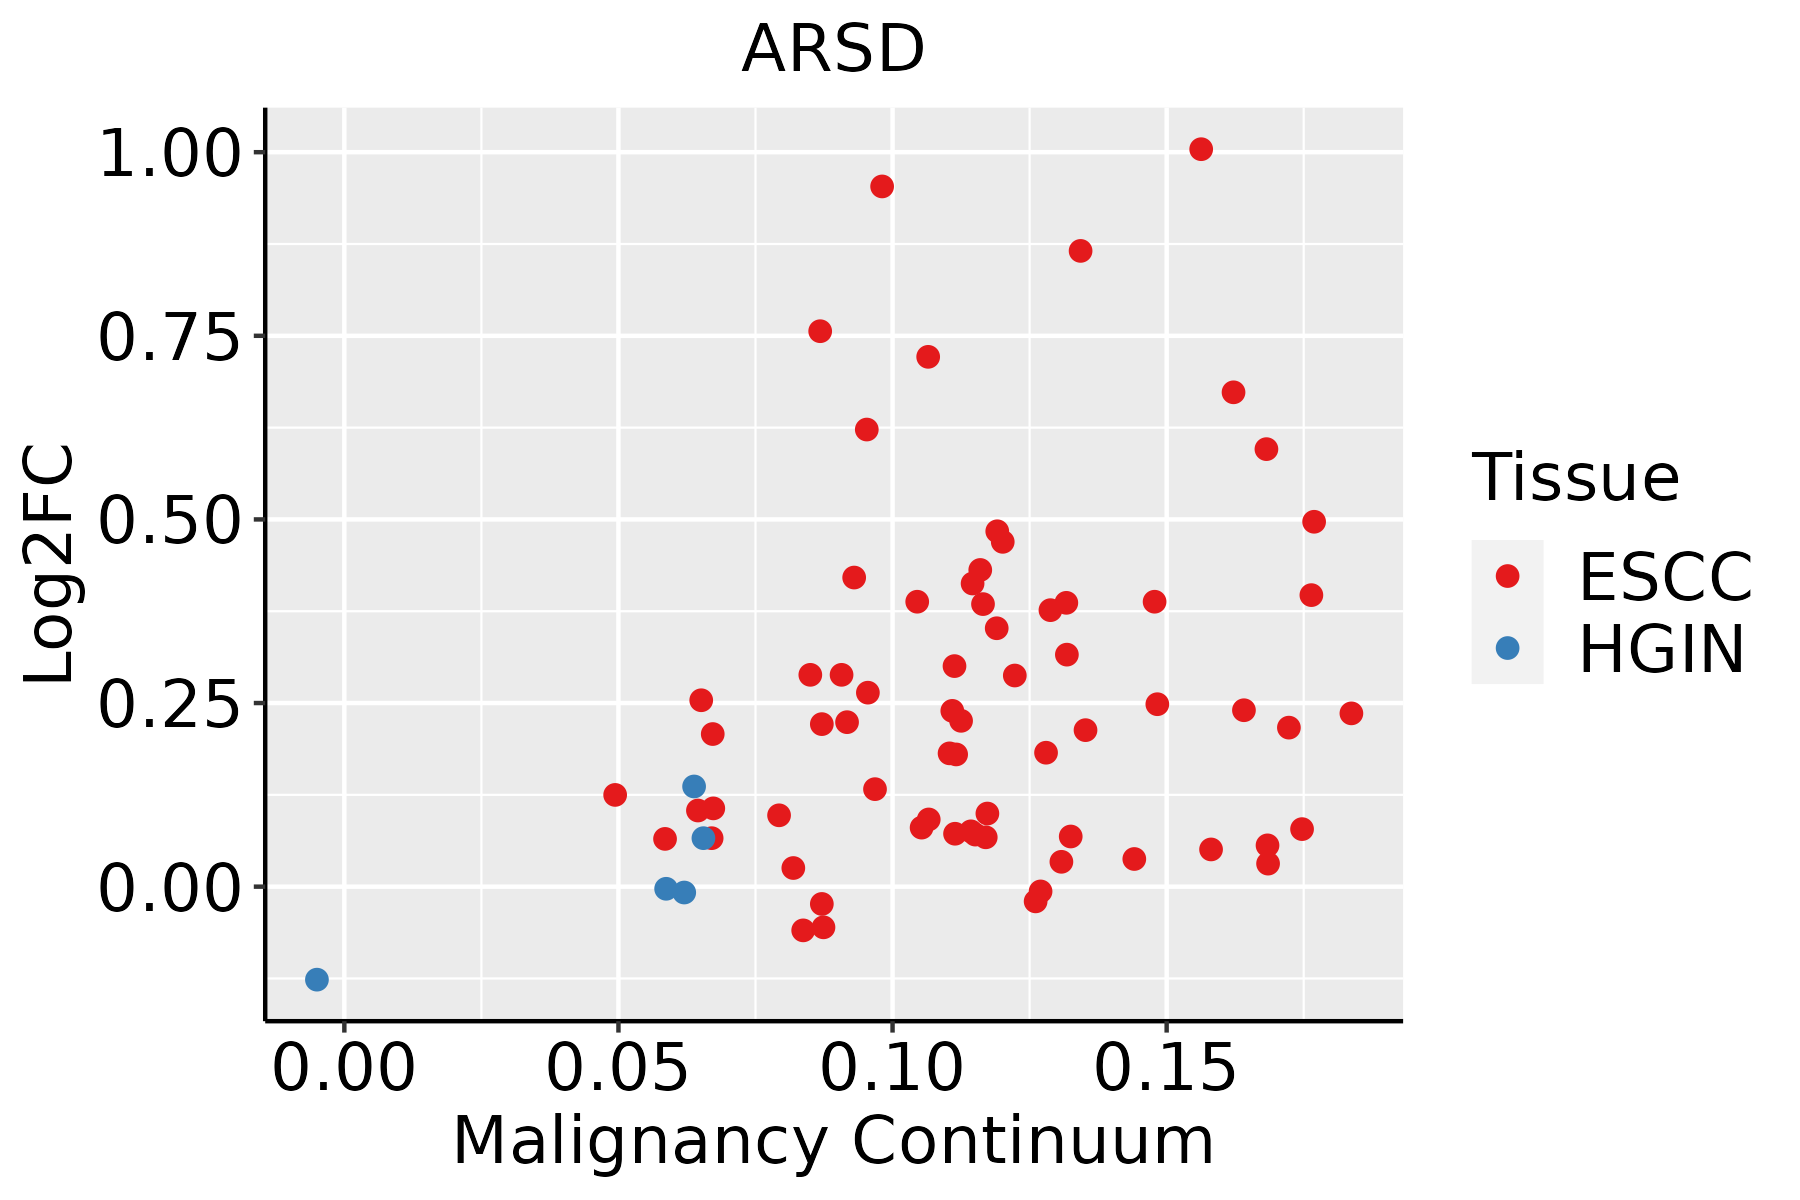 | ESCC: Esophageal squamous cell carcinoma |
| HGIN: High-grade intraepithelial neoplasias | ||
| LGIN: Low-grade intraepithelial neoplasias | ||
| Liver |  | HCC: Hepatocellular carcinoma |
| NAFLD: Non-alcoholic fatty liver disease | ||
| Oral Cavity |  | EOLP: Erosive Oral lichen planus |
| LP: leukoplakia | ||
| NEOLP: Non-erosive oral lichen planus | ||
| OSCC: Oral squamous cell carcinoma | ||
| Prostate |  | BPH: Benign Prostatic Hyperplasia |
| Thyroid | 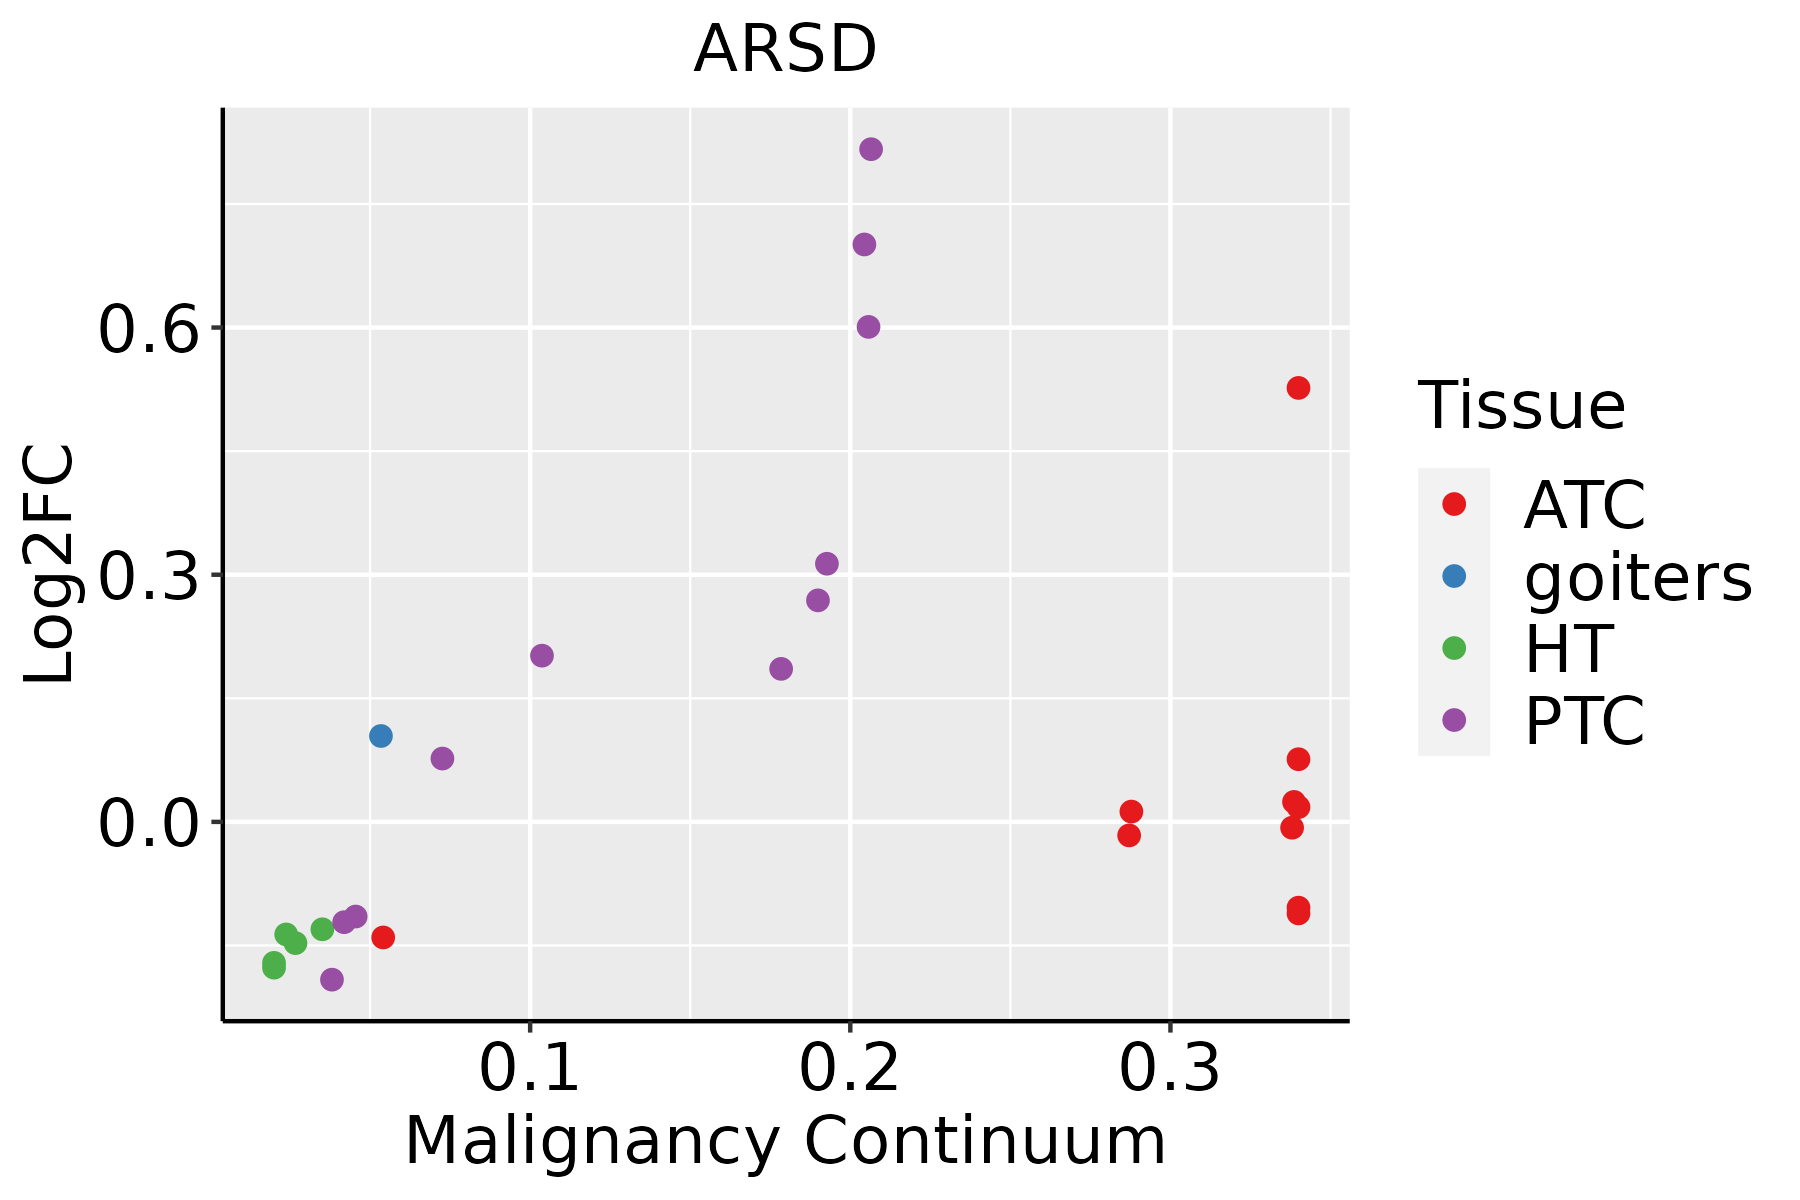 | ATC: Anaplastic thyroid cancer |
| HT: Hashimoto's thyroiditis | ||
| PTC: Papillary thyroid cancer |
| ∗log2FC in expression of this searched gene in stem-like cells from each diseased tissue sample relative to stem-like cells in normal samples in each tissue plotted against the malignancy continuum. Samples are colored based on if they are from different disease stage. |
Top |
Malignant transformation related pathway analysis |
| Find out the enriched GO biological processes and KEGG pathways involved in transition from healthy to precancer to cancer |
| Tissue | Disease Stage | Enriched GO biological Processes |
| Colorectum | AD |  |
| Colorectum | SER |  |
| Colorectum | MSS |  |
| Colorectum | MSI-H |  |
| Colorectum | FAP |  |
| ∗Top 15 enriched GO BP terms are showed in the bar plot of each disease state in each tissue. Each row represents a significant GO biological process which is colored according to the -log10(p.adjust). |
| Page: 1 2 3 4 5 6 7 8 9 |
| GO ID | Tissue | Disease Stage | Description | Gene Ratio | Bg Ratio | pvalue | p.adjust | Count |
| GO:0006418 | Colorectum | AD | tRNA aminoacylation for protein translation | 19/3918 | 41/18723 | 2.37e-04 | 3.03e-03 | 19 |
| GO:0043039 | Colorectum | AD | tRNA aminoacylation | 19/3918 | 44/18723 | 7.13e-04 | 7.21e-03 | 19 |
| GO:0043038 | Colorectum | AD | amino acid activation | 19/3918 | 45/18723 | 9.94e-04 | 9.28e-03 | 19 |
| GO:0006520 | Colorectum | AD | cellular amino acid metabolic process | 81/3918 | 284/18723 | 1.37e-03 | 1.19e-02 | 81 |
| GO:00064181 | Colorectum | SER | tRNA aminoacylation for protein translation | 17/2897 | 41/18723 | 5.75e-05 | 1.35e-03 | 17 |
| GO:00430391 | Colorectum | SER | tRNA aminoacylation | 17/2897 | 44/18723 | 1.64e-04 | 3.12e-03 | 17 |
| GO:00430381 | Colorectum | SER | amino acid activation | 17/2897 | 45/18723 | 2.25e-04 | 3.91e-03 | 17 |
| GO:00065201 | Colorectum | SER | cellular amino acid metabolic process | 61/2897 | 284/18723 | 4.20e-03 | 3.41e-02 | 61 |
| GO:0034660 | Colorectum | MSI-H | ncRNA metabolic process | 53/1319 | 485/18723 | 9.66e-04 | 1.68e-02 | 53 |
| GO:00346606 | Esophagus | HGIN | ncRNA metabolic process | 104/2587 | 485/18723 | 2.26e-06 | 8.23e-05 | 104 |
| GO:003466012 | Esophagus | ESCC | ncRNA metabolic process | 346/8552 | 485/18723 | 4.35e-31 | 2.51e-28 | 346 |
| GO:00063992 | Esophagus | ESCC | tRNA metabolic process | 122/8552 | 179/18723 | 9.03e-10 | 2.19e-08 | 122 |
| Page: 1 |
| Pathway ID | Tissue | Disease Stage | Description | Gene Ratio | Bg Ratio | pvalue | p.adjust | qvalue | Count |
| Page: 1 |
Top |
Cell-cell communication analysis |
| Identification of potential cell-cell interactions between two cell types and their ligand-receptor pairs for different disease states |
| Ligand | Receptor | LRpair | Pathway | Tissue | Disease Stage |
| Page: 1 |
Top |
Single-cell gene regulatory network inference analysis |
| Find out the significant the regulons (TFs) and the target genes of each regulon across cell types for different disease states |
| TF | Cell Type | Tissue | Disease Stage | Target Gene | RSS | Regulon Activity |
| ∗The dot plots of a searched regulon are shown for all cell subpopulations in each disease state of each tissue based on the regulon specific score inferred using pySCENIC and by calculating the average expression. |
| Page: 1 |
Top |
Somatic mutation of malignant transformation related genes |
| Annotation of somatic variants for genes involved in malignant transformation |
| Hugo Symbol | Variant Class | Variant Classification | dbSNP RS | HGVSc | HGVSp | HGVSp Short | SWISSPROT | BIOTYPE | SIFT | PolyPhen | Tumor Sample Barcode | Tissue | Histology | Sex | Age | Stage | Therapy Types | Drugs | Outcome |
| ARSD | insertion | Frame_Shift_Ins | novel | c.901_902insAAAATCAACCTTCTACACAGCCAGTGACTTCATGTCA | p.Leu301GlnfsTer36 | p.L301Qfs*36 | P51689 | protein_coding | TCGA-A8-A06X-01 | Breast | breast invasive carcinoma | Female | >=65 | I/II | Unknown | Unknown | SD | ||
| ARSD | insertion | In_Frame_Ins | novel | c.924_925insTCTCTACTAAAAATACAAAAACTAACCCGGTGTGGT | p.Val308_Thr309insSerLeuLeuLysIleGlnLysLeuThrArgCysGly | p.V308_T309insSLLKIQKLTRCG | P51689 | protein_coding | TCGA-AN-A0FX-01 | Breast | breast invasive carcinoma | Female | <65 | I/II | Unknown | Unknown | SD | ||
| ARSD | insertion | Frame_Shift_Ins | novel | c.145_146insG | p.Asp49GlyfsTer2 | p.D49Gfs*2 | P51689 | protein_coding | TCGA-OL-A5D7-01 | Breast | breast invasive carcinoma | Female | >=65 | I/II | Chemotherapy | cytoxan | CR | ||
| ARSD | SNV | Missense_Mutation | rs759669373 | c.325G>A | p.Ala109Thr | p.A109T | P51689 | protein_coding | tolerated(0.05) | benign(0.322) | TCGA-EA-A410-01 | Cervix | cervical & endocervical cancer | Female | <65 | I/II | Unknown | Unknown | SD |
| ARSD | SNV | Missense_Mutation | novel | c.1124N>T | p.Gly375Val | p.G375V | P51689 | protein_coding | deleterious(0) | probably_damaging(0.996) | TCGA-VS-A8QH-01 | Cervix | cervical & endocervical cancer | Female | >=65 | I/II | Chemotherapy | gemcitabine | PD |
| ARSD | SNV | Missense_Mutation | c.1441N>A | p.His481Asn | p.H481N | P51689 | protein_coding | deleterious(0) | probably_damaging(0.999) | TCGA-AA-3510-01 | Colorectum | colon adenocarcinoma | Male | >=65 | I/II | Unknown | Unknown | SD | |
| ARSD | SNV | Missense_Mutation | rs139907025 | c.475N>A | p.Gly159Arg | p.G159R | P51689 | protein_coding | tolerated(0.28) | benign(0.013) | TCGA-AA-3666-01 | Colorectum | colon adenocarcinoma | Male | >=65 | III/IV | Unknown | Unknown | PD |
| ARSD | SNV | Missense_Mutation | rs759116005 | c.89N>T | p.Thr30Met | p.T30M | P51689 | protein_coding | tolerated(0.13) | benign(0.138) | TCGA-AA-3947-01 | Colorectum | colon adenocarcinoma | Female | <65 | I/II | Unknown | Unknown | SD |
| ARSD | SNV | Missense_Mutation | c.794N>T | p.Thr265Met | p.T265M | P51689 | protein_coding | deleterious(0.01) | probably_damaging(0.951) | TCGA-AA-A01P-01 | Colorectum | colon adenocarcinoma | Female | >=65 | III/IV | Unknown | Unknown | PD | |
| ARSD | SNV | Missense_Mutation | rs776826306 | c.680N>T | p.Ala227Val | p.A227V | P51689 | protein_coding | tolerated(0.11) | benign(0.069) | TCGA-AZ-4615-01 | Colorectum | colon adenocarcinoma | Male | >=65 | III/IV | Chemotherapy | xeloda | PD |
| Page: 1 2 3 4 5 6 |
Top |
Related drugs of malignant transformation related genes |
| Identification of chemicals and drugs interact with genes involved in malignant transfromation |
| (DGIdb 4.0) |
| Entrez ID | Symbol | Category | Interaction Types | Drug Claim Name | Drug Name | PMIDs |
| Page: 1 |

Copyright 2023-Present -The University of Texas Health Science Center at Houston |