
|
|||||
|
 | |
| |
| |
| |
| |
| |
|
Gene: ARSA |
Gene summary for ARSA |
| Gene information | Species | Human | Gene symbol | ARSA | Gene ID | 410 |
| Gene name | arylsulfatase A | |
| Gene Alias | ASA | |
| Cytomap | 22q13.33 | |
| Gene Type | protein-coding | GO ID | GO:0000323 | UniProtAcc | A0A0C4DFZ2 |
Top |
Malignant transformation analysis |
| Identification of the aberrant gene expression in precancerous and cancerous lesions by comparing the gene expression of stem-like cells in diseased tissues with normal stem cells |
| Entrez ID | Symbol | Replicates | Species | Organ | Tissue | Adj P-value | Log2FC | Malignancy |
| 410 | ARSA | HTA11_2487_2000001011 | Human | Colorectum | SER | 4.80e-11 | 4.93e-01 | -0.1808 |
| 410 | ARSA | HTA11_1938_2000001011 | Human | Colorectum | AD | 2.12e-02 | 2.26e-01 | -0.0811 |
| 410 | ARSA | HTA11_347_2000001011 | Human | Colorectum | AD | 1.63e-08 | 2.99e-01 | -0.1954 |
| 410 | ARSA | HTA11_411_2000001011 | Human | Colorectum | SER | 2.35e-03 | 6.28e-01 | -0.2602 |
| 410 | ARSA | HTA11_2112_2000001011 | Human | Colorectum | SER | 3.01e-02 | 4.45e-01 | -0.2196 |
| 410 | ARSA | HTA11_3361_2000001011 | Human | Colorectum | AD | 9.83e-03 | 2.16e-01 | -0.1207 |
| 410 | ARSA | HTA11_83_2000001011 | Human | Colorectum | SER | 2.08e-03 | 3.22e-01 | -0.1526 |
| 410 | ARSA | HTA11_696_2000001011 | Human | Colorectum | AD | 2.80e-07 | 2.75e-01 | -0.1464 |
| 410 | ARSA | HTA11_1391_2000001011 | Human | Colorectum | AD | 1.81e-05 | 2.18e-01 | -0.059 |
| 410 | ARSA | LZE4T | Human | Esophagus | ESCC | 1.89e-09 | 2.34e-01 | 0.0811 |
| 410 | ARSA | LZE7T | Human | Esophagus | ESCC | 3.25e-06 | 1.56e-01 | 0.0667 |
| 410 | ARSA | LZE8T | Human | Esophagus | ESCC | 1.24e-06 | 2.16e-01 | 0.067 |
| 410 | ARSA | LZE22T | Human | Esophagus | ESCC | 5.07e-03 | 1.11e-01 | 0.068 |
| 410 | ARSA | LZE24T | Human | Esophagus | ESCC | 2.55e-20 | 5.53e-01 | 0.0596 |
| 410 | ARSA | LZE21T | Human | Esophagus | ESCC | 7.56e-05 | 2.55e-01 | 0.0655 |
| 410 | ARSA | LZE6T | Human | Esophagus | ESCC | 2.85e-06 | 1.70e-01 | 0.0845 |
| 410 | ARSA | P1T-E | Human | Esophagus | ESCC | 3.28e-07 | 7.03e-01 | 0.0875 |
| 410 | ARSA | P2T-E | Human | Esophagus | ESCC | 2.36e-25 | 3.13e-01 | 0.1177 |
| 410 | ARSA | P4T-E | Human | Esophagus | ESCC | 3.47e-23 | 4.69e-01 | 0.1323 |
| 410 | ARSA | P5T-E | Human | Esophagus | ESCC | 8.73e-21 | 4.37e-01 | 0.1327 |
| Page: 1 2 3 4 5 6 |
| Tissue | Expression Dynamics | Abbreviation |
| Colorectum (GSE201348) |  | FAP: Familial adenomatous polyposis |
| CRC: Colorectal cancer | ||
| Colorectum (HTA11) |  | AD: Adenomas |
| SER: Sessile serrated lesions | ||
| MSI-H: Microsatellite-high colorectal cancer | ||
| MSS: Microsatellite stable colorectal cancer | ||
| Esophagus | 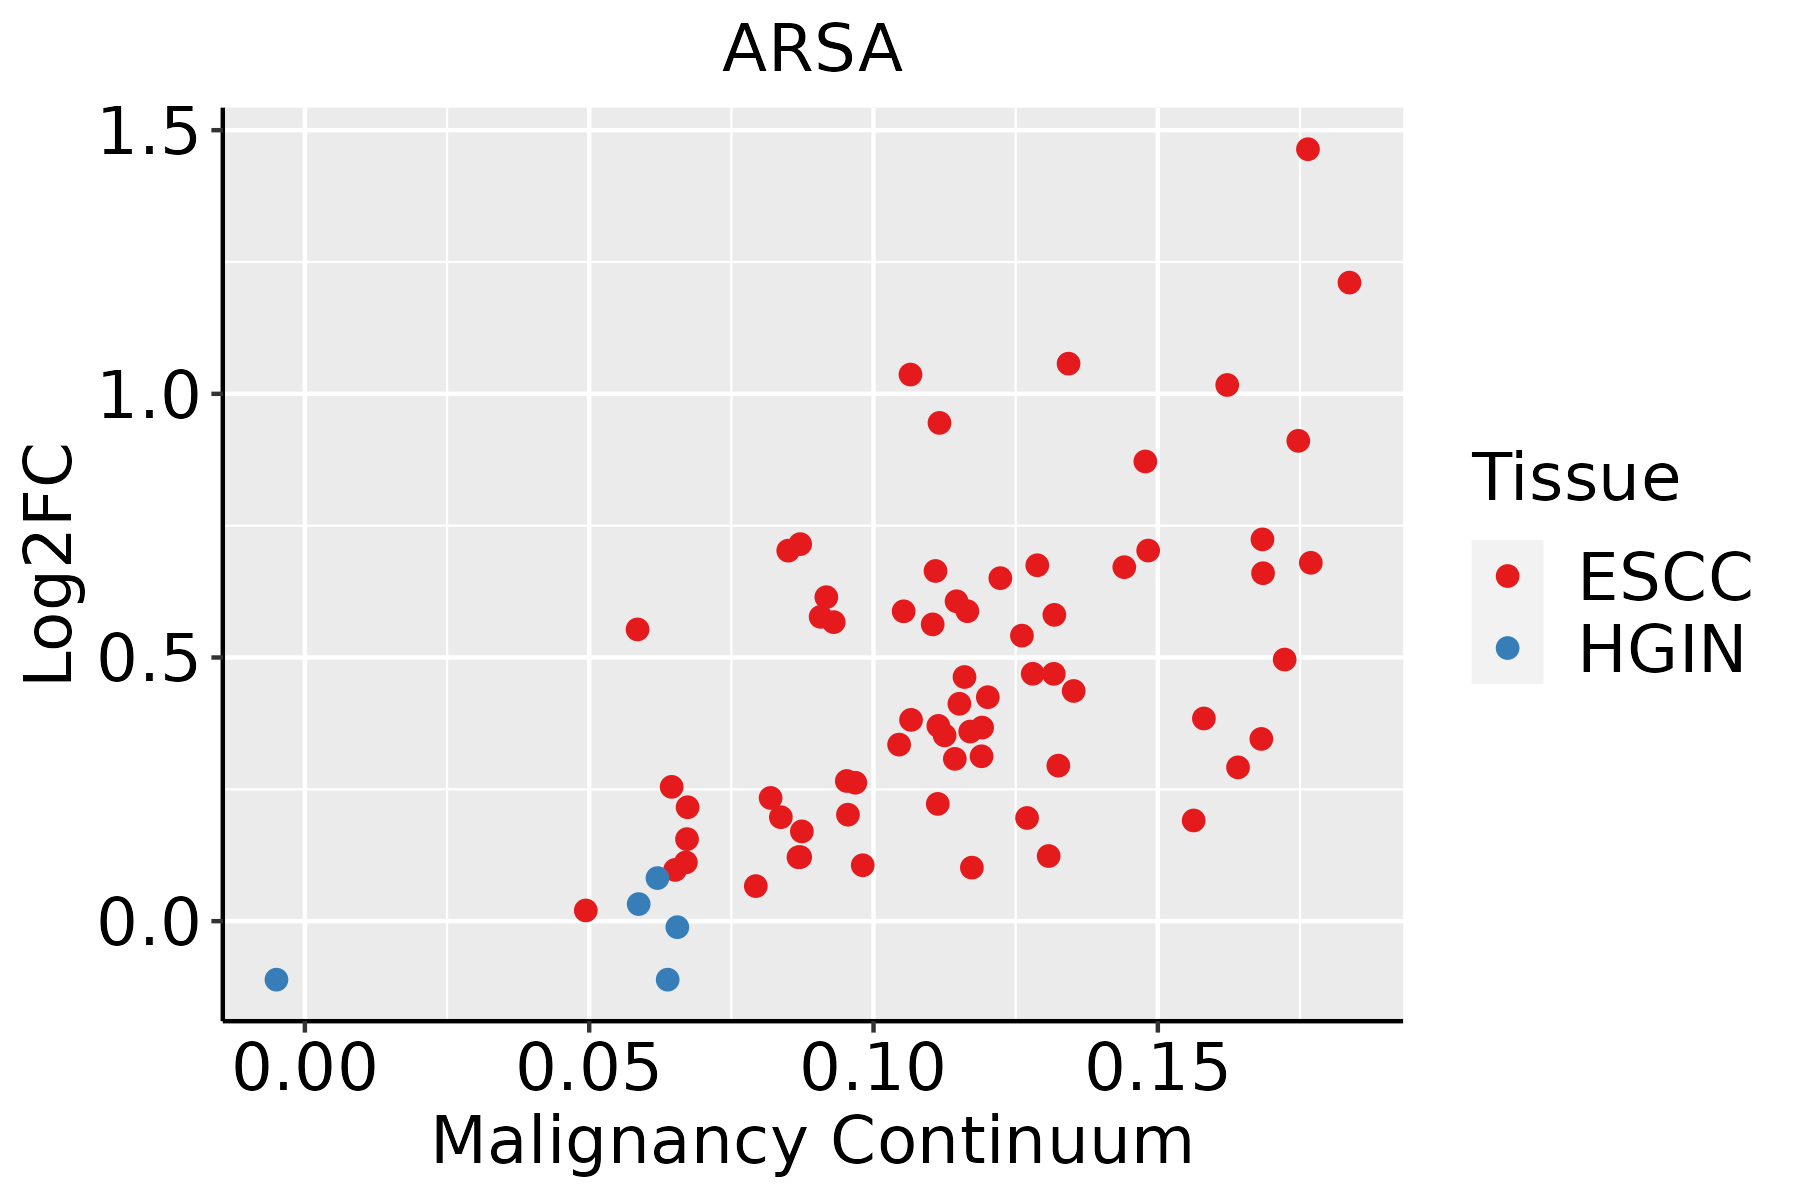 | ESCC: Esophageal squamous cell carcinoma |
| HGIN: High-grade intraepithelial neoplasias | ||
| LGIN: Low-grade intraepithelial neoplasias | ||
| Liver | 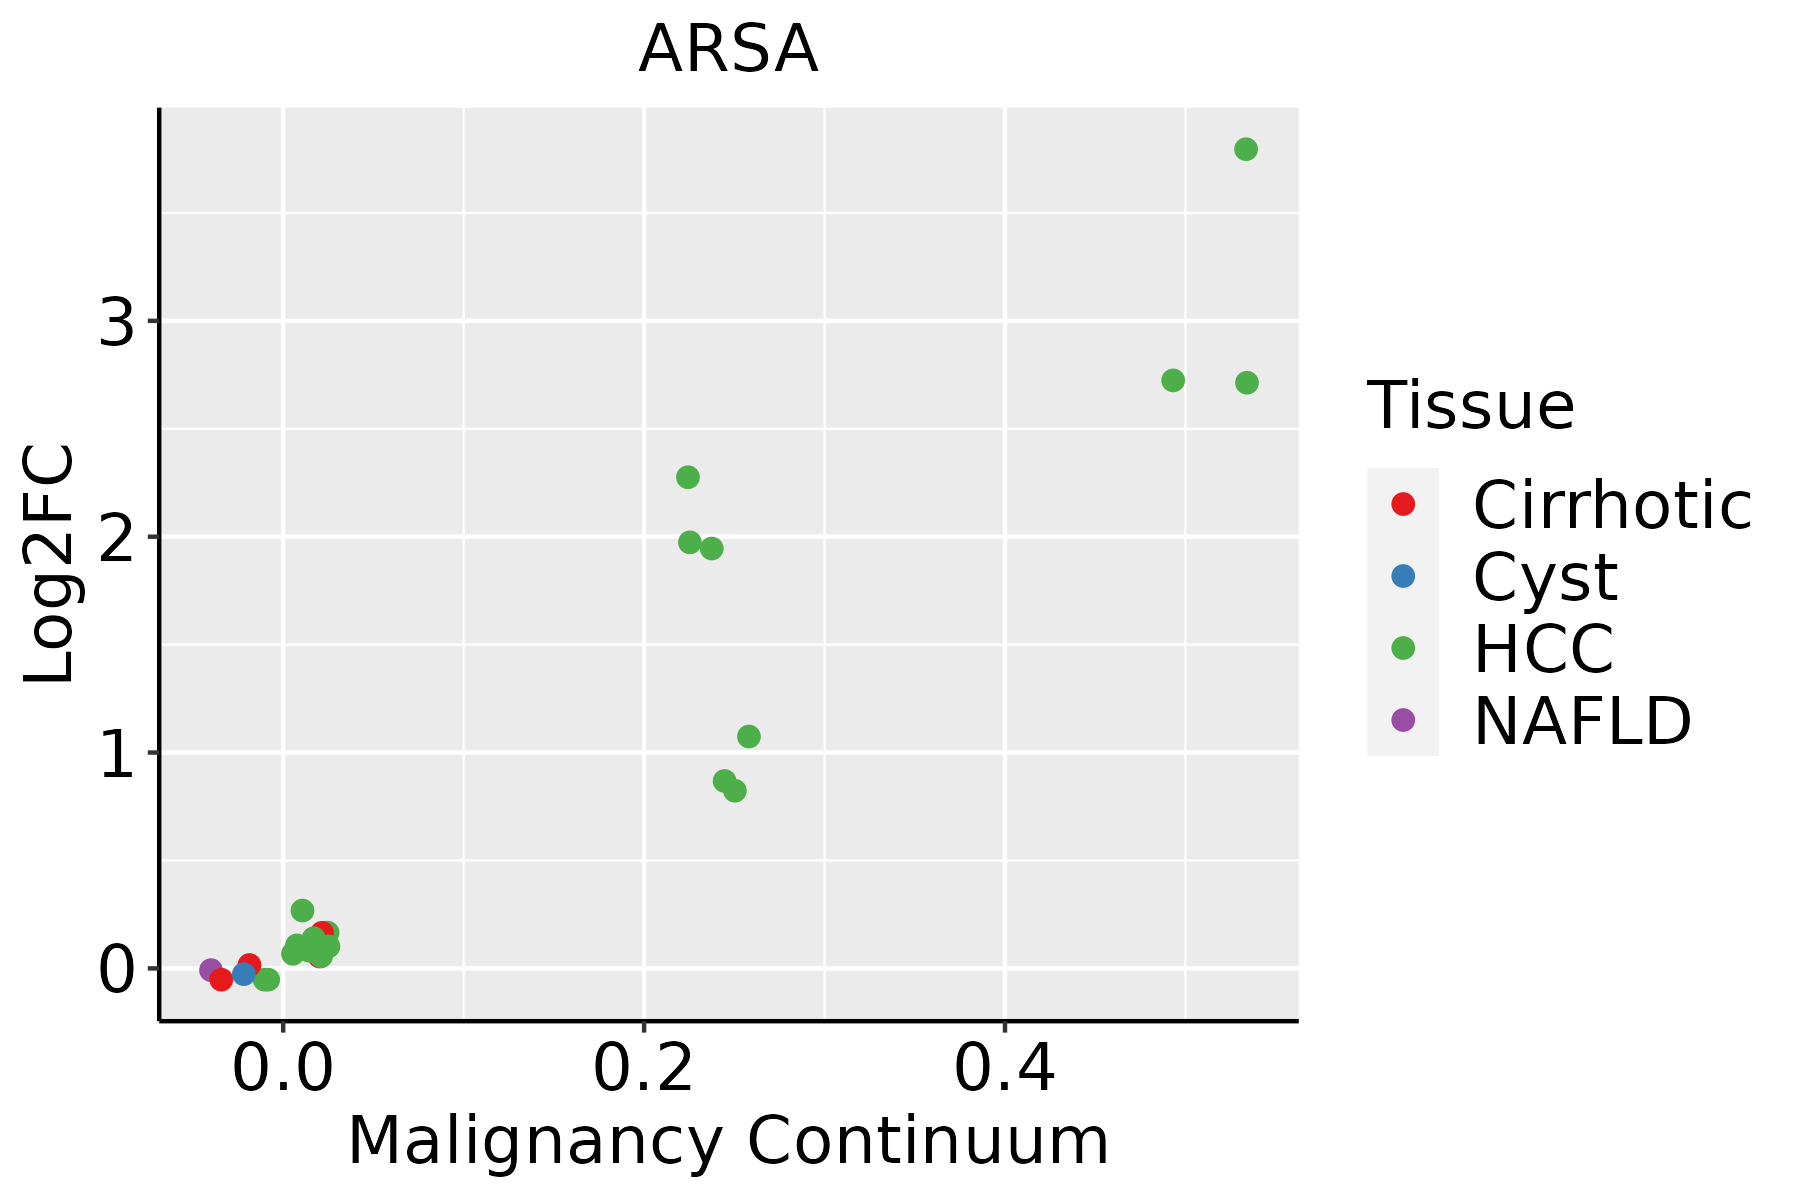 | HCC: Hepatocellular carcinoma |
| NAFLD: Non-alcoholic fatty liver disease | ||
| Oral Cavity | 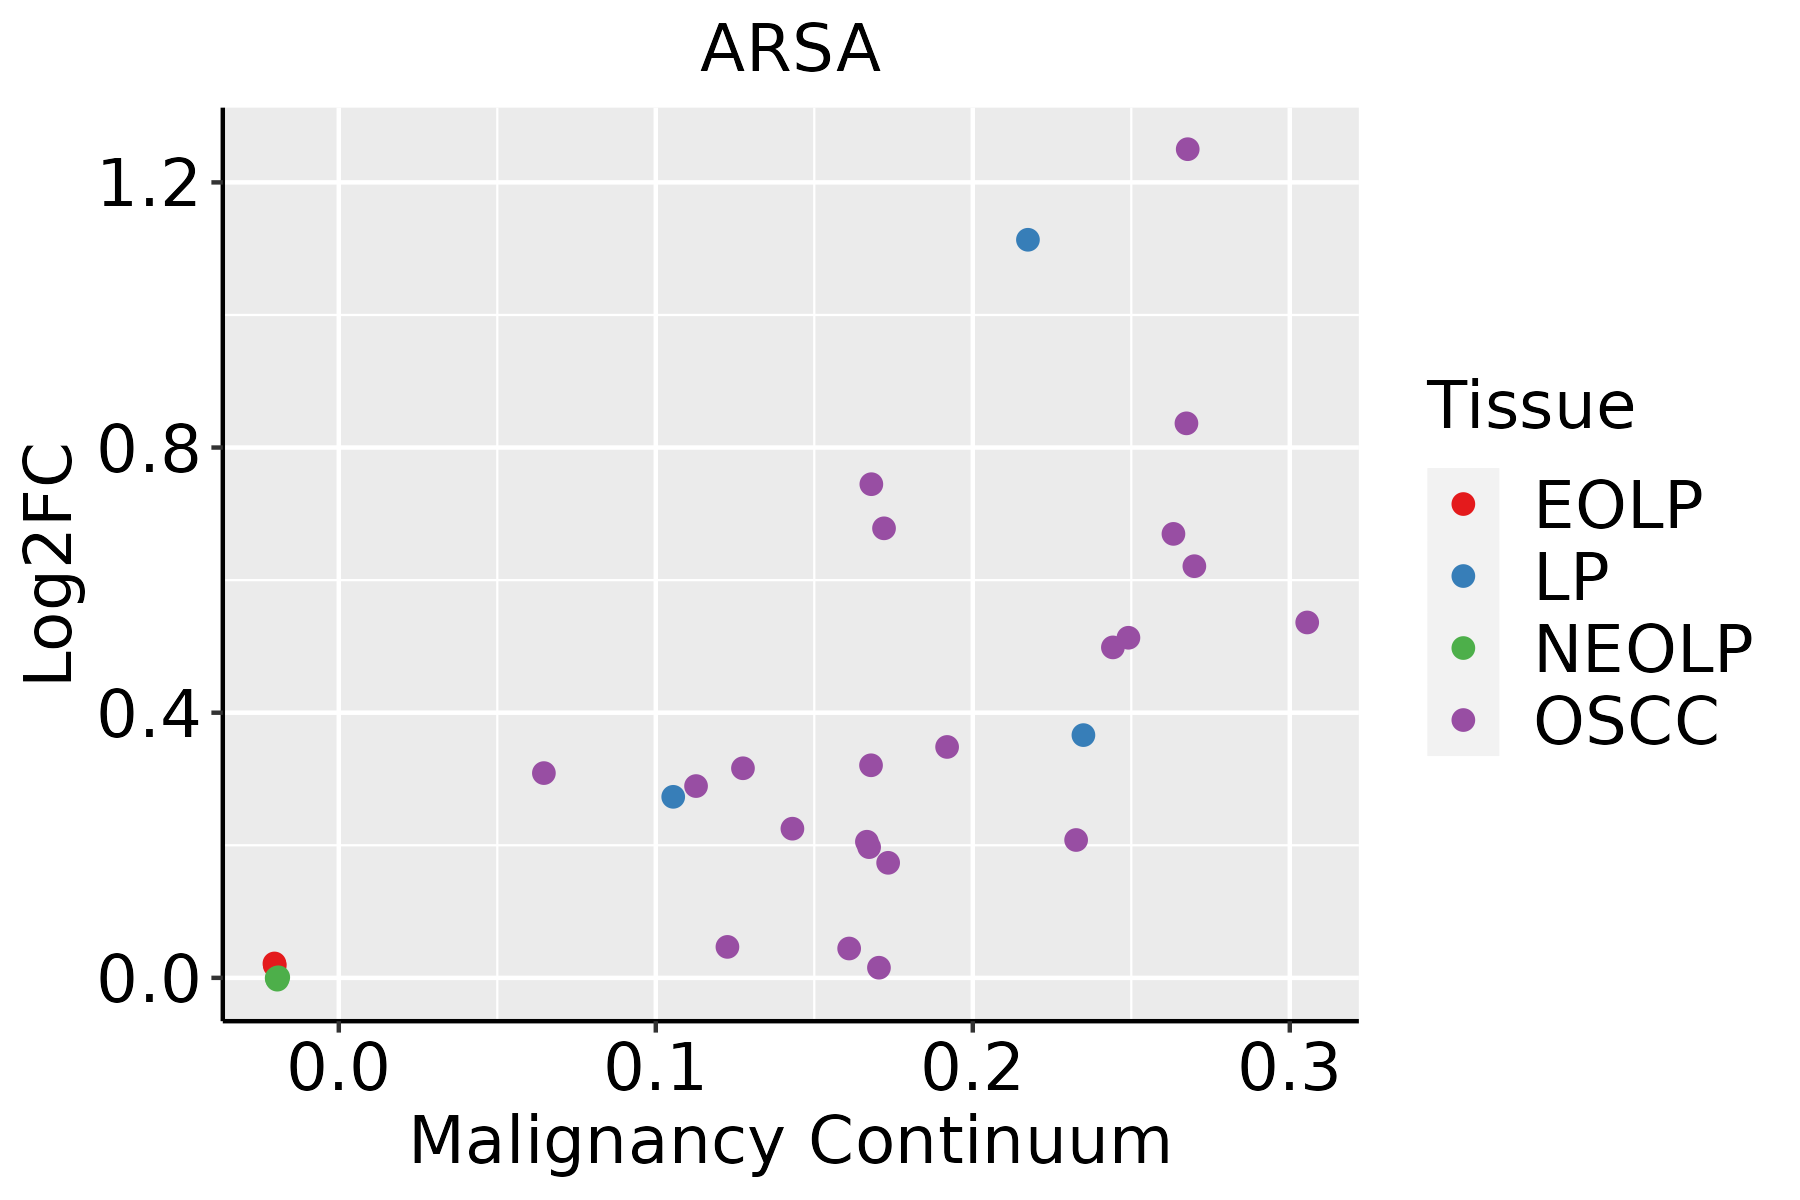 | EOLP: Erosive Oral lichen planus |
| LP: leukoplakia | ||
| NEOLP: Non-erosive oral lichen planus | ||
| OSCC: Oral squamous cell carcinoma | ||
| Thyroid | 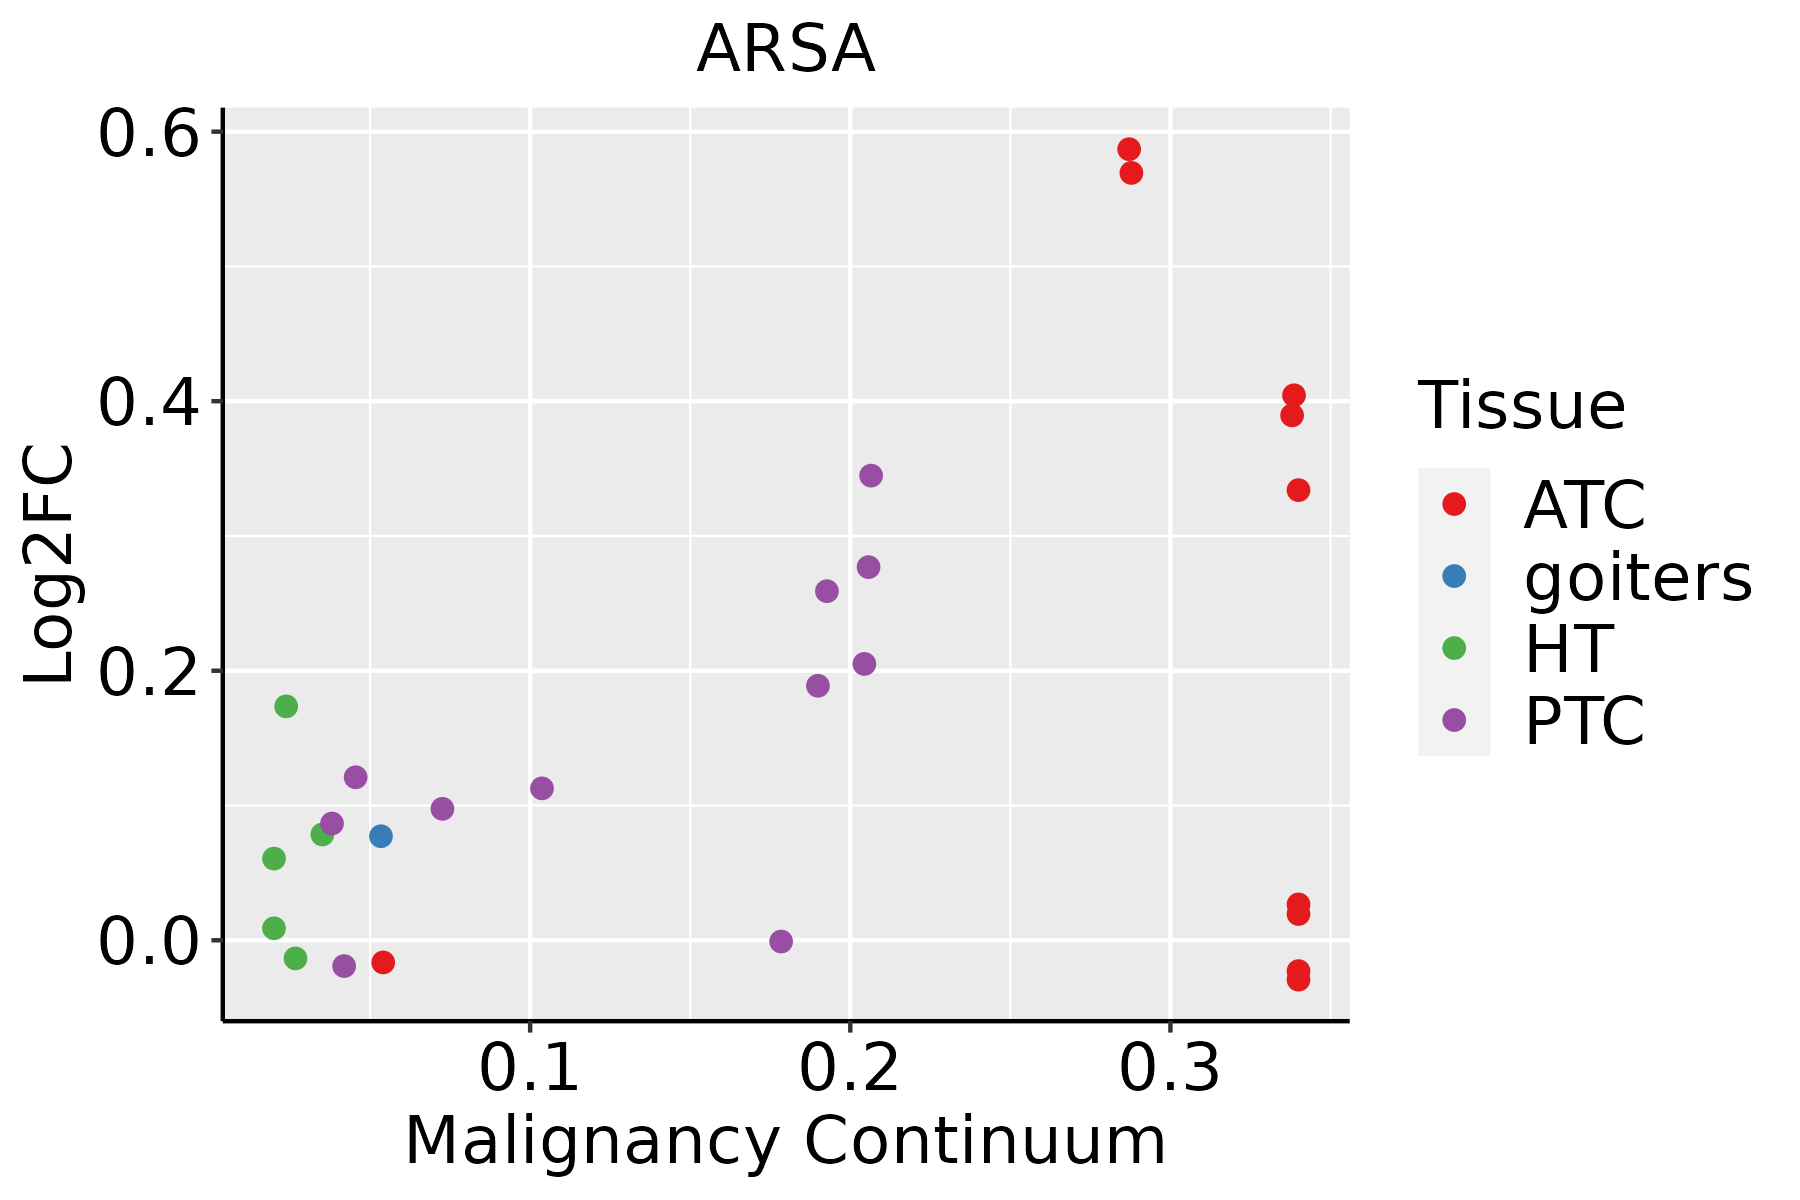 | ATC: Anaplastic thyroid cancer |
| HT: Hashimoto's thyroiditis | ||
| PTC: Papillary thyroid cancer |
| ∗log2FC in expression of this searched gene in stem-like cells from each diseased tissue sample relative to stem-like cells in normal samples in each tissue plotted against the malignancy continuum. Samples are colored based on if they are from different disease stage. |
Top |
Malignant transformation related pathway analysis |
| Find out the enriched GO biological processes and KEGG pathways involved in transition from healthy to precancer to cancer |
| Tissue | Disease Stage | Enriched GO biological Processes |
| Colorectum | AD |  |
| Colorectum | SER |  |
| Colorectum | MSS |  |
| Colorectum | MSI-H |  |
| Colorectum | FAP |  |
| ∗Top 15 enriched GO BP terms are showed in the bar plot of each disease state in each tissue. Each row represents a significant GO biological process which is colored according to the -log10(p.adjust). |
| Page: 1 2 3 4 5 6 7 8 9 |
| GO ID | Tissue | Disease Stage | Description | Gene Ratio | Bg Ratio | pvalue | p.adjust | Count |
| GO:0006418 | Colorectum | AD | tRNA aminoacylation for protein translation | 19/3918 | 41/18723 | 2.37e-04 | 3.03e-03 | 19 |
| GO:0043039 | Colorectum | AD | tRNA aminoacylation | 19/3918 | 44/18723 | 7.13e-04 | 7.21e-03 | 19 |
| GO:0043038 | Colorectum | AD | amino acid activation | 19/3918 | 45/18723 | 9.94e-04 | 9.28e-03 | 19 |
| GO:0006520 | Colorectum | AD | cellular amino acid metabolic process | 81/3918 | 284/18723 | 1.37e-03 | 1.19e-02 | 81 |
| GO:00064181 | Colorectum | SER | tRNA aminoacylation for protein translation | 17/2897 | 41/18723 | 5.75e-05 | 1.35e-03 | 17 |
| GO:00430391 | Colorectum | SER | tRNA aminoacylation | 17/2897 | 44/18723 | 1.64e-04 | 3.12e-03 | 17 |
| GO:00430381 | Colorectum | SER | amino acid activation | 17/2897 | 45/18723 | 2.25e-04 | 3.91e-03 | 17 |
| GO:00065201 | Colorectum | SER | cellular amino acid metabolic process | 61/2897 | 284/18723 | 4.20e-03 | 3.41e-02 | 61 |
| GO:00346606 | Esophagus | HGIN | ncRNA metabolic process | 104/2587 | 485/18723 | 2.26e-06 | 8.23e-05 | 104 |
| GO:003466012 | Esophagus | ESCC | ncRNA metabolic process | 346/8552 | 485/18723 | 4.35e-31 | 2.51e-28 | 346 |
| GO:00063992 | Esophagus | ESCC | tRNA metabolic process | 122/8552 | 179/18723 | 9.03e-10 | 2.19e-08 | 122 |
| GO:00512623 | Esophagus | ESCC | protein tetramerization | 54/8552 | 87/18723 | 1.50e-03 | 7.06e-03 | 54 |
| GO:00512592 | Esophagus | ESCC | protein complex oligomerization | 130/8552 | 238/18723 | 3.29e-03 | 1.36e-02 | 130 |
| GO:00346603 | Liver | Cirrhotic | ncRNA metabolic process | 173/4634 | 485/18723 | 3.64e-08 | 1.21e-06 | 173 |
| GO:000652011 | Liver | Cirrhotic | cellular amino acid metabolic process | 103/4634 | 284/18723 | 8.88e-06 | 1.30e-04 | 103 |
| GO:00346601 | Liver | HCC | ncRNA metabolic process | 332/7958 | 485/18723 | 1.48e-31 | 7.80e-29 | 332 |
| GO:00065202 | Liver | HCC | cellular amino acid metabolic process | 167/7958 | 284/18723 | 1.91e-08 | 4.56e-07 | 167 |
| GO:0006399 | Liver | HCC | tRNA metabolic process | 108/7958 | 179/18723 | 1.07e-06 | 1.59e-05 | 108 |
| GO:0051262 | Liver | HCC | protein tetramerization | 50/7958 | 87/18723 | 3.42e-03 | 1.55e-02 | 50 |
| GO:0051290 | Liver | HCC | protein heterotetramerization | 12/7958 | 15/18723 | 3.56e-03 | 1.59e-02 | 12 |
| Page: 1 2 |
| Pathway ID | Tissue | Disease Stage | Description | Gene Ratio | Bg Ratio | pvalue | p.adjust | qvalue | Count |
| hsa04142 | Colorectum | SER | Lysosome | 38/1580 | 132/8465 | 2.87e-03 | 2.03e-02 | 1.47e-02 | 38 |
| hsa041421 | Colorectum | SER | Lysosome | 38/1580 | 132/8465 | 2.87e-03 | 2.03e-02 | 1.47e-02 | 38 |
| hsa0414222 | Esophagus | ESCC | Lysosome | 102/4205 | 132/8465 | 5.11e-11 | 7.13e-10 | 3.65e-10 | 102 |
| hsa006003 | Esophagus | ESCC | Sphingolipid metabolism | 36/4205 | 53/8465 | 5.41e-03 | 1.36e-02 | 6.99e-03 | 36 |
| hsa0414232 | Esophagus | ESCC | Lysosome | 102/4205 | 132/8465 | 5.11e-11 | 7.13e-10 | 3.65e-10 | 102 |
| hsa0060012 | Esophagus | ESCC | Sphingolipid metabolism | 36/4205 | 53/8465 | 5.41e-03 | 1.36e-02 | 6.99e-03 | 36 |
| hsa041422 | Liver | HCC | Lysosome | 100/4020 | 132/8465 | 2.32e-11 | 4.31e-10 | 2.40e-10 | 100 |
| hsa00600 | Liver | HCC | Sphingolipid metabolism | 34/4020 | 53/8465 | 1.06e-02 | 2.71e-02 | 1.51e-02 | 34 |
| hsa041423 | Liver | HCC | Lysosome | 100/4020 | 132/8465 | 2.32e-11 | 4.31e-10 | 2.40e-10 | 100 |
| hsa006001 | Liver | HCC | Sphingolipid metabolism | 34/4020 | 53/8465 | 1.06e-02 | 2.71e-02 | 1.51e-02 | 34 |
| hsa041425 | Oral cavity | OSCC | Lysosome | 87/3704 | 132/8465 | 1.97e-07 | 1.35e-06 | 6.86e-07 | 87 |
| hsa006002 | Oral cavity | OSCC | Sphingolipid metabolism | 33/3704 | 53/8465 | 5.00e-03 | 1.20e-02 | 6.13e-03 | 33 |
| hsa0414212 | Oral cavity | OSCC | Lysosome | 87/3704 | 132/8465 | 1.97e-07 | 1.35e-06 | 6.86e-07 | 87 |
| hsa0060011 | Oral cavity | OSCC | Sphingolipid metabolism | 33/3704 | 53/8465 | 5.00e-03 | 1.20e-02 | 6.13e-03 | 33 |
| hsa0414221 | Oral cavity | LP | Lysosome | 67/2418 | 132/8465 | 5.13e-08 | 7.77e-07 | 5.01e-07 | 67 |
| hsa0414231 | Oral cavity | LP | Lysosome | 67/2418 | 132/8465 | 5.13e-08 | 7.77e-07 | 5.01e-07 | 67 |
| Page: 1 |
Top |
Cell-cell communication analysis |
| Identification of potential cell-cell interactions between two cell types and their ligand-receptor pairs for different disease states |
| Ligand | Receptor | LRpair | Pathway | Tissue | Disease Stage |
| Page: 1 |
Top |
Single-cell gene regulatory network inference analysis |
| Find out the significant the regulons (TFs) and the target genes of each regulon across cell types for different disease states |
| TF | Cell Type | Tissue | Disease Stage | Target Gene | RSS | Regulon Activity |
| ∗The dot plots of a searched regulon are shown for all cell subpopulations in each disease state of each tissue based on the regulon specific score inferred using pySCENIC and by calculating the average expression. |
| Page: 1 |
Top |
Somatic mutation of malignant transformation related genes |
| Annotation of somatic variants for genes involved in malignant transformation |
| Hugo Symbol | Variant Class | Variant Classification | dbSNP RS | HGVSc | HGVSp | HGVSp Short | SWISSPROT | BIOTYPE | SIFT | PolyPhen | Tumor Sample Barcode | Tissue | Histology | Sex | Age | Stage | Therapy Types | Drugs | Outcome |
| ARSA | SNV | Missense_Mutation | rs74315462 | c.413N>T | p.Pro138Leu | p.P138L | protein_coding | deleterious(0) | probably_damaging(0.994) | TCGA-A2-A04R-01 | Breast | breast invasive carcinoma | Female | <65 | I/II | Chemotherapy | taxol | SD | |
| ARSA | SNV | Missense_Mutation | rs573456864 | c.902G>A | p.Arg301Gln | p.R301Q | protein_coding | deleterious(0.02) | possibly_damaging(0.872) | TCGA-C8-A12Z-01 | Breast | breast invasive carcinoma | Female | <65 | I/II | Chemotherapy | 5-fluorouracil | CR | |
| ARSA | SNV | Missense_Mutation | novel | c.536T>A | p.Val179Asp | p.V179D | protein_coding | deleterious(0.01) | probably_damaging(0.966) | TCGA-GI-A2C9-01 | Breast | breast invasive carcinoma | Female | <65 | I/II | Unspecific | SD | ||
| ARSA | SNV | Missense_Mutation | novel | c.1274N>G | p.His425Arg | p.H425R | protein_coding | deleterious(0) | probably_damaging(1) | TCGA-UU-A93S-01 | Breast | breast invasive carcinoma | Female | <65 | III/IV | Unknown | Unknown | PD | |
| ARSA | deletion | Frame_Shift_Del | novel | c.151delC | p.Leu51TrpfsTer29 | p.L51Wfs*29 | protein_coding | TCGA-EW-A2FV-01 | Breast | breast invasive carcinoma | Female | <65 | III/IV | Chemotherapy | docetaxel | SD | |||
| ARSA | SNV | Missense_Mutation | rs74315477 | c.1115N>A | p.Arg372Gln | p.R372Q | protein_coding | deleterious(0) | probably_damaging(0.999) | TCGA-2W-A8YY-01 | Cervix | cervical & endocervical cancer | Female | <65 | I/II | Chemotherapy | cisplatin | CR | |
| ARSA | SNV | Missense_Mutation | c.170N>C | p.Gly57Ala | p.G57A | protein_coding | tolerated(0.64) | benign(0.001) | TCGA-C5-A1BQ-01 | Cervix | cervical & endocervical cancer | Female | >=65 | III/IV | Chemotherapy | cisplatin | CR | ||
| ARSA | SNV | Missense_Mutation | c.646C>T | p.Arg216Cys | p.R216C | protein_coding | deleterious(0.02) | possibly_damaging(0.793) | TCGA-A6-A566-01 | Colorectum | colon adenocarcinoma | Female | <65 | III/IV | Chemotherapy | oxaliplatin | PD | ||
| ARSA | SNV | Missense_Mutation | c.625G>A | p.Asp209Asn | p.D209N | protein_coding | tolerated(0.34) | benign(0.003) | TCGA-AA-3672-01 | Colorectum | colon adenocarcinoma | Female | >=65 | III/IV | Unknown | Unknown | SD | ||
| ARSA | SNV | Missense_Mutation | rs377610043 | c.1252N>A | p.Ala418Thr | p.A418T | protein_coding | tolerated(0.6) | benign(0.087) | TCGA-AZ-4313-01 | Colorectum | colon adenocarcinoma | Female | <65 | I/II | Unknown | Unknown | SD |
| Page: 1 2 3 4 |
Top |
Related drugs of malignant transformation related genes |
| Identification of chemicals and drugs interact with genes involved in malignant transfromation |
| (DGIdb 4.0) |
| Entrez ID | Symbol | Category | Interaction Types | Drug Claim Name | Drug Name | PMIDs |
| 410 | ARSA | DRUGGABLE GENOME, ENZYME | RO-410960 | CHEMBL1256291 | ||
| 410 | ARSA | DRUGGABLE GENOME, ENZYME | GOSSYPOL | GOSSYPOL | ||
| 410 | ARSA | DRUGGABLE GENOME, ENZYME | DESIPRAMINE | DESIPRAMINE | ||
| 410 | ARSA | DRUGGABLE GENOME, ENZYME | SQ-22536 | CHEMBL64239 | ||
| 410 | ARSA | DRUGGABLE GENOME, ENZYME | PIRENPERONE | PIRENPERONE | ||
| 410 | ARSA | DRUGGABLE GENOME, ENZYME | MELEVODOPA | MELEVODOPA | ||
| 410 | ARSA | DRUGGABLE GENOME, ENZYME | SPIROXATRINE | SPIROXATRINE | ||
| 410 | ARSA | DRUGGABLE GENOME, ENZYME | methylphenidate | METHYLPHENIDATE | 29382897 | |
| 410 | ARSA | DRUGGABLE GENOME, ENZYME | 6-HYDROXYMELATONIN | CHEMBL127421 | ||
| 410 | ARSA | DRUGGABLE GENOME, ENZYME | 3,5-DINITROCATECHOL (OR-486) | 3,5-DINITROCATECHOL (OR-486) |
| Page: 1 2 3 |

Copyright 2023-Present -The University of Texas Health Science Center at Houston |