
|
|||||
|
 | |
| |
| |
| |
| |
| |
|
Gene: ARRDC4 |
Gene summary for ARRDC4 |
| Gene information | Species | Human | Gene symbol | ARRDC4 | Gene ID | 91947 |
| Gene name | arrestin domain containing 4 | |
| Gene Alias | ARRDC4 | |
| Cytomap | 15q26.2 | |
| Gene Type | protein-coding | GO ID | GO:0006464 | UniProtAcc | A0A024RC80 |
Top |
Malignant transformation analysis |
| Identification of the aberrant gene expression in precancerous and cancerous lesions by comparing the gene expression of stem-like cells in diseased tissues with normal stem cells |
| Entrez ID | Symbol | Replicates | Species | Organ | Tissue | Adj P-value | Log2FC | Malignancy |
| 91947 | ARRDC4 | LZE24T | Human | Esophagus | ESCC | 3.49e-05 | 1.45e-01 | 0.0596 |
| 91947 | ARRDC4 | P1T-E | Human | Esophagus | ESCC | 1.01e-03 | 2.01e-01 | 0.0875 |
| 91947 | ARRDC4 | P2T-E | Human | Esophagus | ESCC | 5.36e-05 | 6.06e-02 | 0.1177 |
| 91947 | ARRDC4 | P4T-E | Human | Esophagus | ESCC | 7.97e-13 | 3.29e-01 | 0.1323 |
| 91947 | ARRDC4 | P5T-E | Human | Esophagus | ESCC | 3.43e-28 | 5.48e-01 | 0.1327 |
| 91947 | ARRDC4 | P8T-E | Human | Esophagus | ESCC | 1.57e-06 | 5.90e-02 | 0.0889 |
| 91947 | ARRDC4 | P9T-E | Human | Esophagus | ESCC | 3.79e-07 | 1.16e-01 | 0.1131 |
| 91947 | ARRDC4 | P10T-E | Human | Esophagus | ESCC | 2.81e-23 | 4.63e-01 | 0.116 |
| 91947 | ARRDC4 | P11T-E | Human | Esophagus | ESCC | 1.98e-06 | 3.75e-01 | 0.1426 |
| 91947 | ARRDC4 | P12T-E | Human | Esophagus | ESCC | 5.10e-15 | 2.39e-01 | 0.1122 |
| 91947 | ARRDC4 | P15T-E | Human | Esophagus | ESCC | 1.24e-12 | 3.21e-01 | 0.1149 |
| 91947 | ARRDC4 | P16T-E | Human | Esophagus | ESCC | 2.06e-09 | 1.52e-01 | 0.1153 |
| 91947 | ARRDC4 | P17T-E | Human | Esophagus | ESCC | 1.30e-02 | 2.74e-01 | 0.1278 |
| 91947 | ARRDC4 | P19T-E | Human | Esophagus | ESCC | 1.00e-10 | 3.65e-01 | 0.1662 |
| 91947 | ARRDC4 | P20T-E | Human | Esophagus | ESCC | 7.38e-08 | 1.62e-01 | 0.1124 |
| 91947 | ARRDC4 | P21T-E | Human | Esophagus | ESCC | 9.41e-09 | 1.64e-01 | 0.1617 |
| 91947 | ARRDC4 | P22T-E | Human | Esophagus | ESCC | 6.00e-09 | 1.37e-01 | 0.1236 |
| 91947 | ARRDC4 | P23T-E | Human | Esophagus | ESCC | 7.46e-09 | 3.41e-01 | 0.108 |
| 91947 | ARRDC4 | P24T-E | Human | Esophagus | ESCC | 8.78e-06 | 5.89e-02 | 0.1287 |
| 91947 | ARRDC4 | P26T-E | Human | Esophagus | ESCC | 4.40e-12 | 1.82e-01 | 0.1276 |
| Page: 1 2 3 |
| Tissue | Expression Dynamics | Abbreviation |
| Esophagus | 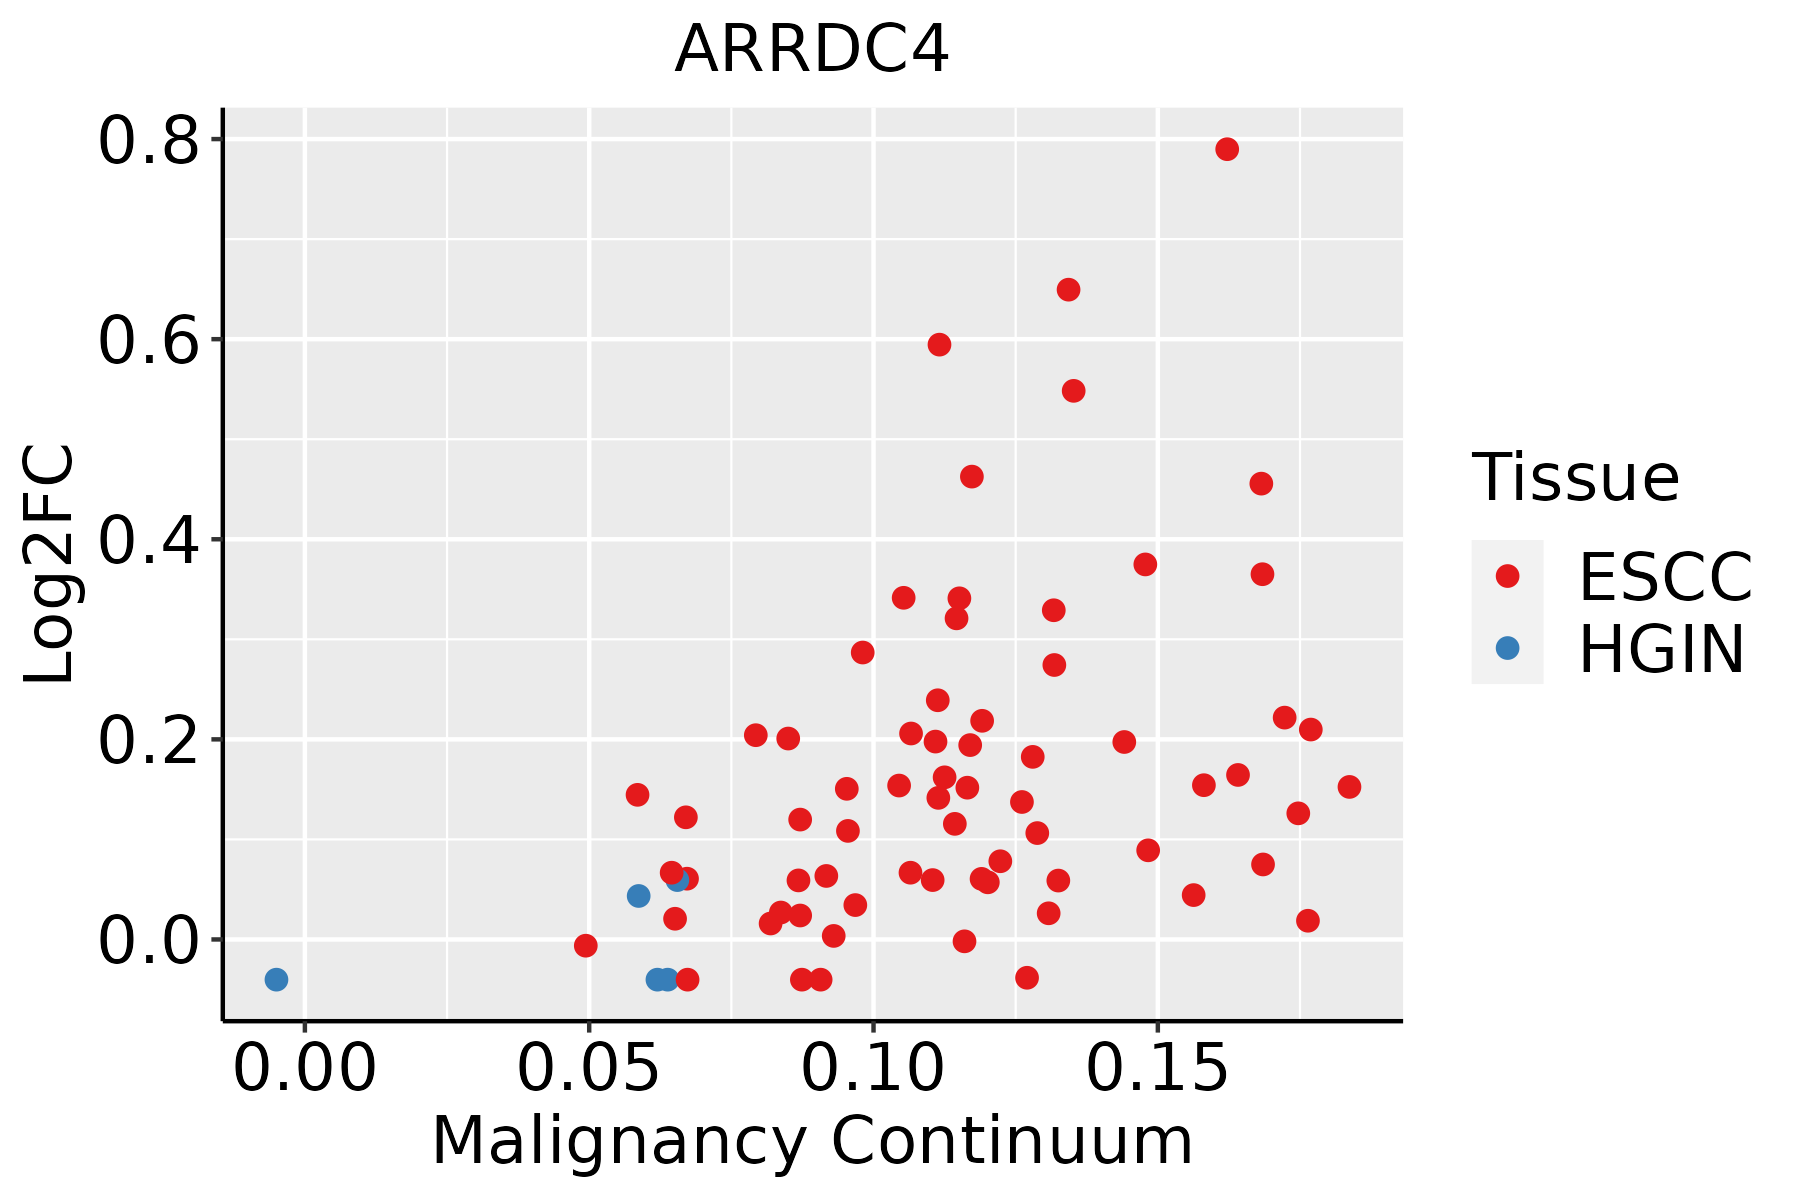 | ESCC: Esophageal squamous cell carcinoma |
| HGIN: High-grade intraepithelial neoplasias | ||
| LGIN: Low-grade intraepithelial neoplasias |
| ∗log2FC in expression of this searched gene in stem-like cells from each diseased tissue sample relative to stem-like cells in normal samples in each tissue plotted against the malignancy continuum. Samples are colored based on if they are from different disease stage. |
Top |
Malignant transformation related pathway analysis |
| Find out the enriched GO biological processes and KEGG pathways involved in transition from healthy to precancer to cancer |
| Tissue | Disease Stage | Enriched GO biological Processes |
| Colorectum | AD |  |
| Colorectum | SER |  |
| Colorectum | MSS |  |
| Colorectum | MSI-H |  |
| Colorectum | FAP |  |
| ∗Top 15 enriched GO BP terms are showed in the bar plot of each disease state in each tissue. Each row represents a significant GO biological process which is colored according to the -log10(p.adjust). |
| Page: 1 2 3 4 5 6 7 8 9 |
| GO ID | Tissue | Disease Stage | Description | Gene Ratio | Bg Ratio | pvalue | p.adjust | Count |
| GO:1903320111 | Esophagus | ESCC | regulation of protein modification by small protein conjugation or removal | 181/8552 | 242/18723 | 1.80e-20 | 2.60e-18 | 181 |
| GO:0031396111 | Esophagus | ESCC | regulation of protein ubiquitination | 154/8552 | 210/18723 | 2.70e-16 | 2.04e-14 | 154 |
| GO:190332216 | Esophagus | ESCC | positive regulation of protein modification by small protein conjugation or removal | 99/8552 | 138/18723 | 4.39e-10 | 1.16e-08 | 99 |
| GO:003139816 | Esophagus | ESCC | positive regulation of protein ubiquitination | 82/8552 | 119/18723 | 2.41e-07 | 3.64e-06 | 82 |
| GO:01401128 | Esophagus | ESCC | extracellular vesicle biogenesis | 20/8552 | 23/18723 | 4.97e-05 | 3.86e-04 | 20 |
| GO:005143819 | Esophagus | ESCC | regulation of ubiquitin-protein transferase activity | 38/8552 | 53/18723 | 1.10e-04 | 7.69e-04 | 38 |
| GO:00514433 | Esophagus | ESCC | positive regulation of ubiquitin-protein transferase activity | 21/8552 | 31/18723 | 1.10e-02 | 3.70e-02 | 21 |
| Page: 1 |
| Pathway ID | Tissue | Disease Stage | Description | Gene Ratio | Bg Ratio | pvalue | p.adjust | qvalue | Count |
| Page: 1 |
Top |
Cell-cell communication analysis |
| Identification of potential cell-cell interactions between two cell types and their ligand-receptor pairs for different disease states |
| Ligand | Receptor | LRpair | Pathway | Tissue | Disease Stage |
| Page: 1 |
Top |
Single-cell gene regulatory network inference analysis |
| Find out the significant the regulons (TFs) and the target genes of each regulon across cell types for different disease states |
| TF | Cell Type | Tissue | Disease Stage | Target Gene | RSS | Regulon Activity |
| ∗The dot plots of a searched regulon are shown for all cell subpopulations in each disease state of each tissue based on the regulon specific score inferred using pySCENIC and by calculating the average expression. |
| Page: 1 |
Top |
Somatic mutation of malignant transformation related genes |
| Annotation of somatic variants for genes involved in malignant transformation |
| Hugo Symbol | Variant Class | Variant Classification | dbSNP RS | HGVSc | HGVSp | HGVSp Short | SWISSPROT | BIOTYPE | SIFT | PolyPhen | Tumor Sample Barcode | Tissue | Histology | Sex | Age | Stage | Therapy Types | Drugs | Outcome |
| ARRDC4 | SNV | Missense_Mutation | novel | c.10N>C | p.Glu4Gln | p.E4Q | Q8NCT1 | protein_coding | deleterious_low_confidence(0.01) | benign(0.069) | TCGA-5L-AAT1-01 | Breast | breast invasive carcinoma | Female | <65 | III/IV | Hormone Therapy | letrozol | SD |
| ARRDC4 | SNV | Missense_Mutation | c.1007N>C | p.Met336Thr | p.M336T | Q8NCT1 | protein_coding | tolerated(0.1) | benign(0.1) | TCGA-A1-A0SE-01 | Breast | breast invasive carcinoma | Female | <65 | I/II | Unknown | Unknown | SD | |
| ARRDC4 | insertion | Nonsense_Mutation | novel | c.506_507insATGGAAACTAGTTTAAACTTTTACGTTTTTGC | p.Asn169LysfsTer6 | p.N169Kfs*6 | Q8NCT1 | protein_coding | TCGA-AN-A04A-01 | Breast | breast invasive carcinoma | Female | <65 | III/IV | Unknown | Unknown | SD | ||
| ARRDC4 | deletion | Frame_Shift_Del | c.656delN | p.Asn220IlefsTer6 | p.N220Ifs*6 | Q8NCT1 | protein_coding | TCGA-BH-A0BV-01 | Breast | breast invasive carcinoma | Female | >=65 | I/II | Chemotherapy | doxorubicin | SD | |||
| ARRDC4 | SNV | Missense_Mutation | novel | c.335G>C | p.Gly112Ala | p.G112A | Q8NCT1 | protein_coding | deleterious(0) | possibly_damaging(0.57) | TCGA-VS-A959-01 | Cervix | cervical & endocervical cancer | Female | >=65 | I/II | Unknown | Unknown | SD |
| ARRDC4 | SNV | Missense_Mutation | novel | c.323T>C | p.Leu108Ser | p.L108S | Q8NCT1 | protein_coding | deleterious(0.02) | probably_damaging(0.915) | TCGA-AG-3892-01 | Colorectum | rectum adenocarcinoma | Female | <65 | I/II | Unknown | Unknown | SD |
| ARRDC4 | insertion | Frame_Shift_Ins | novel | c.449_450insAGACATTAATTAT | p.Val151AspfsTer7 | p.V151Dfs*7 | Q8NCT1 | protein_coding | TCGA-AM-5820-01 | Colorectum | colon adenocarcinoma | Female | <65 | I/II | Unknown | Unknown | SD | ||
| ARRDC4 | SNV | Missense_Mutation | novel | c.820N>T | p.Ile274Phe | p.I274F | Q8NCT1 | protein_coding | deleterious(0) | probably_damaging(0.999) | TCGA-A5-A0G2-01 | Endometrium | uterine corpus endometrioid carcinoma | Female | <65 | III/IV | Unknown | Unknown | SD |
| ARRDC4 | SNV | Missense_Mutation | novel | c.539C>A | p.Thr180Asn | p.T180N | Q8NCT1 | protein_coding | tolerated(0.11) | benign(0.231) | TCGA-A5-A2K5-01 | Endometrium | uterine corpus endometrioid carcinoma | Female | >=65 | I/II | Unknown | Unknown | SD |
| ARRDC4 | SNV | Missense_Mutation | rs367878363 | c.472N>T | p.Arg158Trp | p.R158W | Q8NCT1 | protein_coding | deleterious(0) | probably_damaging(0.94) | TCGA-AP-A059-01 | Endometrium | uterine corpus endometrioid carcinoma | Female | >=65 | I/II | Unknown | Unknown | SD |
| Page: 1 2 3 4 5 |
Top |
Related drugs of malignant transformation related genes |
| Identification of chemicals and drugs interact with genes involved in malignant transfromation |
| (DGIdb 4.0) |
| Entrez ID | Symbol | Category | Interaction Types | Drug Claim Name | Drug Name | PMIDs |
| Page: 1 |

Copyright 2023-Present -The University of Texas Health Science Center at Houston |