| Tissue | Expression Dynamics | Abbreviation |
| Cervix | 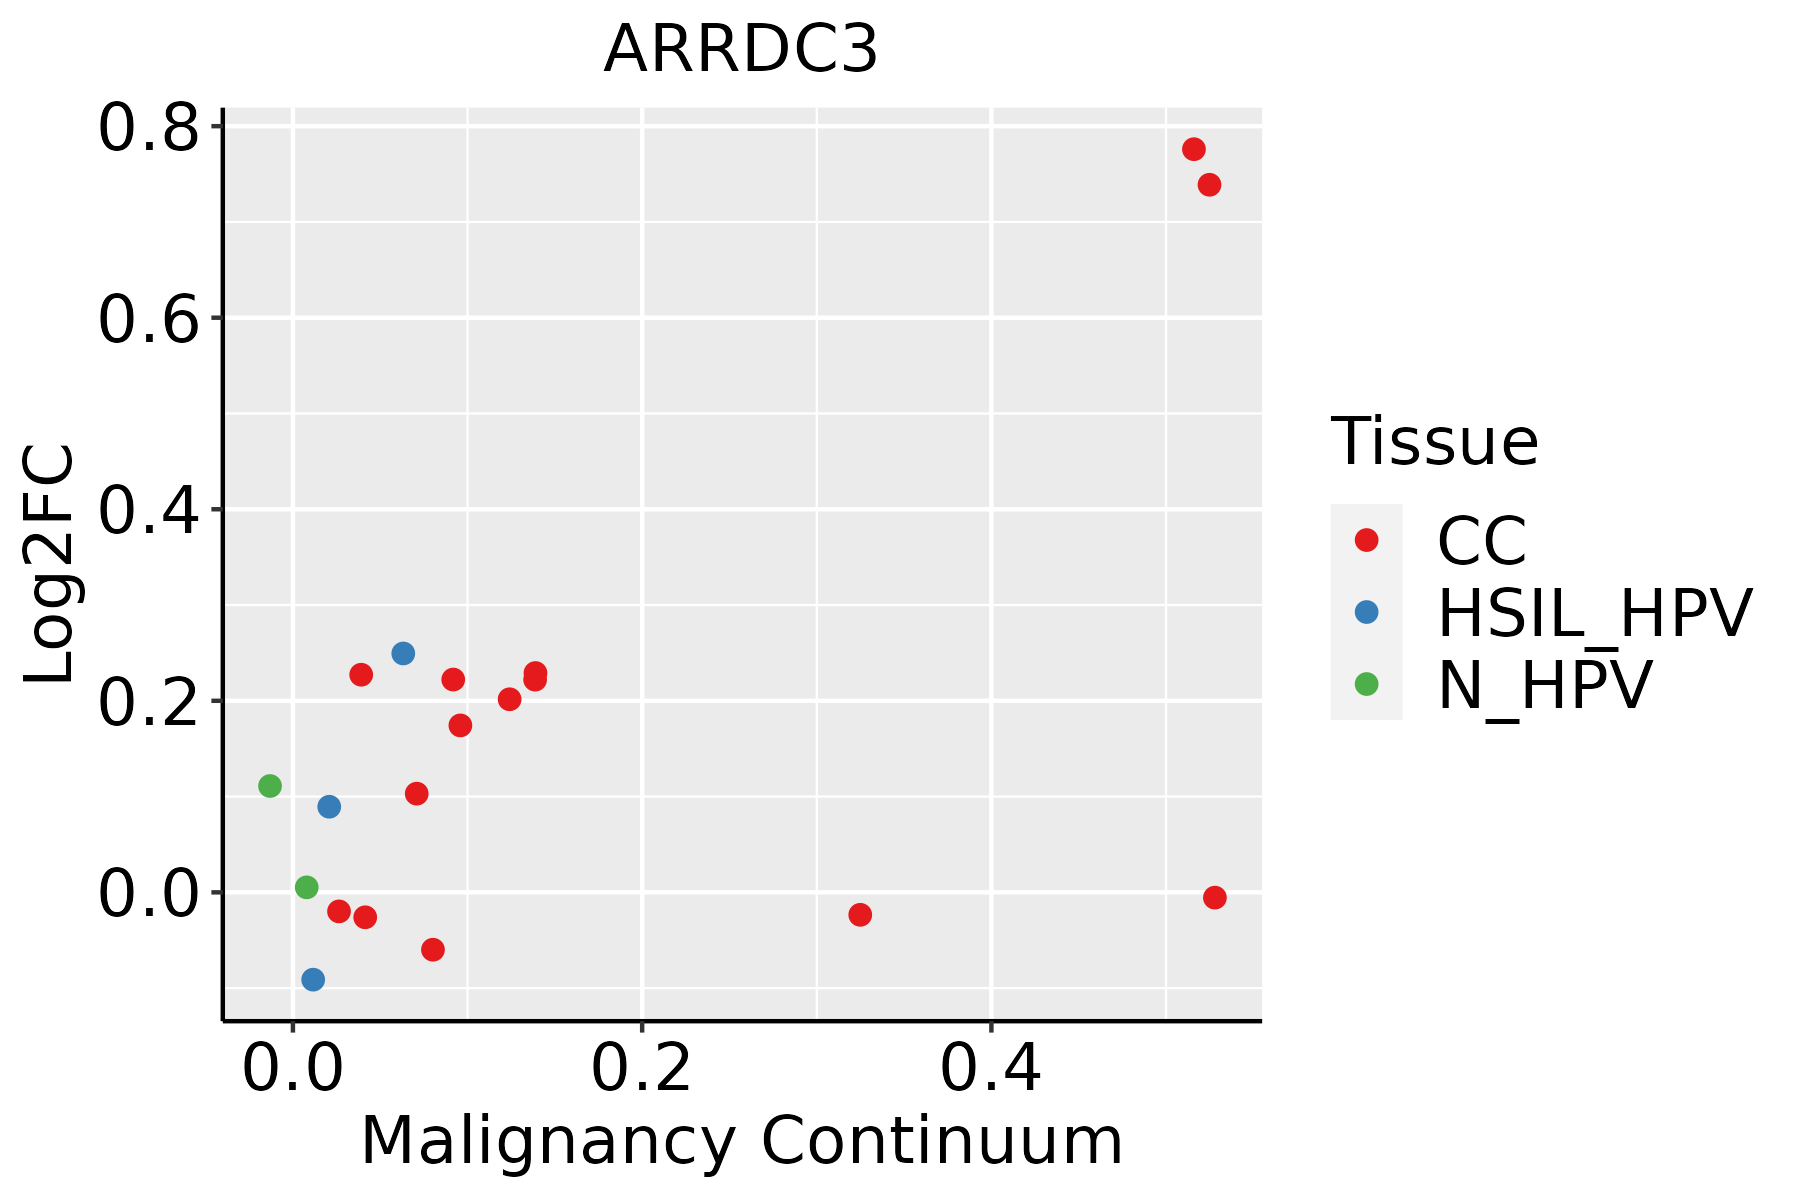 | CC: Cervix cancer |
| HSIL_HPV: HPV-infected high-grade squamous intraepithelial lesions |
| N_HPV: HPV-infected normal cervix |
| Lung |  | AAH: Atypical adenomatous hyperplasia |
| AIS: Adenocarcinoma in situ |
| IAC: Invasive lung adenocarcinoma |
| MIA: Minimally invasive adenocarcinoma |
| Prostate | 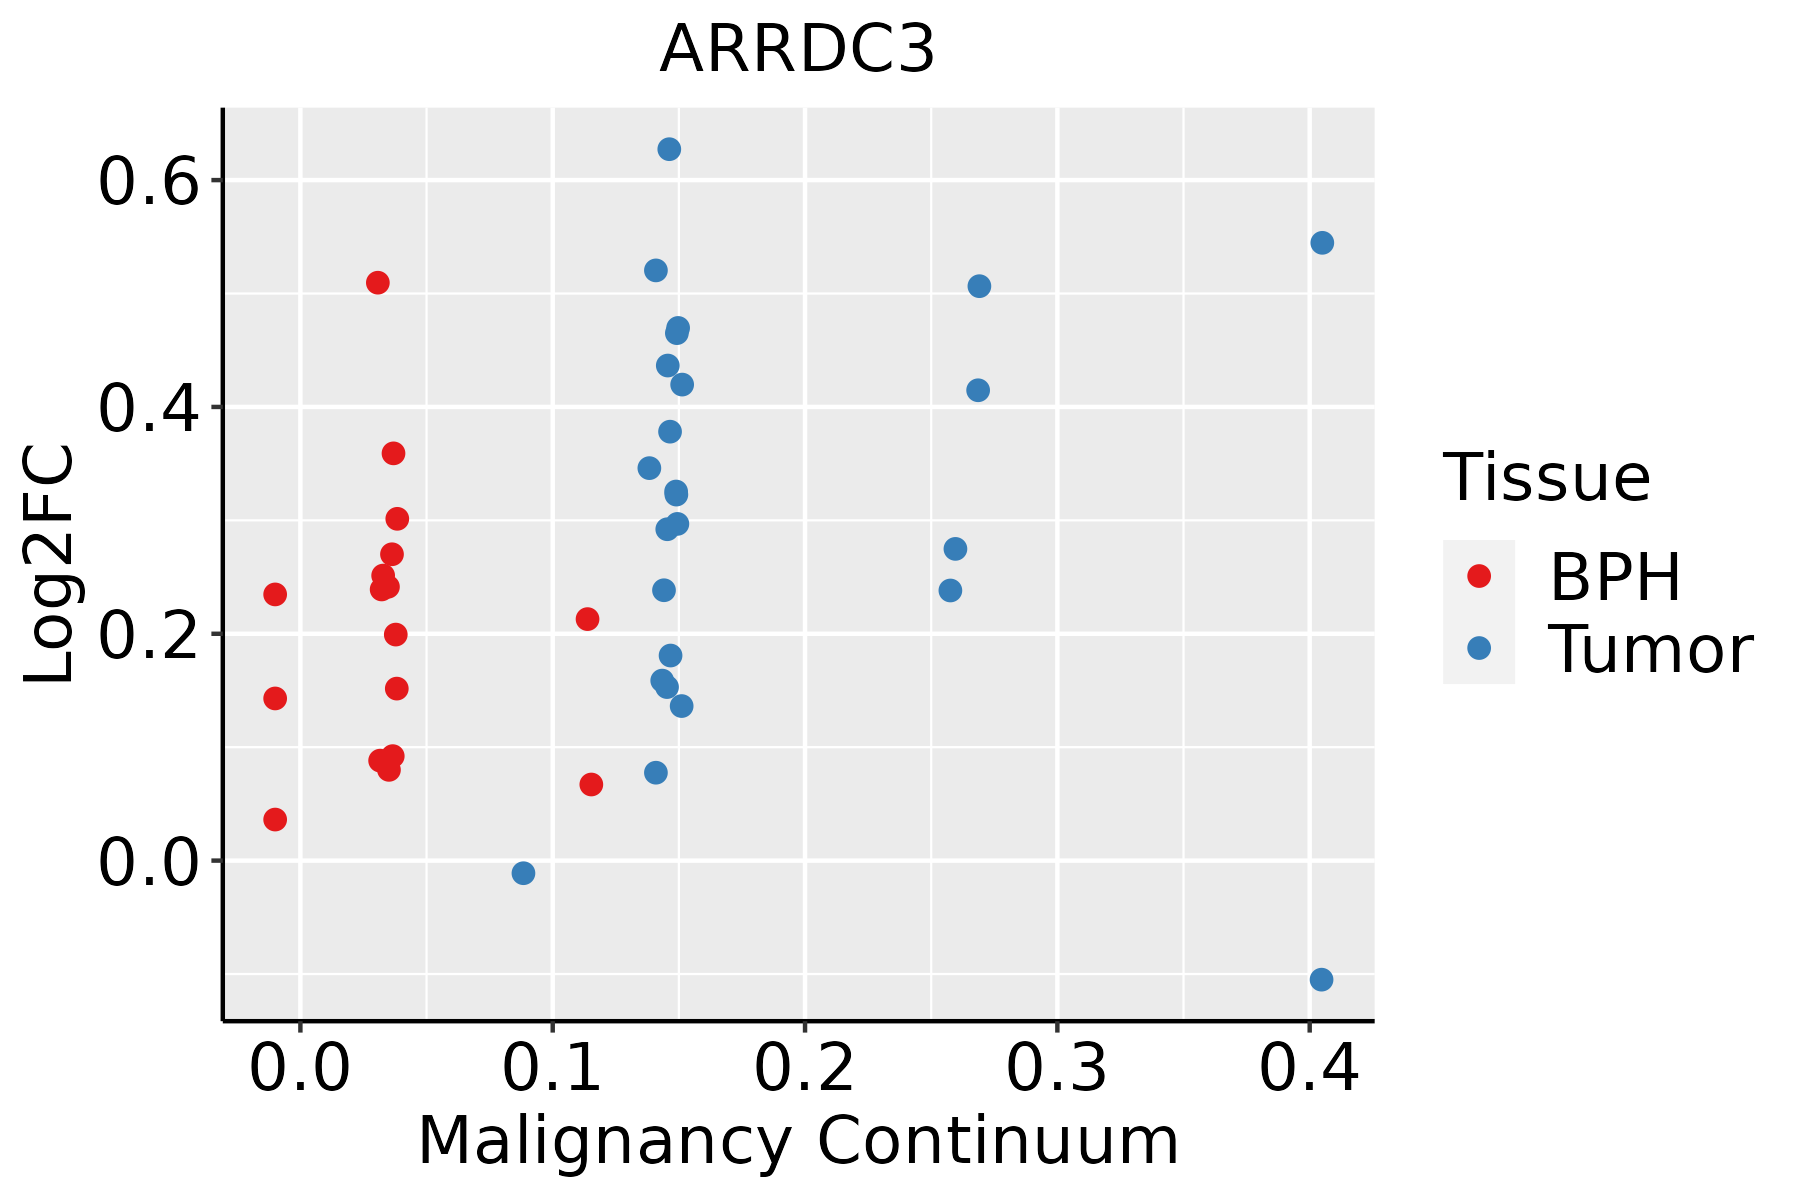 | BPH: Benign Prostatic Hyperplasia |
| Thyroid |  | ATC: Anaplastic thyroid cancer |
| HT: Hashimoto's thyroiditis |
| PTC: Papillary thyroid cancer |
| GO ID | Tissue | Disease Stage | Description | Gene Ratio | Bg Ratio | pvalue | p.adjust | Count |
| GO:00435884 | Cervix | CC | skin development | 71/2311 | 263/18723 | 8.04e-11 | 1.46e-08 | 71 |
| GO:190332010 | Cervix | CC | regulation of protein modification by small protein conjugation or removal | 66/2311 | 242/18723 | 2.31e-10 | 3.46e-08 | 66 |
| GO:003139610 | Cervix | CC | regulation of protein ubiquitination | 59/2311 | 210/18723 | 5.90e-10 | 7.51e-08 | 59 |
| GO:00400133 | Cervix | CC | negative regulation of locomotion | 76/2311 | 391/18723 | 3.47e-05 | 5.60e-04 | 76 |
| GO:00514387 | Cervix | CC | regulation of ubiquitin-protein transferase activity | 18/2311 | 53/18723 | 3.69e-05 | 5.84e-04 | 18 |
| GO:00313983 | Cervix | CC | positive regulation of protein ubiquitination | 25/2311 | 119/18723 | 5.09e-03 | 3.01e-02 | 25 |
| GO:19033224 | Cervix | CC | positive regulation of protein modification by small protein conjugation or removal | 28/2311 | 138/18723 | 5.26e-03 | 3.08e-02 | 28 |
| GO:003139615 | Cervix | HSIL_HPV | regulation of protein ubiquitination | 33/737 | 210/18723 | 1.02e-11 | 6.81e-09 | 33 |
| GO:190332015 | Cervix | HSIL_HPV | regulation of protein modification by small protein conjugation or removal | 34/737 | 242/18723 | 1.16e-10 | 4.31e-08 | 34 |
| GO:004358813 | Cervix | HSIL_HPV | skin development | 31/737 | 263/18723 | 5.32e-08 | 3.89e-06 | 31 |
| GO:005143815 | Cervix | HSIL_HPV | regulation of ubiquitin-protein transferase activity | 11/737 | 53/18723 | 5.49e-06 | 2.07e-04 | 11 |
| GO:003139812 | Cervix | HSIL_HPV | positive regulation of protein ubiquitination | 13/737 | 119/18723 | 8.24e-04 | 1.07e-02 | 13 |
| GO:190332212 | Cervix | HSIL_HPV | positive regulation of protein modification by small protein conjugation or removal | 13/737 | 138/18723 | 3.16e-03 | 2.88e-02 | 13 |
| GO:19033208 | Lung | IAC | regulation of protein modification by small protein conjugation or removal | 64/2061 | 242/18723 | 1.38e-11 | 4.83e-09 | 64 |
| GO:00313968 | Lung | IAC | regulation of protein ubiquitination | 53/2061 | 210/18723 | 4.65e-09 | 7.07e-07 | 53 |
| GO:19033223 | Lung | IAC | positive regulation of protein modification by small protein conjugation or removal | 31/2061 | 138/18723 | 8.03e-05 | 1.65e-03 | 31 |
| GO:00435882 | Lung | IAC | skin development | 49/2061 | 263/18723 | 1.56e-04 | 2.82e-03 | 49 |
| GO:00313982 | Lung | IAC | positive regulation of protein ubiquitination | 26/2061 | 119/18723 | 4.61e-04 | 6.77e-03 | 26 |
| GO:00514385 | Lung | IAC | regulation of ubiquitin-protein transferase activity | 14/2061 | 53/18723 | 1.39e-03 | 1.53e-02 | 14 |
| GO:0040013 | Lung | IAC | negative regulation of locomotion | 60/2061 | 391/18723 | 4.94e-03 | 3.78e-02 | 60 |
| Hugo Symbol | Variant Class | Variant Classification | dbSNP RS | HGVSc | HGVSp | HGVSp Short | SWISSPROT | BIOTYPE | SIFT | PolyPhen | Tumor Sample Barcode | Tissue | Histology | Sex | Age | Stage | Therapy Types | Drugs | Outcome |
| ARRDC3 | SNV | Missense_Mutation | | c.1030N>A | p.Glu344Lys | p.E344K | Q96B67 | protein_coding | deleterious(0) | benign(0.239) | TCGA-A8-A094-01 | Breast | breast invasive carcinoma | Female | >=65 | I/II | Unknown | Unknown | SD |
| ARRDC3 | SNV | Missense_Mutation | novel | c.49N>C | p.Asn17His | p.N17H | Q96B67 | protein_coding | tolerated(0.05) | possibly_damaging(0.9) | TCGA-AN-A049-01 | Breast | breast invasive carcinoma | Female | <65 | I/II | Unknown | Unknown | SD |
| ARRDC3 | SNV | Missense_Mutation | | c.643G>C | p.Glu215Gln | p.E215Q | Q96B67 | protein_coding | deleterious(0.01) | probably_damaging(0.995) | TCGA-E9-A1ND-01 | Breast | breast invasive carcinoma | Female | >=65 | I/II | Hormone Therapy | aromasin | SD |
| ARRDC3 | SNV | Missense_Mutation | rs771246835 | c.829N>G | p.Ile277Val | p.I277V | Q96B67 | protein_coding | deleterious(0.04) | probably_damaging(0.956) | TCGA-E9-A1RG-01 | Breast | breast invasive carcinoma | Female | <65 | III/IV | Hormone Therapy | tamoxiphen | SD |
| ARRDC3 | deletion | In_Frame_Del | novel | c.445_465delNNNNNNNNNNNNNNNNNNNNN | p.Pro149_Glu155del | p.P149_E155del | Q96B67 | protein_coding | | | TCGA-A8-A0A4-01 | Breast | breast invasive carcinoma | Female | >=65 | I/II | Hormone Therapy | tamoxiphen | CR |
| ARRDC3 | insertion | Frame_Shift_Ins | novel | c.666_667insTG | p.Val223TrpfsTer19 | p.V223Wfs*19 | Q96B67 | protein_coding | | | TCGA-B6-A1KF-01 | Breast | breast invasive carcinoma | Female | >=65 | I/II | Unknown | Unknown | SD |
| ARRDC3 | deletion | Frame_Shift_Del | novel | c.893delN | p.Ala298ValfsTer27 | p.A298Vfs*27 | Q96B67 | protein_coding | | | TCGA-EW-A2FV-01 | Breast | breast invasive carcinoma | Female | <65 | III/IV | Chemotherapy | docetaxel | SD |
| ARRDC3 | SNV | Missense_Mutation | | c.1186G>A | p.Glu396Lys | p.E396K | Q96B67 | protein_coding | deleterious(0) | probably_damaging(0.956) | TCGA-C5-A8YR-01 | Cervix | cervical & endocervical cancer | Female | <65 | I/II | Unknown | Unknown | PD |
| ARRDC3 | deletion | Frame_Shift_Del | novel | c.571delA | p.Ile191TyrfsTer3 | p.I191Yfs*3 | Q96B67 | protein_coding | | | TCGA-EK-A2PL-01 | Cervix | cervical & endocervical cancer | Female | <65 | III/IV | Unknown | Unknown | SD |
| ARRDC3 | SNV | Missense_Mutation | | c.1009T>G | p.Leu337Val | p.L337V | Q96B67 | protein_coding | tolerated(0.09) | benign(0) | TCGA-AA-3977-01 | Colorectum | colon adenocarcinoma | Male | >=65 | I/II | Unknown | Unknown | SD |


