
|
|||||
|
 | |
| |
| |
| |
| |
| |
|
Gene: ARRDC2 |
Gene summary for ARRDC2 |
| Gene information | Species | Human | Gene symbol | ARRDC2 | Gene ID | 27106 |
| Gene name | arrestin domain containing 2 | |
| Gene Alias | CLONE24945 | |
| Cytomap | 19p13.11 | |
| Gene Type | protein-coding | GO ID | GO:0006810 | UniProtAcc | Q8TBH0 |
Top |
Malignant transformation analysis |
| Identification of the aberrant gene expression in precancerous and cancerous lesions by comparing the gene expression of stem-like cells in diseased tissues with normal stem cells |
| Entrez ID | Symbol | Replicates | Species | Organ | Tissue | Adj P-value | Log2FC | Malignancy |
| 27106 | ARRDC2 | LZE24T | Human | Esophagus | ESCC | 5.81e-03 | 4.06e-01 | 0.0596 |
| 27106 | ARRDC2 | P1T-E | Human | Esophagus | ESCC | 1.31e-04 | 7.04e-01 | 0.0875 |
| 27106 | ARRDC2 | P2T-E | Human | Esophagus | ESCC | 1.83e-13 | 1.05e-01 | 0.1177 |
| 27106 | ARRDC2 | P4T-E | Human | Esophagus | ESCC | 1.21e-05 | 2.14e-01 | 0.1323 |
| 27106 | ARRDC2 | P5T-E | Human | Esophagus | ESCC | 3.54e-12 | 1.95e-01 | 0.1327 |
| 27106 | ARRDC2 | P8T-E | Human | Esophagus | ESCC | 1.31e-06 | 5.57e-02 | 0.0889 |
| 27106 | ARRDC2 | P9T-E | Human | Esophagus | ESCC | 1.38e-05 | 7.84e-02 | 0.1131 |
| 27106 | ARRDC2 | P10T-E | Human | Esophagus | ESCC | 5.04e-11 | 7.46e-02 | 0.116 |
| 27106 | ARRDC2 | P11T-E | Human | Esophagus | ESCC | 1.48e-07 | 3.31e-01 | 0.1426 |
| 27106 | ARRDC2 | P15T-E | Human | Esophagus | ESCC | 4.84e-04 | 7.37e-02 | 0.1149 |
| 27106 | ARRDC2 | P16T-E | Human | Esophagus | ESCC | 1.81e-03 | 3.29e-02 | 0.1153 |
| 27106 | ARRDC2 | P21T-E | Human | Esophagus | ESCC | 9.30e-06 | 1.16e-01 | 0.1617 |
| 27106 | ARRDC2 | P23T-E | Human | Esophagus | ESCC | 5.53e-06 | 2.66e-01 | 0.108 |
| 27106 | ARRDC2 | P24T-E | Human | Esophagus | ESCC | 4.25e-03 | 1.39e-01 | 0.1287 |
| 27106 | ARRDC2 | P26T-E | Human | Esophagus | ESCC | 2.79e-09 | 3.92e-02 | 0.1276 |
| 27106 | ARRDC2 | P27T-E | Human | Esophagus | ESCC | 5.10e-04 | 4.67e-02 | 0.1055 |
| 27106 | ARRDC2 | P28T-E | Human | Esophagus | ESCC | 3.55e-12 | 3.07e-01 | 0.1149 |
| 27106 | ARRDC2 | P31T-E | Human | Esophagus | ESCC | 1.04e-05 | 9.77e-02 | 0.1251 |
| 27106 | ARRDC2 | P32T-E | Human | Esophagus | ESCC | 4.90e-05 | 7.20e-03 | 0.1666 |
| 27106 | ARRDC2 | P37T-E | Human | Esophagus | ESCC | 1.21e-05 | 1.20e-01 | 0.1371 |
| Page: 1 2 3 4 |
| Tissue | Expression Dynamics | Abbreviation |
| Esophagus | 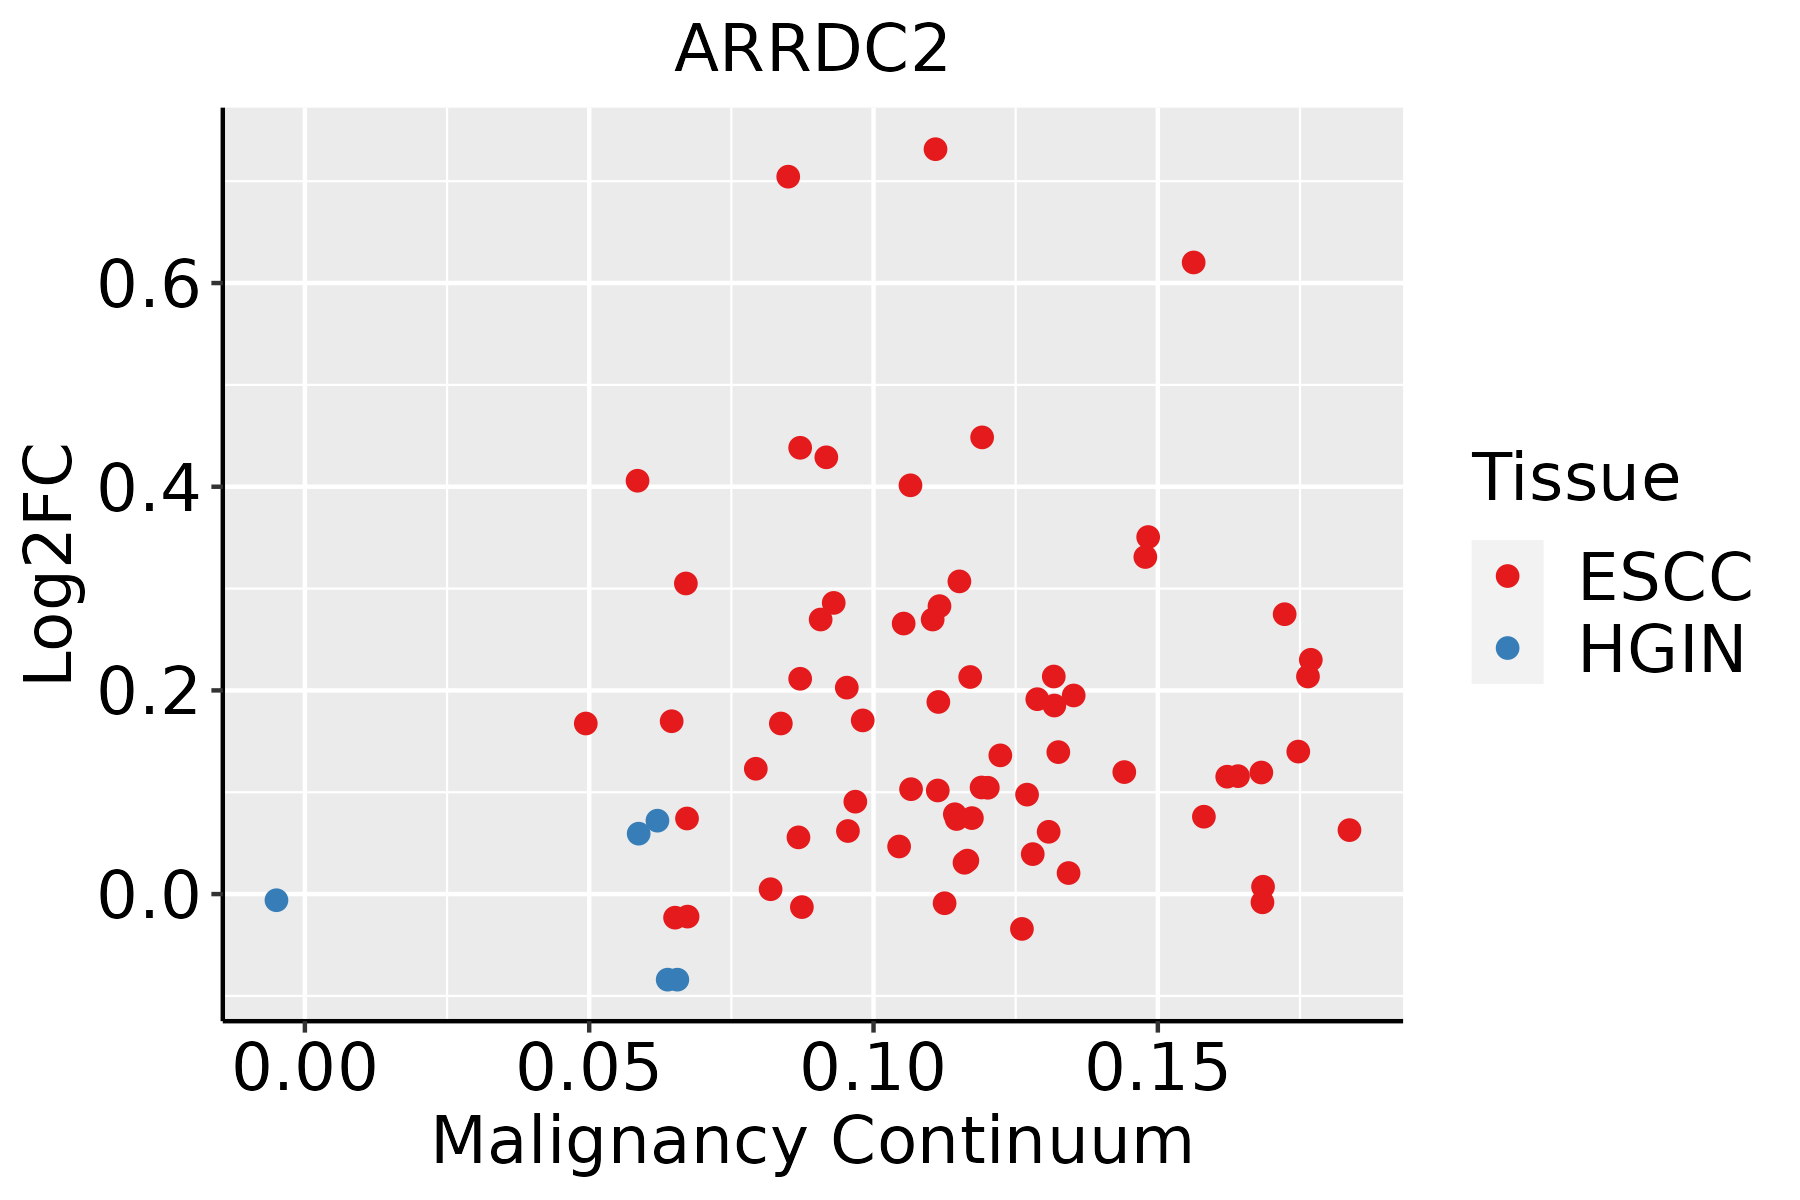 | ESCC: Esophageal squamous cell carcinoma |
| HGIN: High-grade intraepithelial neoplasias | ||
| LGIN: Low-grade intraepithelial neoplasias | ||
| Liver |  | HCC: Hepatocellular carcinoma |
| NAFLD: Non-alcoholic fatty liver disease | ||
| Oral Cavity | 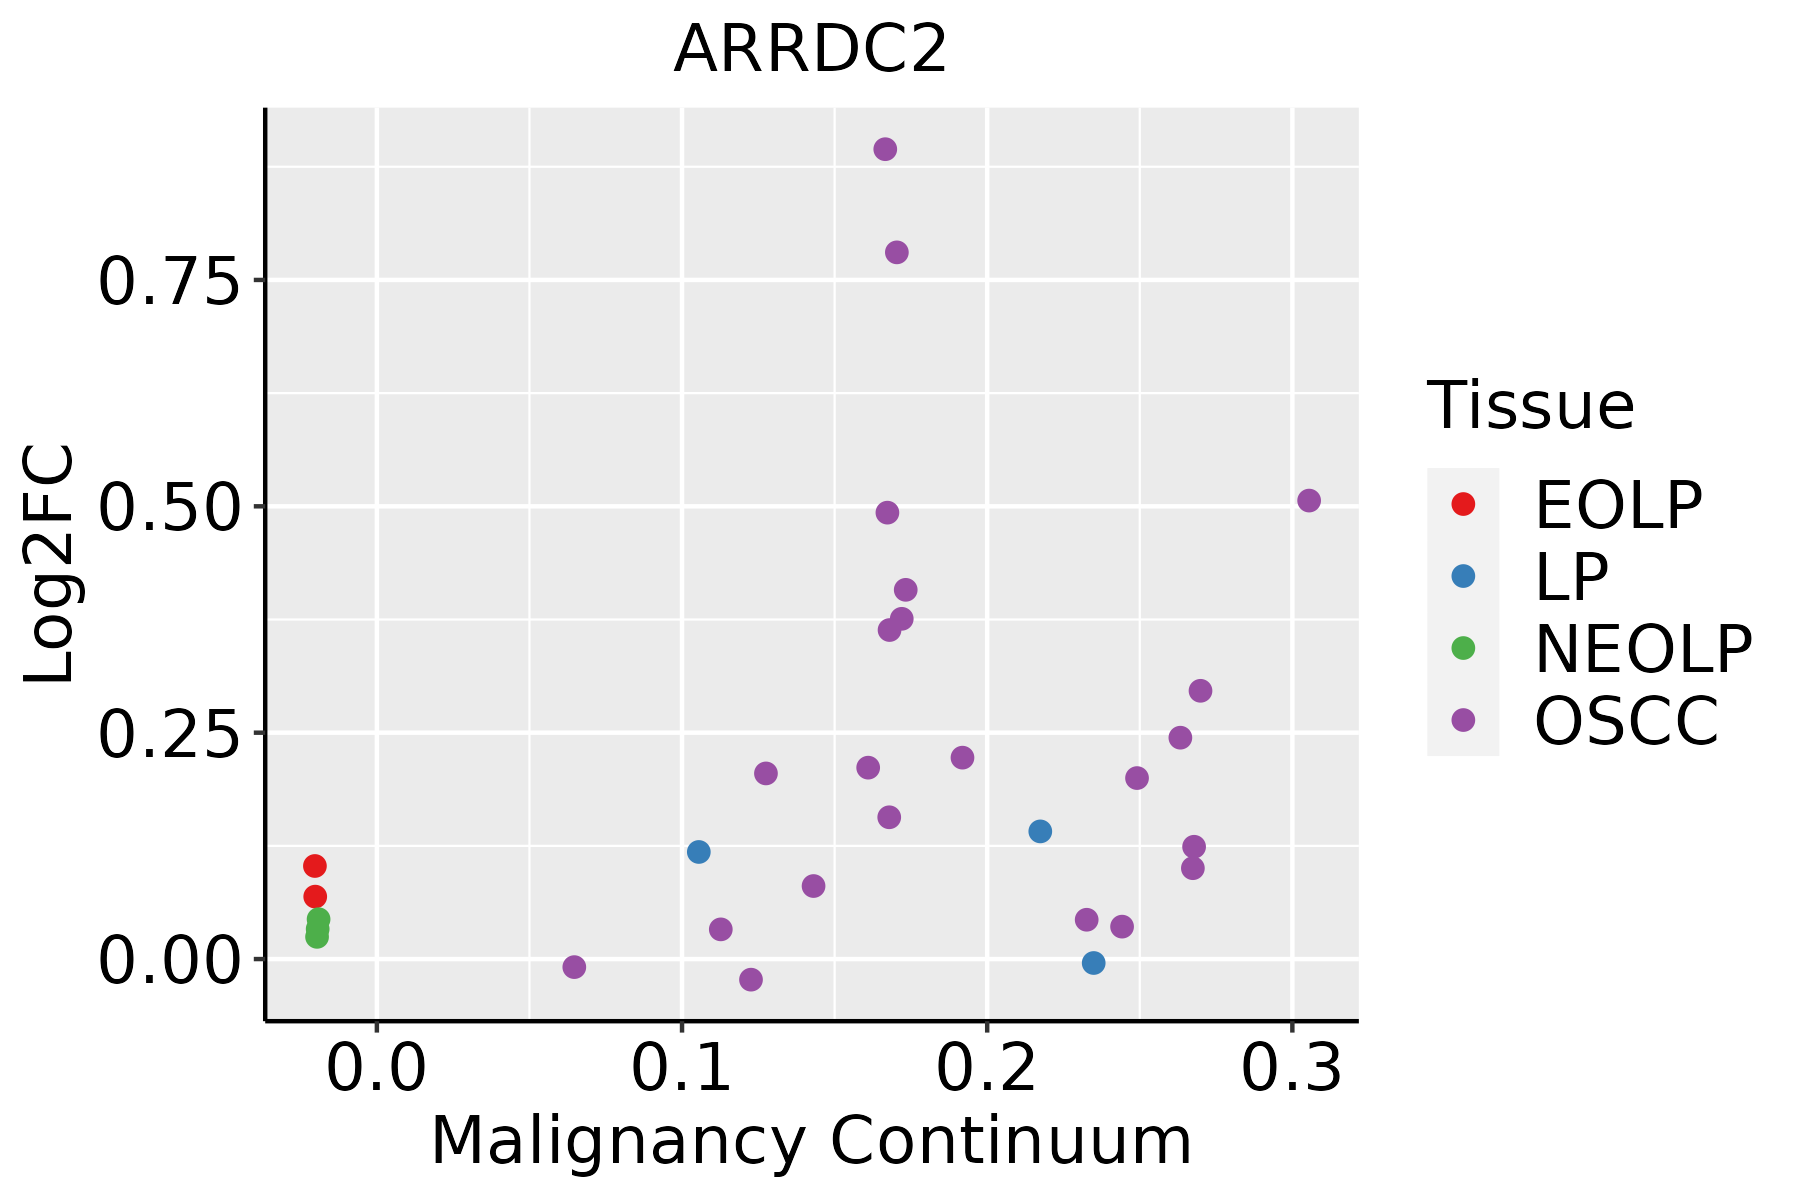 | EOLP: Erosive Oral lichen planus |
| LP: leukoplakia | ||
| NEOLP: Non-erosive oral lichen planus | ||
| OSCC: Oral squamous cell carcinoma | ||
| Prostate |  | BPH: Benign Prostatic Hyperplasia |
| Thyroid | 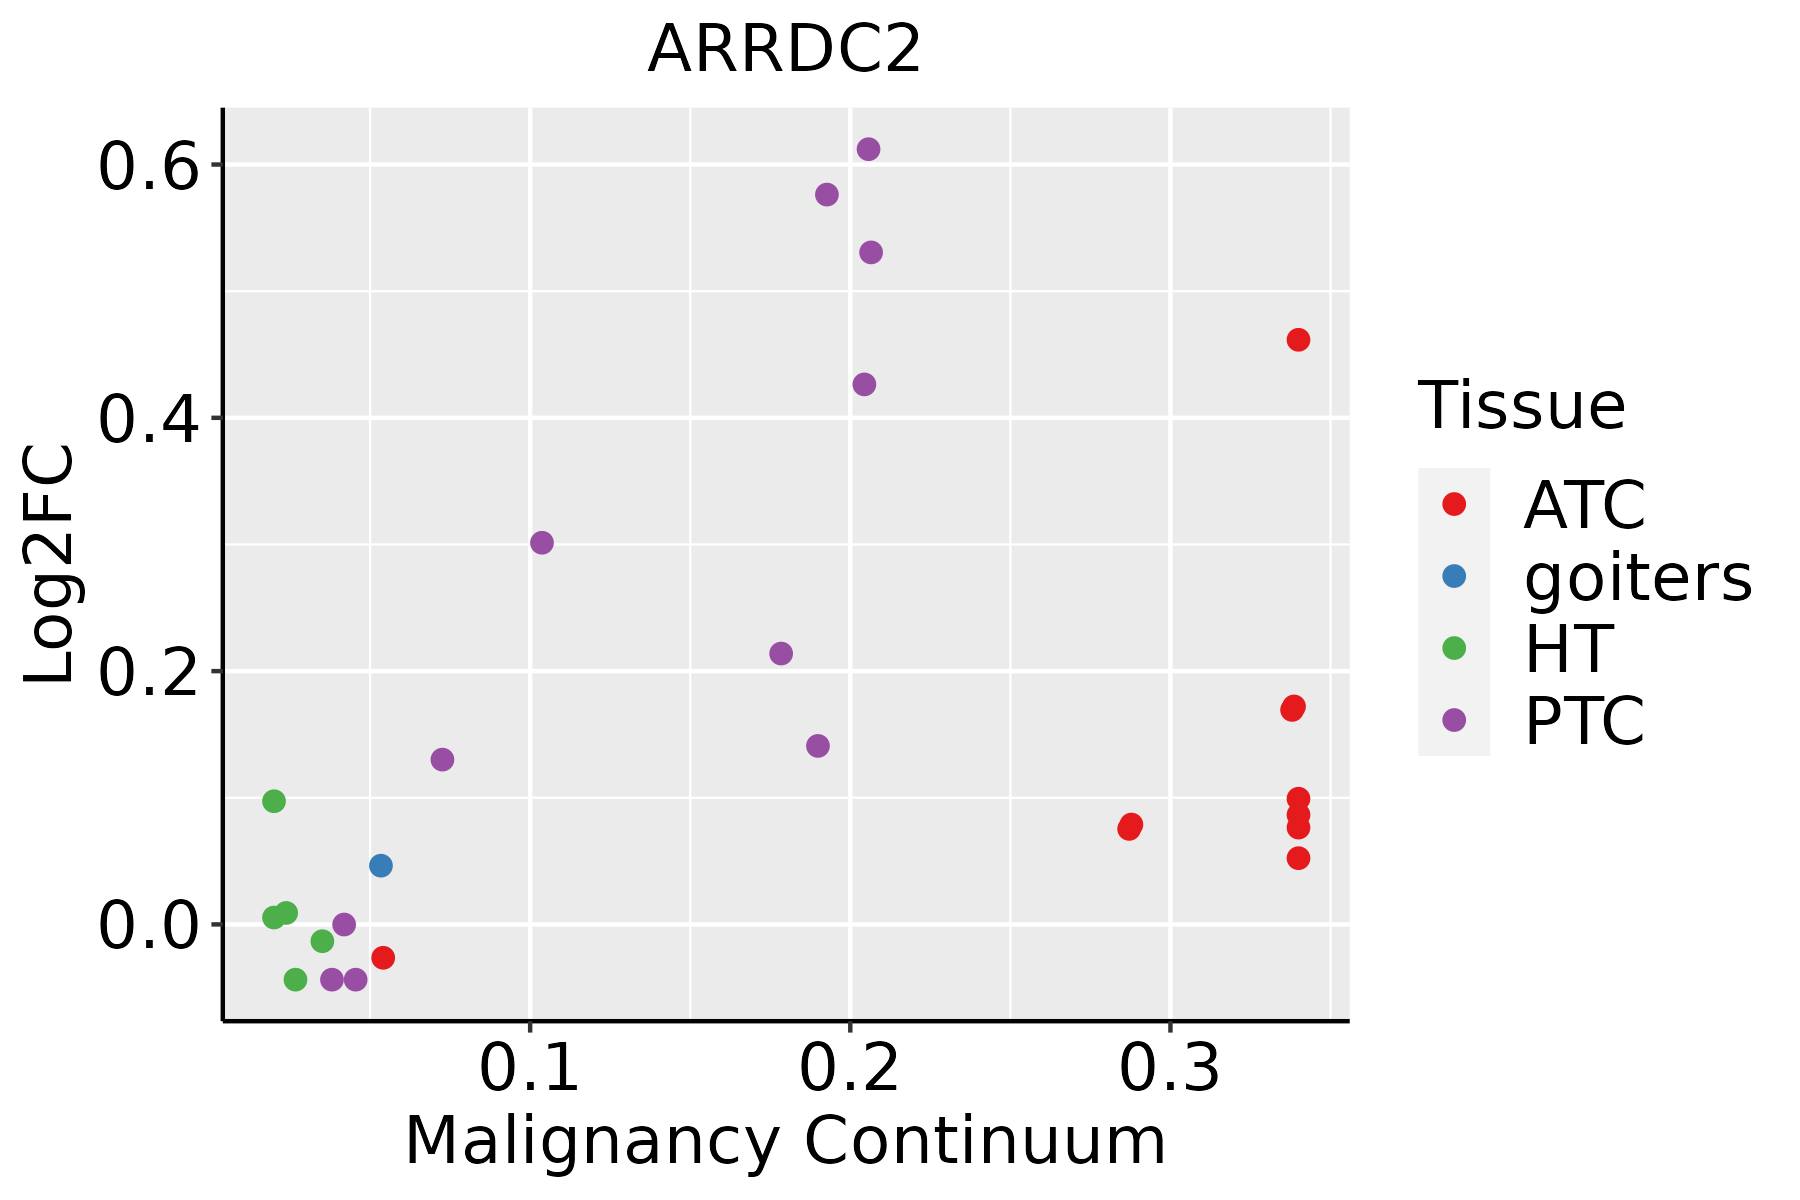 | ATC: Anaplastic thyroid cancer |
| HT: Hashimoto's thyroiditis | ||
| PTC: Papillary thyroid cancer |
| ∗log2FC in expression of this searched gene in stem-like cells from each diseased tissue sample relative to stem-like cells in normal samples in each tissue plotted against the malignancy continuum. Samples are colored based on if they are from different disease stage. |
Top |
Malignant transformation related pathway analysis |
| Find out the enriched GO biological processes and KEGG pathways involved in transition from healthy to precancer to cancer |
| Tissue | Disease Stage | Enriched GO biological Processes |
| Colorectum | AD |  |
| Colorectum | SER |  |
| Colorectum | MSS |  |
| Colorectum | MSI-H |  |
| Colorectum | FAP |  |
| ∗Top 15 enriched GO BP terms are showed in the bar plot of each disease state in each tissue. Each row represents a significant GO biological process which is colored according to the -log10(p.adjust). |
| Page: 1 2 3 4 5 6 7 8 9 |
| GO ID | Tissue | Disease Stage | Description | Gene Ratio | Bg Ratio | pvalue | p.adjust | Count |
| Page: 1 |
| Pathway ID | Tissue | Disease Stage | Description | Gene Ratio | Bg Ratio | pvalue | p.adjust | qvalue | Count |
| Page: 1 |
Top |
Cell-cell communication analysis |
| Identification of potential cell-cell interactions between two cell types and their ligand-receptor pairs for different disease states |
| Ligand | Receptor | LRpair | Pathway | Tissue | Disease Stage |
| Page: 1 |
Top |
Single-cell gene regulatory network inference analysis |
| Find out the significant the regulons (TFs) and the target genes of each regulon across cell types for different disease states |
| TF | Cell Type | Tissue | Disease Stage | Target Gene | RSS | Regulon Activity |
| ∗The dot plots of a searched regulon are shown for all cell subpopulations in each disease state of each tissue based on the regulon specific score inferred using pySCENIC and by calculating the average expression. |
| Page: 1 |
Top |
Somatic mutation of malignant transformation related genes |
| Annotation of somatic variants for genes involved in malignant transformation |
| Hugo Symbol | Variant Class | Variant Classification | dbSNP RS | HGVSc | HGVSp | HGVSp Short | SWISSPROT | BIOTYPE | SIFT | PolyPhen | Tumor Sample Barcode | Tissue | Histology | Sex | Age | Stage | Therapy Types | Drugs | Outcome |
| ARRDC2 | SNV | Missense_Mutation | novel | c.313G>A | p.Glu105Lys | p.E105K | Q8TBH0 | protein_coding | deleterious(0.03) | probably_damaging(0.97) | TCGA-AO-A0J9-01 | Breast | breast invasive carcinoma | Female | <65 | III/IV | Chemotherapy | cyclophosphamide | PD |
| ARRDC2 | SNV | Missense_Mutation | rs767544568 | c.508N>T | p.Arg170Trp | p.R170W | Q8TBH0 | protein_coding | deleterious(0) | possibly_damaging(0.487) | TCGA-LD-A74U-01 | Breast | breast invasive carcinoma | Female | >=65 | III/IV | Chemotherapy | taxotere | SD |
| ARRDC2 | SNV | Missense_Mutation | novel | c.382N>T | p.Arg128Cys | p.R128C | Q8TBH0 | protein_coding | deleterious(0.04) | probably_damaging(1) | TCGA-2W-A8YY-01 | Cervix | cervical & endocervical cancer | Female | <65 | I/II | Chemotherapy | cisplatin | CR |
| ARRDC2 | SNV | Missense_Mutation | rs757322276 | c.1141N>T | p.Arg381Cys | p.R381C | Q8TBH0 | protein_coding | deleterious(0) | probably_damaging(0.999) | TCGA-2W-A8YY-01 | Cervix | cervical & endocervical cancer | Female | <65 | I/II | Chemotherapy | cisplatin | CR |
| ARRDC2 | SNV | Missense_Mutation | c.1009N>C | p.Glu337Gln | p.E337Q | Q8TBH0 | protein_coding | deleterious(0) | probably_damaging(0.998) | TCGA-FU-A40J-01 | Cervix | cervical & endocervical cancer | Female | <65 | III/IV | Chemotherapy | carboplatin | CR | |
| ARRDC2 | SNV | Missense_Mutation | c.1108N>A | p.Glu370Lys | p.E370K | Q8TBH0 | protein_coding | tolerated(0.32) | possibly_damaging(0.577) | TCGA-FU-A40J-01 | Cervix | cervical & endocervical cancer | Female | <65 | III/IV | Chemotherapy | carboplatin | CR | |
| ARRDC2 | SNV | Missense_Mutation | c.316N>C | p.Phe106Leu | p.F106L | Q8TBH0 | protein_coding | deleterious(0.02) | possibly_damaging(0.897) | TCGA-A6-5665-01 | Colorectum | colon adenocarcinoma | Female | >=65 | I/II | Unknown | Unknown | PD | |
| ARRDC2 | SNV | Missense_Mutation | rs762166660 | c.652N>T | p.Arg218Trp | p.R218W | Q8TBH0 | protein_coding | deleterious(0) | probably_damaging(0.981) | TCGA-AA-3519-01 | Colorectum | colon adenocarcinoma | Male | <65 | III/IV | Unknown | Unknown | SD |
| ARRDC2 | SNV | Missense_Mutation | c.374G>A | p.Gly125Asp | p.G125D | Q8TBH0 | protein_coding | deleterious(0) | probably_damaging(1) | TCGA-AA-3663-01 | Colorectum | colon adenocarcinoma | Male | <65 | I/II | Unknown | Unknown | SD | |
| ARRDC2 | SNV | Missense_Mutation | c.293N>T | p.Thr98Met | p.T98M | Q8TBH0 | protein_coding | tolerated(0.1) | benign(0.036) | TCGA-AZ-6601-01 | Colorectum | colon adenocarcinoma | Male | >=65 | I/II | Unknown | Unknown | PD |
| Page: 1 2 3 |
Top |
Related drugs of malignant transformation related genes |
| Identification of chemicals and drugs interact with genes involved in malignant transfromation |
| (DGIdb 4.0) |
| Entrez ID | Symbol | Category | Interaction Types | Drug Claim Name | Drug Name | PMIDs |
| Page: 1 |

Copyright 2023-Present -The University of Texas Health Science Center at Houston |