
|
|||||
|
 | |
| |
| |
| |
| |
| |
|
Gene: ARRDC1 |
Gene summary for ARRDC1 |
| Gene information | Species | Human | Gene symbol | ARRDC1 | Gene ID | 92714 |
| Gene name | arrestin domain containing 1 | |
| Gene Alias | ARRDC1 | |
| Cytomap | 9q34.3 | |
| Gene Type | protein-coding | GO ID | GO:0006464 | UniProtAcc | Q8N5I2 |
Top |
Malignant transformation analysis |
| Identification of the aberrant gene expression in precancerous and cancerous lesions by comparing the gene expression of stem-like cells in diseased tissues with normal stem cells |
| Entrez ID | Symbol | Replicates | Species | Organ | Tissue | Adj P-value | Log2FC | Malignancy |
| 92714 | ARRDC1 | LZE4T | Human | Esophagus | ESCC | 1.65e-10 | 2.74e-01 | 0.0811 |
| 92714 | ARRDC1 | LZE5T | Human | Esophagus | ESCC | 5.38e-03 | 2.48e-01 | 0.0514 |
| 92714 | ARRDC1 | LZE7T | Human | Esophagus | ESCC | 6.29e-06 | 2.59e-01 | 0.0667 |
| 92714 | ARRDC1 | LZE8T | Human | Esophagus | ESCC | 2.94e-07 | 1.56e-01 | 0.067 |
| 92714 | ARRDC1 | LZE20T | Human | Esophagus | ESCC | 1.08e-19 | 6.60e-01 | 0.0662 |
| 92714 | ARRDC1 | LZE22D1 | Human | Esophagus | HGIN | 2.99e-05 | 2.36e-01 | 0.0595 |
| 92714 | ARRDC1 | LZE22T | Human | Esophagus | ESCC | 5.07e-07 | 3.50e-01 | 0.068 |
| 92714 | ARRDC1 | LZE24T | Human | Esophagus | ESCC | 1.96e-42 | 1.05e+00 | 0.0596 |
| 92714 | ARRDC1 | LZE21T | Human | Esophagus | ESCC | 5.39e-05 | 3.49e-01 | 0.0655 |
| 92714 | ARRDC1 | P1T-E | Human | Esophagus | ESCC | 2.68e-20 | 8.15e-01 | 0.0875 |
| 92714 | ARRDC1 | P2T-E | Human | Esophagus | ESCC | 6.21e-32 | 5.19e-01 | 0.1177 |
| 92714 | ARRDC1 | P4T-E | Human | Esophagus | ESCC | 1.18e-36 | 8.18e-01 | 0.1323 |
| 92714 | ARRDC1 | P5T-E | Human | Esophagus | ESCC | 4.23e-40 | 6.89e-01 | 0.1327 |
| 92714 | ARRDC1 | P8T-E | Human | Esophagus | ESCC | 6.15e-80 | 1.50e+00 | 0.0889 |
| 92714 | ARRDC1 | P9T-E | Human | Esophagus | ESCC | 1.04e-20 | 4.01e-01 | 0.1131 |
| 92714 | ARRDC1 | P10T-E | Human | Esophagus | ESCC | 5.26e-16 | 2.51e-01 | 0.116 |
| 92714 | ARRDC1 | P11T-E | Human | Esophagus | ESCC | 3.60e-17 | 6.77e-01 | 0.1426 |
| 92714 | ARRDC1 | P12T-E | Human | Esophagus | ESCC | 1.80e-30 | 5.25e-01 | 0.1122 |
| 92714 | ARRDC1 | P15T-E | Human | Esophagus | ESCC | 2.20e-25 | 4.80e-01 | 0.1149 |
| 92714 | ARRDC1 | P16T-E | Human | Esophagus | ESCC | 9.57e-28 | 1.61e-01 | 0.1153 |
| Page: 1 2 3 4 5 6 |
| Tissue | Expression Dynamics | Abbreviation |
| Esophagus | 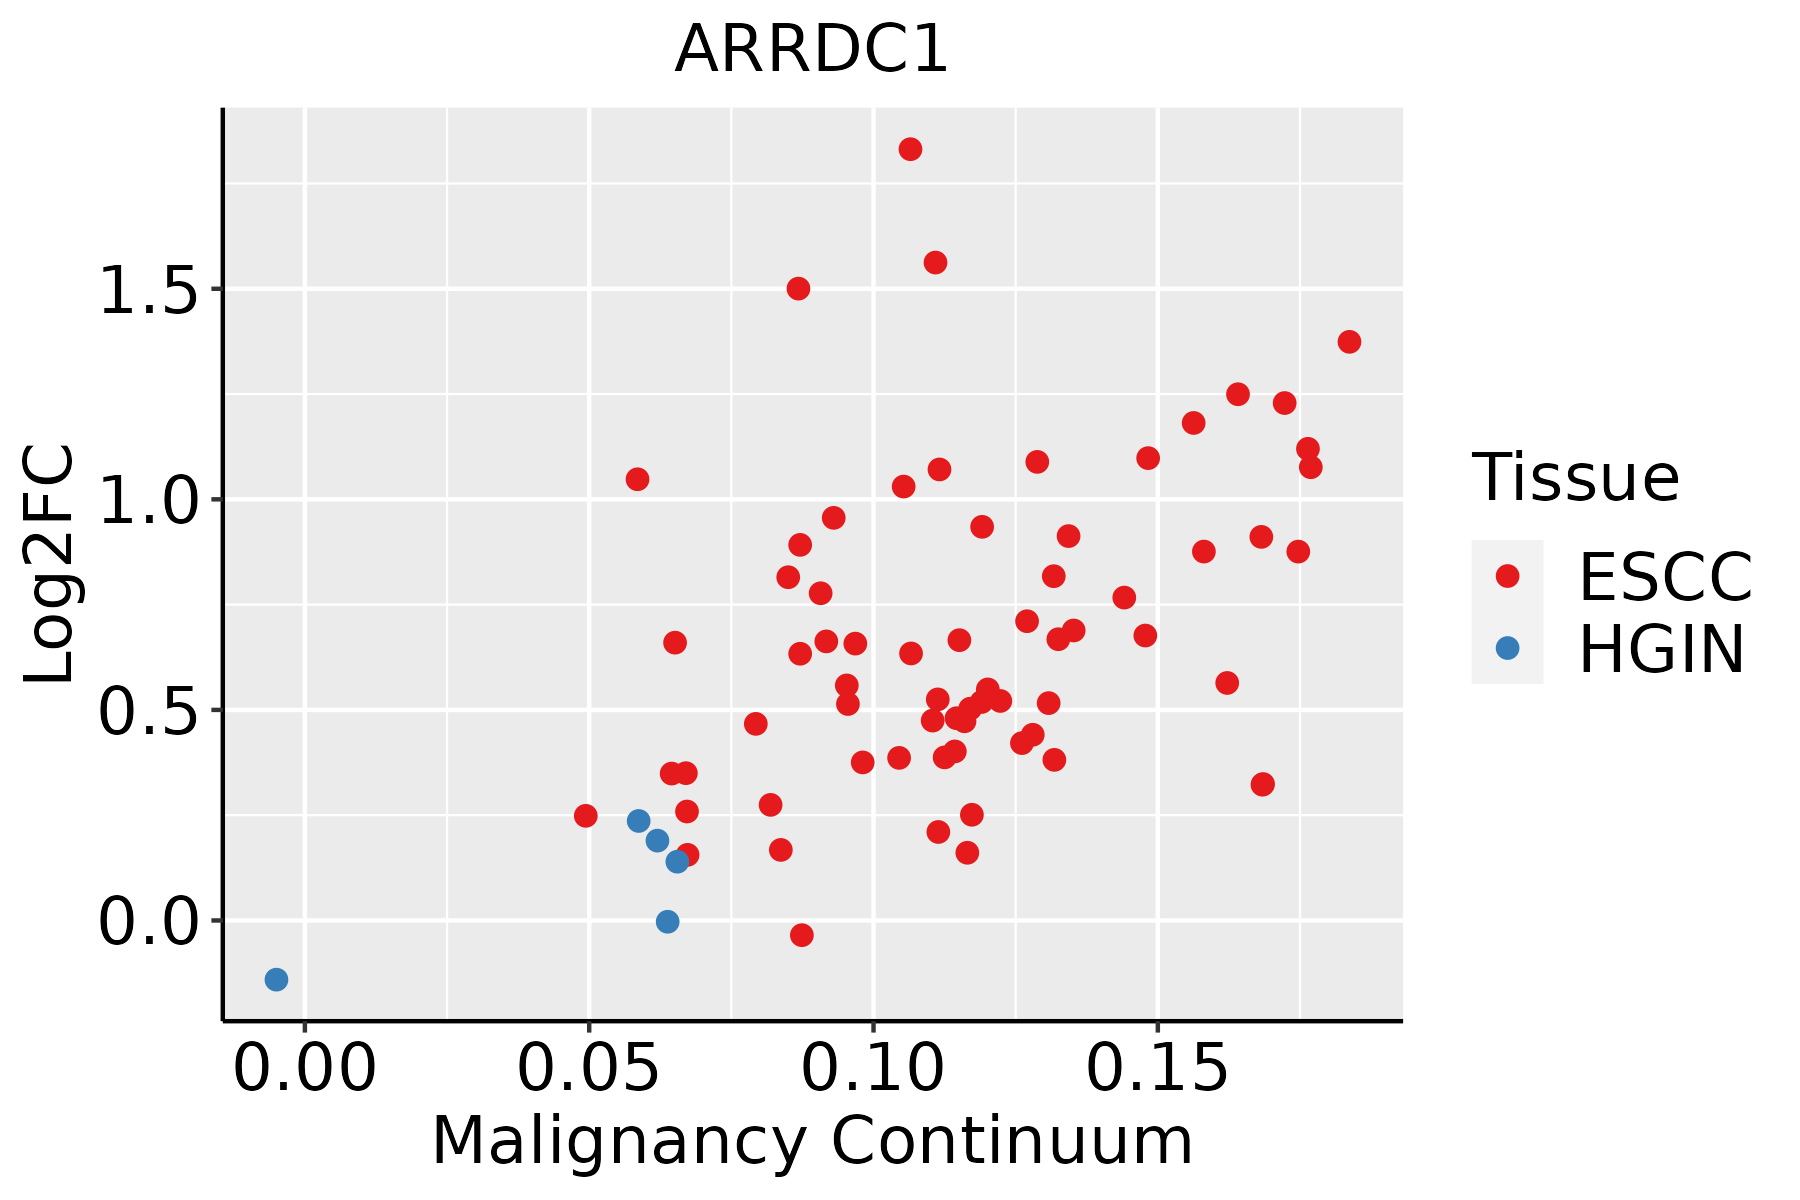 | ESCC: Esophageal squamous cell carcinoma |
| HGIN: High-grade intraepithelial neoplasias | ||
| LGIN: Low-grade intraepithelial neoplasias | ||
| Liver | 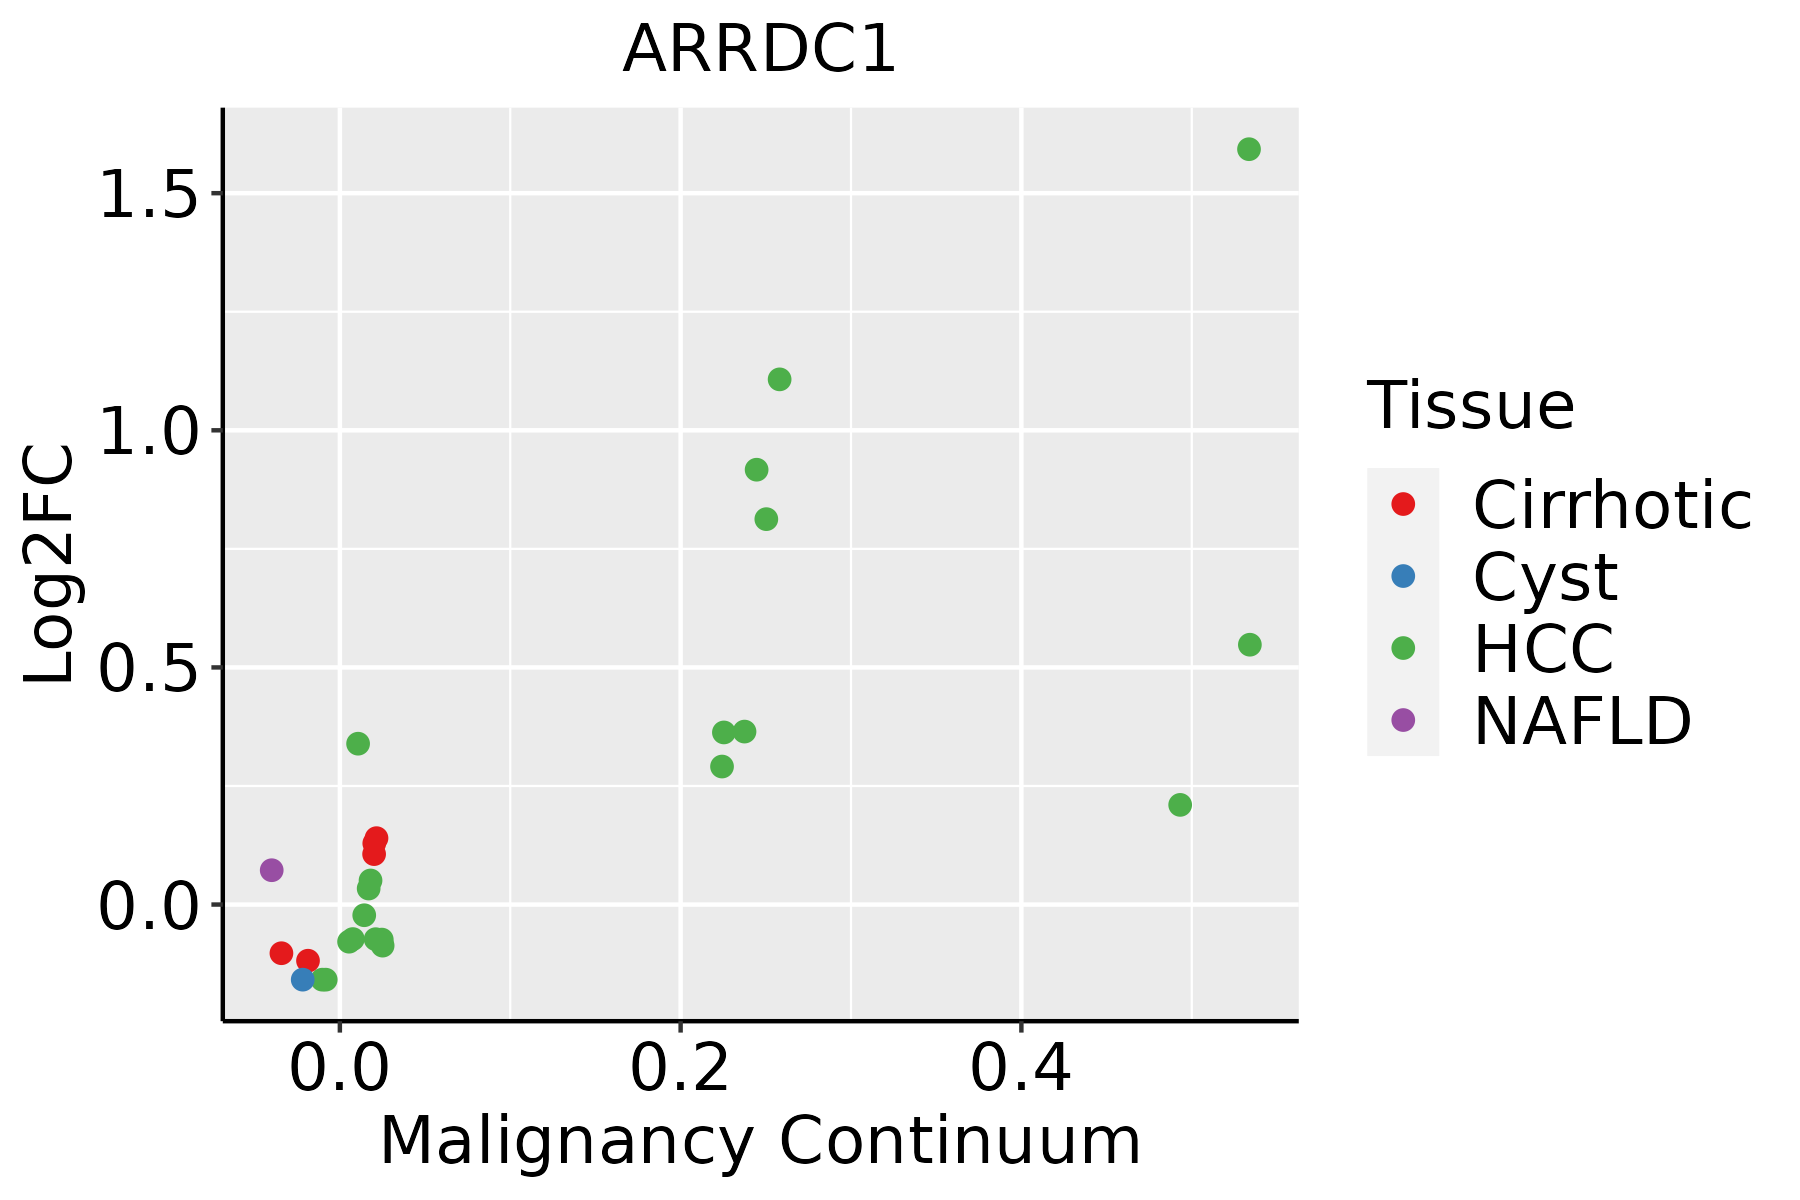 | HCC: Hepatocellular carcinoma |
| NAFLD: Non-alcoholic fatty liver disease | ||
| Oral Cavity |  | EOLP: Erosive Oral lichen planus |
| LP: leukoplakia | ||
| NEOLP: Non-erosive oral lichen planus | ||
| OSCC: Oral squamous cell carcinoma | ||
| Prostate | 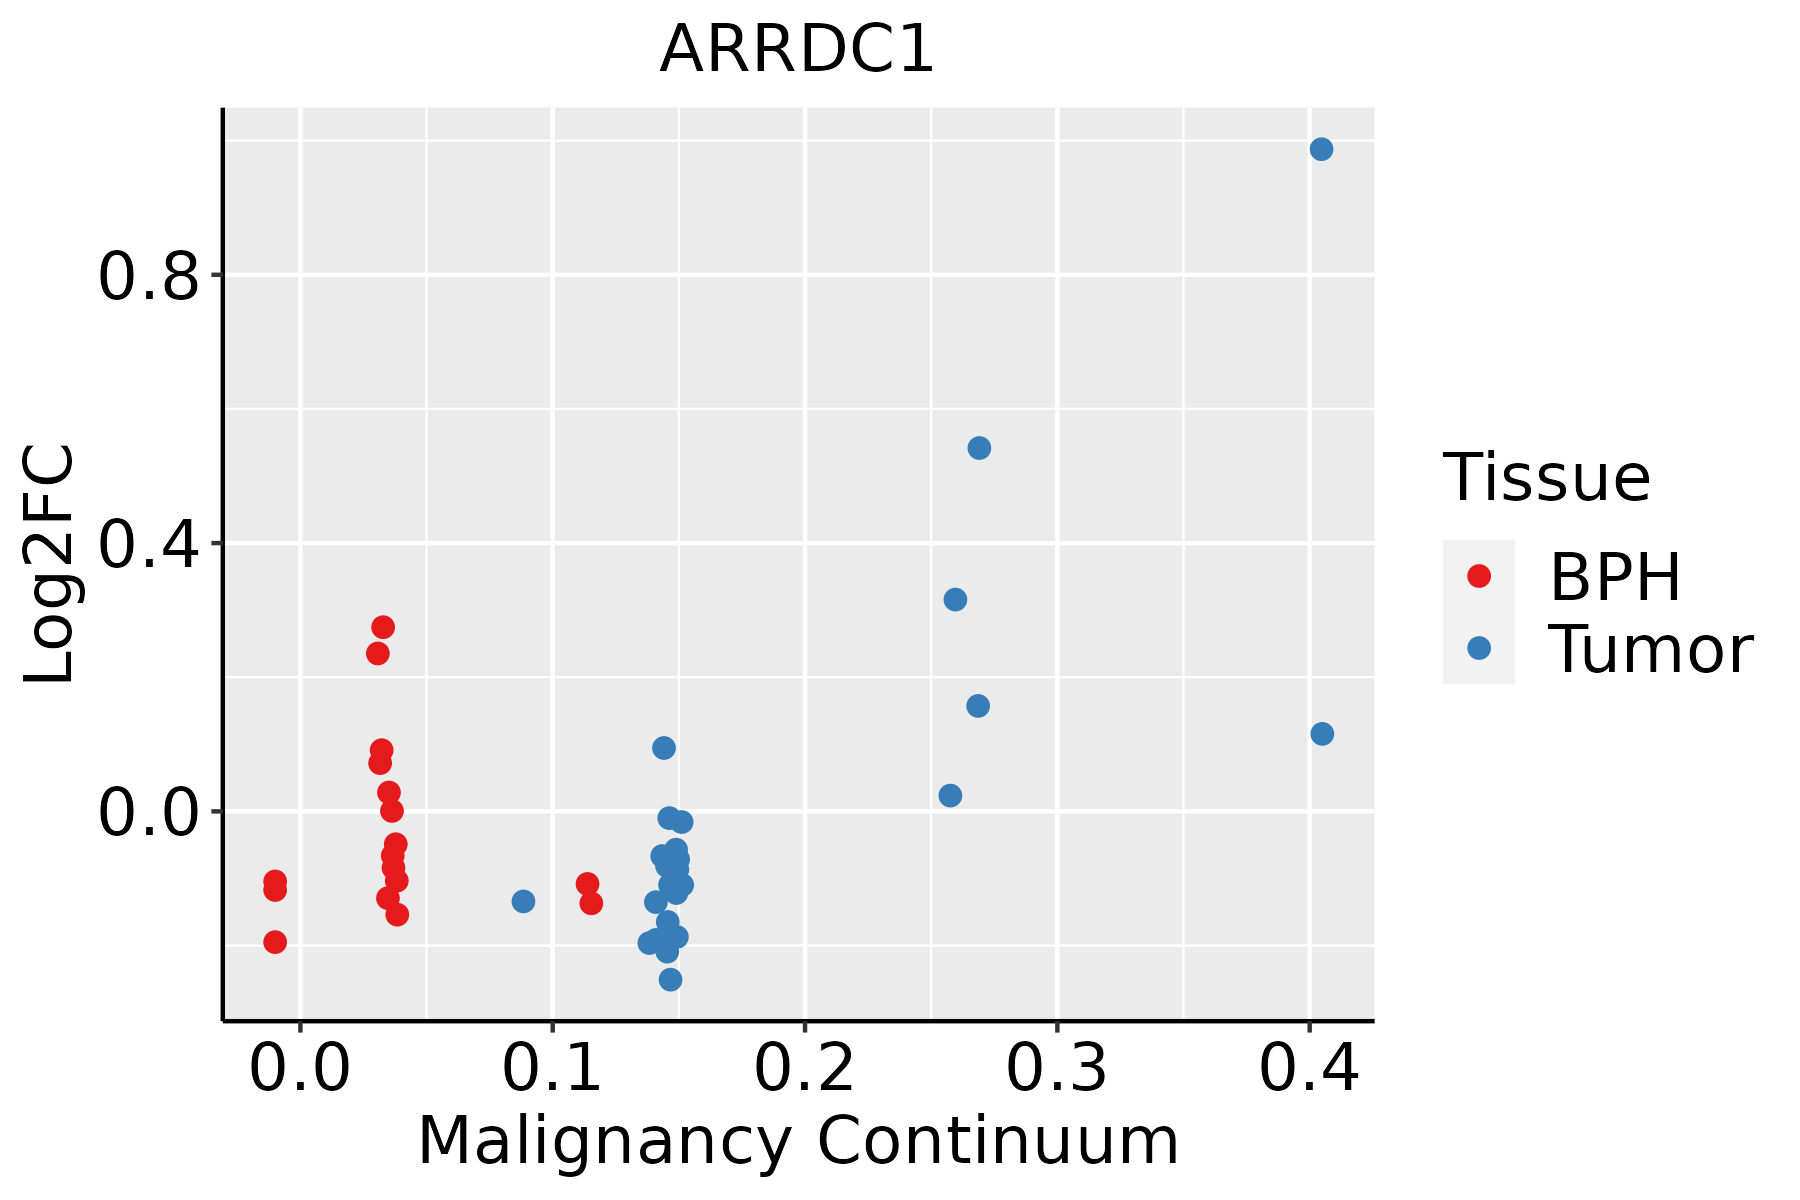 | BPH: Benign Prostatic Hyperplasia |
| Skin | 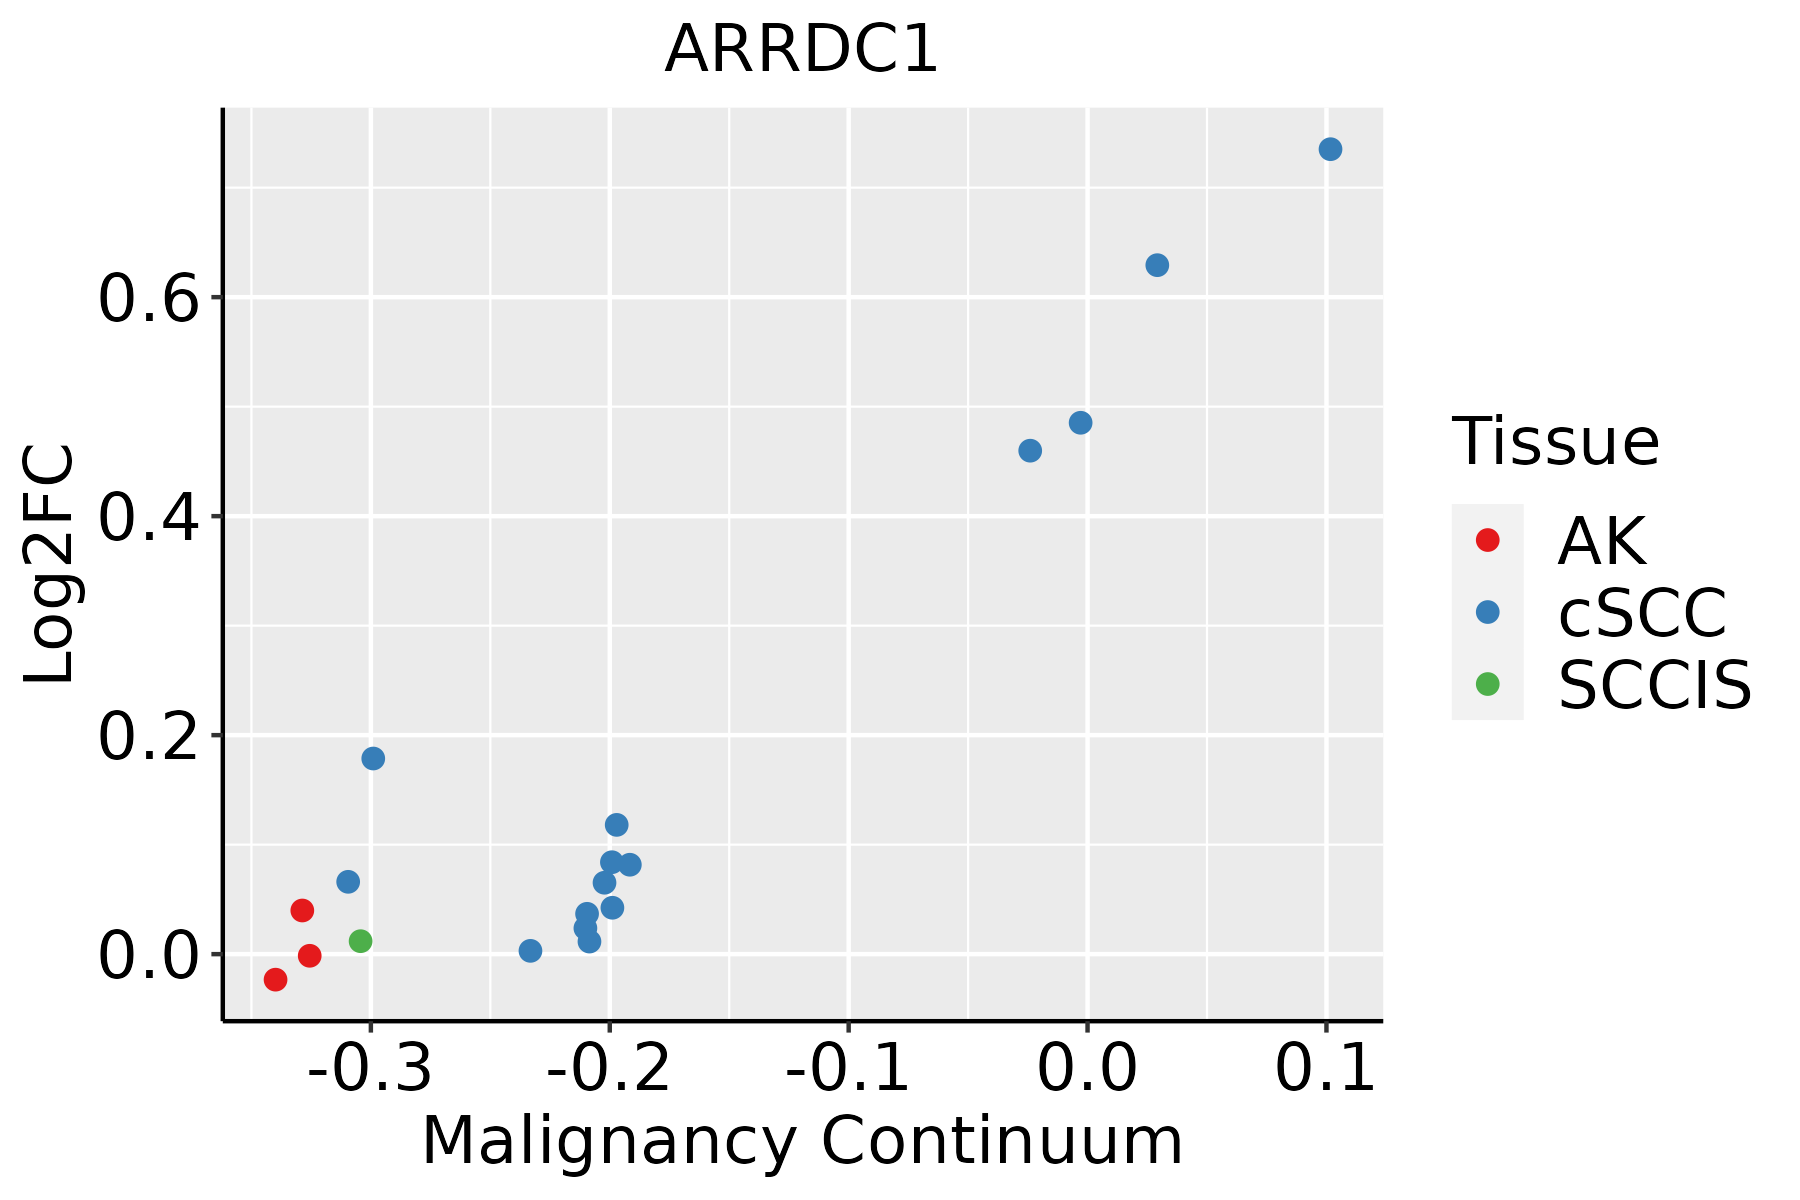 | AK: Actinic keratosis |
| cSCC: Cutaneous squamous cell carcinoma | ||
| SCCIS:squamous cell carcinoma in situ | ||
| Thyroid | 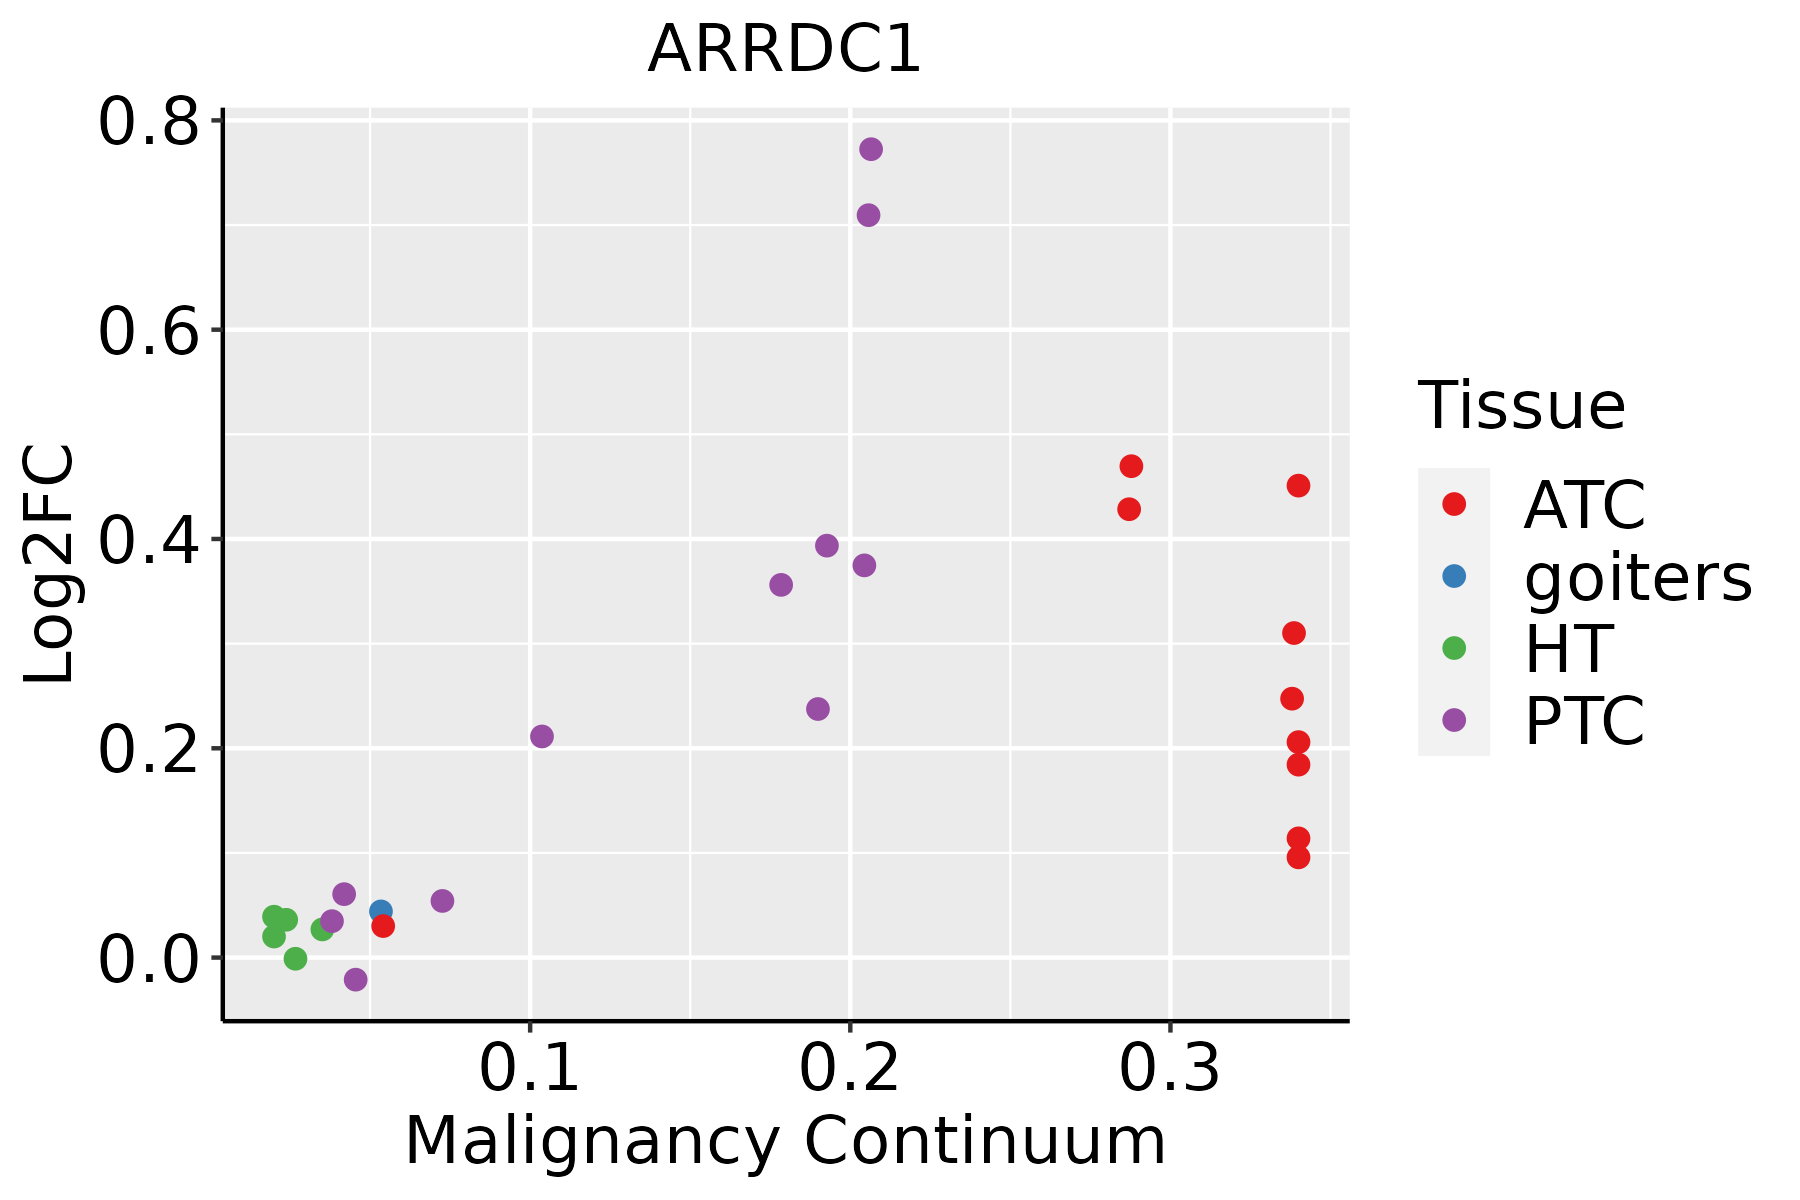 | ATC: Anaplastic thyroid cancer |
| HT: Hashimoto's thyroiditis | ||
| PTC: Papillary thyroid cancer |
| ∗log2FC in expression of this searched gene in stem-like cells from each diseased tissue sample relative to stem-like cells in normal samples in each tissue plotted against the malignancy continuum. Samples are colored based on if they are from different disease stage. |
Top |
Malignant transformation related pathway analysis |
| Find out the enriched GO biological processes and KEGG pathways involved in transition from healthy to precancer to cancer |
| Tissue | Disease Stage | Enriched GO biological Processes |
| Colorectum | AD |  |
| Colorectum | SER |  |
| Colorectum | MSS |  |
| Colorectum | MSI-H |  |
| Colorectum | FAP |  |
| ∗Top 15 enriched GO BP terms are showed in the bar plot of each disease state in each tissue. Each row represents a significant GO biological process which is colored according to the -log10(p.adjust). |
| Page: 1 2 3 4 5 6 7 8 9 |
| GO ID | Tissue | Disease Stage | Description | Gene Ratio | Bg Ratio | pvalue | p.adjust | Count |
| GO:00072197 | Esophagus | ESCC | Notch signaling pathway | 106/8552 | 172/18723 | 1.74e-05 | 1.55e-04 | 106 |
| GO:01401128 | Esophagus | ESCC | extracellular vesicle biogenesis | 20/8552 | 23/18723 | 4.97e-05 | 3.86e-04 | 20 |
| GO:0045746 | Esophagus | ESCC | negative regulation of Notch signaling pathway | 28/8552 | 36/18723 | 8.62e-05 | 6.22e-04 | 28 |
| GO:00085935 | Esophagus | ESCC | regulation of Notch signaling pathway | 59/8552 | 95/18723 | 9.12e-04 | 4.65e-03 | 59 |
| GO:01401125 | Liver | Cirrhotic | extracellular vesicle biogenesis | 14/4634 | 23/18723 | 2.50e-04 | 2.26e-03 | 14 |
| GO:014011211 | Liver | HCC | extracellular vesicle biogenesis | 17/7958 | 23/18723 | 2.28e-03 | 1.13e-02 | 17 |
| GO:00072196 | Oral cavity | OSCC | Notch signaling pathway | 92/7305 | 172/18723 | 7.84e-05 | 6.08e-04 | 92 |
| GO:00085934 | Oral cavity | OSCC | regulation of Notch signaling pathway | 53/7305 | 95/18723 | 6.64e-04 | 3.72e-03 | 53 |
| GO:01401127 | Oral cavity | OSCC | extracellular vesicle biogenesis | 17/7305 | 23/18723 | 7.28e-04 | 3.98e-03 | 17 |
| GO:014011213 | Oral cavity | LP | extracellular vesicle biogenesis | 14/4623 | 23/18723 | 2.44e-04 | 2.59e-03 | 14 |
| GO:000859311 | Oral cavity | LP | regulation of Notch signaling pathway | 35/4623 | 95/18723 | 5.53e-03 | 3.34e-02 | 35 |
| GO:000721913 | Oral cavity | LP | Notch signaling pathway | 57/4623 | 172/18723 | 7.60e-03 | 4.18e-02 | 57 |
| GO:01401126 | Prostate | BPH | extracellular vesicle biogenesis | 12/3107 | 23/18723 | 9.46e-05 | 8.88e-04 | 12 |
| GO:00072195 | Prostate | BPH | Notch signaling pathway | 41/3107 | 172/18723 | 8.95e-03 | 3.83e-02 | 41 |
| GO:014011212 | Prostate | Tumor | extracellular vesicle biogenesis | 12/3246 | 23/18723 | 1.47e-04 | 1.33e-03 | 12 |
| GO:000721912 | Prostate | Tumor | Notch signaling pathway | 44/3246 | 172/18723 | 4.02e-03 | 2.04e-02 | 44 |
| GO:01401129 | Skin | cSCC | extracellular vesicle biogenesis | 15/4864 | 23/18723 | 8.72e-05 | 8.21e-04 | 15 |
| GO:000721922 | Skin | cSCC | Notch signaling pathway | 60/4864 | 172/18723 | 5.82e-03 | 2.87e-02 | 60 |
| GO:014011210 | Thyroid | PTC | extracellular vesicle biogenesis | 18/5968 | 23/18723 | 6.38e-06 | 7.63e-05 | 18 |
| GO:00072199 | Thyroid | PTC | Notch signaling pathway | 70/5968 | 172/18723 | 8.82e-03 | 3.67e-02 | 70 |
| Page: 1 2 |
| Pathway ID | Tissue | Disease Stage | Description | Gene Ratio | Bg Ratio | pvalue | p.adjust | qvalue | Count |
| Page: 1 |
Top |
Cell-cell communication analysis |
| Identification of potential cell-cell interactions between two cell types and their ligand-receptor pairs for different disease states |
| Ligand | Receptor | LRpair | Pathway | Tissue | Disease Stage |
| Page: 1 |
Top |
Single-cell gene regulatory network inference analysis |
| Find out the significant the regulons (TFs) and the target genes of each regulon across cell types for different disease states |
| TF | Cell Type | Tissue | Disease Stage | Target Gene | RSS | Regulon Activity |
| ∗The dot plots of a searched regulon are shown for all cell subpopulations in each disease state of each tissue based on the regulon specific score inferred using pySCENIC and by calculating the average expression. |
| Page: 1 |
Top |
Somatic mutation of malignant transformation related genes |
| Annotation of somatic variants for genes involved in malignant transformation |
| Hugo Symbol | Variant Class | Variant Classification | dbSNP RS | HGVSc | HGVSp | HGVSp Short | SWISSPROT | BIOTYPE | SIFT | PolyPhen | Tumor Sample Barcode | Tissue | Histology | Sex | Age | Stage | Therapy Types | Drugs | Outcome |
| ARRDC1 | insertion | Frame_Shift_Ins | novel | c.1228_1229insGTGTTCCGGATTTTCAGCATGA | p.Tyr410CysfsTer11 | p.Y410Cfs*11 | Q8N5I2 | protein_coding | TCGA-BH-A0B1-01 | Breast | breast invasive carcinoma | Female | >=65 | I/II | Chemotherapy | adriamycin | SD | ||
| ARRDC1 | SNV | Missense_Mutation | rs368553334 | c.565N>A | p.Val189Ile | p.V189I | Q8N5I2 | protein_coding | tolerated(1) | benign(0) | TCGA-2W-A8YY-01 | Cervix | cervical & endocervical cancer | Female | <65 | I/II | Chemotherapy | cisplatin | CR |
| ARRDC1 | SNV | Missense_Mutation | novel | c.610N>G | p.Leu204Val | p.L204V | Q8N5I2 | protein_coding | deleterious(0) | probably_damaging(0.999) | TCGA-VS-A9UP-01 | Cervix | cervical & endocervical cancer | Female | <65 | I/II | Chemotherapy | cisplatin | PD |
| ARRDC1 | SNV | Missense_Mutation | novel | c.211C>A | p.Leu71Met | p.L71M | Q8N5I2 | protein_coding | deleterious(0.01) | probably_damaging(0.964) | TCGA-AA-3845-01 | Colorectum | colon adenocarcinoma | Female | >=65 | I/II | Unknown | Unknown | PD |
| ARRDC1 | SNV | Missense_Mutation | novel | c.340G>A | p.Ala114Thr | p.A114T | Q8N5I2 | protein_coding | tolerated(0.96) | benign(0.003) | TCGA-AA-A010-01 | Colorectum | colon adenocarcinoma | Female | <65 | I/II | Chemotherapy | folinic | CR |
| ARRDC1 | SNV | Missense_Mutation | c.865G>A | p.Ala289Thr | p.A289T | Q8N5I2 | protein_coding | tolerated(0.29) | benign(0) | TCGA-AD-5900-01 | Colorectum | colon adenocarcinoma | Male | >=65 | I/II | Unknown | Unknown | SD | |
| ARRDC1 | SNV | Missense_Mutation | rs376105916 | c.655G>A | p.Val219Ile | p.V219I | Q8N5I2 | protein_coding | tolerated(0.14) | benign(0.053) | TCGA-D5-6927-01 | Colorectum | colon adenocarcinoma | Male | <65 | I/II | Unknown | Unknown | SD |
| ARRDC1 | SNV | Missense_Mutation | c.731T>C | p.Val244Ala | p.V244A | Q8N5I2 | protein_coding | deleterious(0) | probably_damaging(0.999) | TCGA-NH-A5IV-01 | Colorectum | colon adenocarcinoma | Female | >=65 | I/II | Unknown | Unknown | SD | |
| ARRDC1 | SNV | Missense_Mutation | novel | c.795N>T | p.Gln265His | p.Q265H | Q8N5I2 | protein_coding | deleterious(0) | probably_damaging(0.986) | TCGA-A5-A0G2-01 | Endometrium | uterine corpus endometrioid carcinoma | Female | <65 | III/IV | Unknown | Unknown | SD |
| ARRDC1 | SNV | Missense_Mutation | c.241N>A | p.Ala81Thr | p.A81T | Q8N5I2 | protein_coding | tolerated(0.34) | benign(0.027) | TCGA-AJ-A8CW-01 | Endometrium | uterine corpus endometrioid carcinoma | Female | <65 | I/II | Unknown | Unknown | SD |
| Page: 1 2 3 |
Top |
Related drugs of malignant transformation related genes |
| Identification of chemicals and drugs interact with genes involved in malignant transfromation |
| (DGIdb 4.0) |
| Entrez ID | Symbol | Category | Interaction Types | Drug Claim Name | Drug Name | PMIDs |
| Page: 1 |

Copyright 2023-Present -The University of Texas Health Science Center at Houston |