
|
|||||
|
 | |
| |
| |
| |
| |
| |
|
Gene: ARRB2 |
Gene summary for ARRB2 |
| Gene information | Species | Human | Gene symbol | ARRB2 | Gene ID | 409 |
| Gene name | arrestin beta 2 | |
| Gene Alias | ARB2 | |
| Cytomap | 17p13.2 | |
| Gene Type | protein-coding | GO ID | GO:0000003 | UniProtAcc | P32121 |
Top |
Malignant transformation analysis |
| Identification of the aberrant gene expression in precancerous and cancerous lesions by comparing the gene expression of stem-like cells in diseased tissues with normal stem cells |
| Entrez ID | Symbol | Replicates | Species | Organ | Tissue | Adj P-value | Log2FC | Malignancy |
| 409 | ARRB2 | LZE4T | Human | Esophagus | ESCC | 8.58e-07 | 2.13e-01 | 0.0811 |
| 409 | ARRB2 | LZE5T | Human | Esophagus | ESCC | 1.68e-03 | 4.66e-01 | 0.0514 |
| 409 | ARRB2 | LZE7T | Human | Esophagus | ESCC | 1.19e-08 | 3.35e-01 | 0.0667 |
| 409 | ARRB2 | LZE8T | Human | Esophagus | ESCC | 2.45e-03 | 9.61e-02 | 0.067 |
| 409 | ARRB2 | LZE20T | Human | Esophagus | ESCC | 1.11e-02 | 1.16e-01 | 0.0662 |
| 409 | ARRB2 | LZE22T | Human | Esophagus | ESCC | 1.32e-05 | 4.90e-01 | 0.068 |
| 409 | ARRB2 | LZE24T | Human | Esophagus | ESCC | 7.55e-24 | 7.12e-01 | 0.0596 |
| 409 | ARRB2 | LZE6T | Human | Esophagus | ESCC | 1.46e-07 | 2.48e-01 | 0.0845 |
| 409 | ARRB2 | P1T-E | Human | Esophagus | ESCC | 2.81e-08 | 3.00e-01 | 0.0875 |
| 409 | ARRB2 | P2T-E | Human | Esophagus | ESCC | 4.03e-15 | 2.50e-01 | 0.1177 |
| 409 | ARRB2 | P4T-E | Human | Esophagus | ESCC | 6.41e-19 | 4.17e-01 | 0.1323 |
| 409 | ARRB2 | P5T-E | Human | Esophagus | ESCC | 1.10e-06 | 5.53e-02 | 0.1327 |
| 409 | ARRB2 | P8T-E | Human | Esophagus | ESCC | 4.67e-23 | 4.77e-01 | 0.0889 |
| 409 | ARRB2 | P9T-E | Human | Esophagus | ESCC | 9.68e-10 | 1.07e-01 | 0.1131 |
| 409 | ARRB2 | P10T-E | Human | Esophagus | ESCC | 8.03e-18 | 3.04e-01 | 0.116 |
| 409 | ARRB2 | P11T-E | Human | Esophagus | ESCC | 4.60e-04 | 2.60e-01 | 0.1426 |
| 409 | ARRB2 | P12T-E | Human | Esophagus | ESCC | 1.88e-26 | 4.51e-01 | 0.1122 |
| 409 | ARRB2 | P15T-E | Human | Esophagus | ESCC | 6.79e-12 | 2.41e-01 | 0.1149 |
| 409 | ARRB2 | P16T-E | Human | Esophagus | ESCC | 1.95e-21 | 4.11e-01 | 0.1153 |
| 409 | ARRB2 | P19T-E | Human | Esophagus | ESCC | 8.67e-04 | 5.75e-01 | 0.1662 |
| Page: 1 2 3 4 5 |
| Tissue | Expression Dynamics | Abbreviation |
| Esophagus | 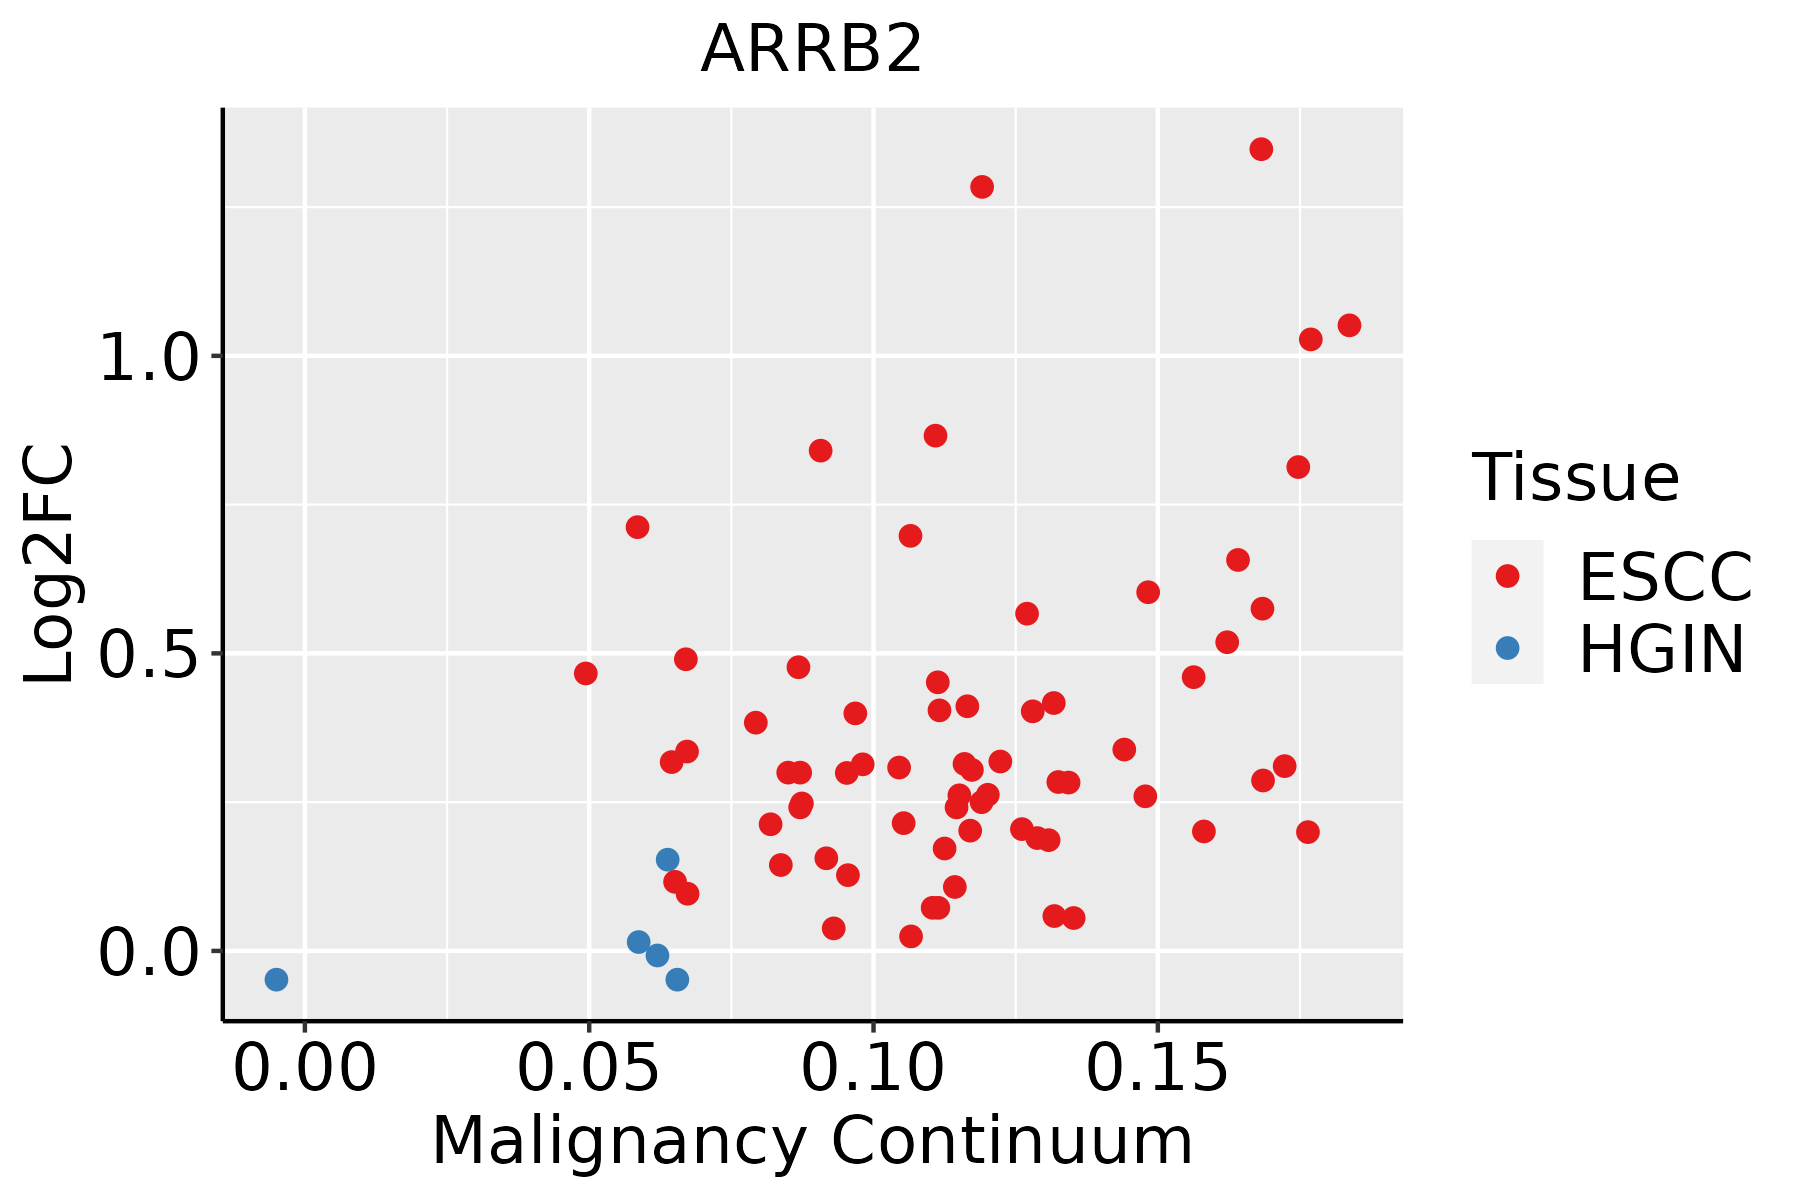 | ESCC: Esophageal squamous cell carcinoma |
| HGIN: High-grade intraepithelial neoplasias | ||
| LGIN: Low-grade intraepithelial neoplasias | ||
| Liver |  | HCC: Hepatocellular carcinoma |
| NAFLD: Non-alcoholic fatty liver disease | ||
| Oral Cavity | 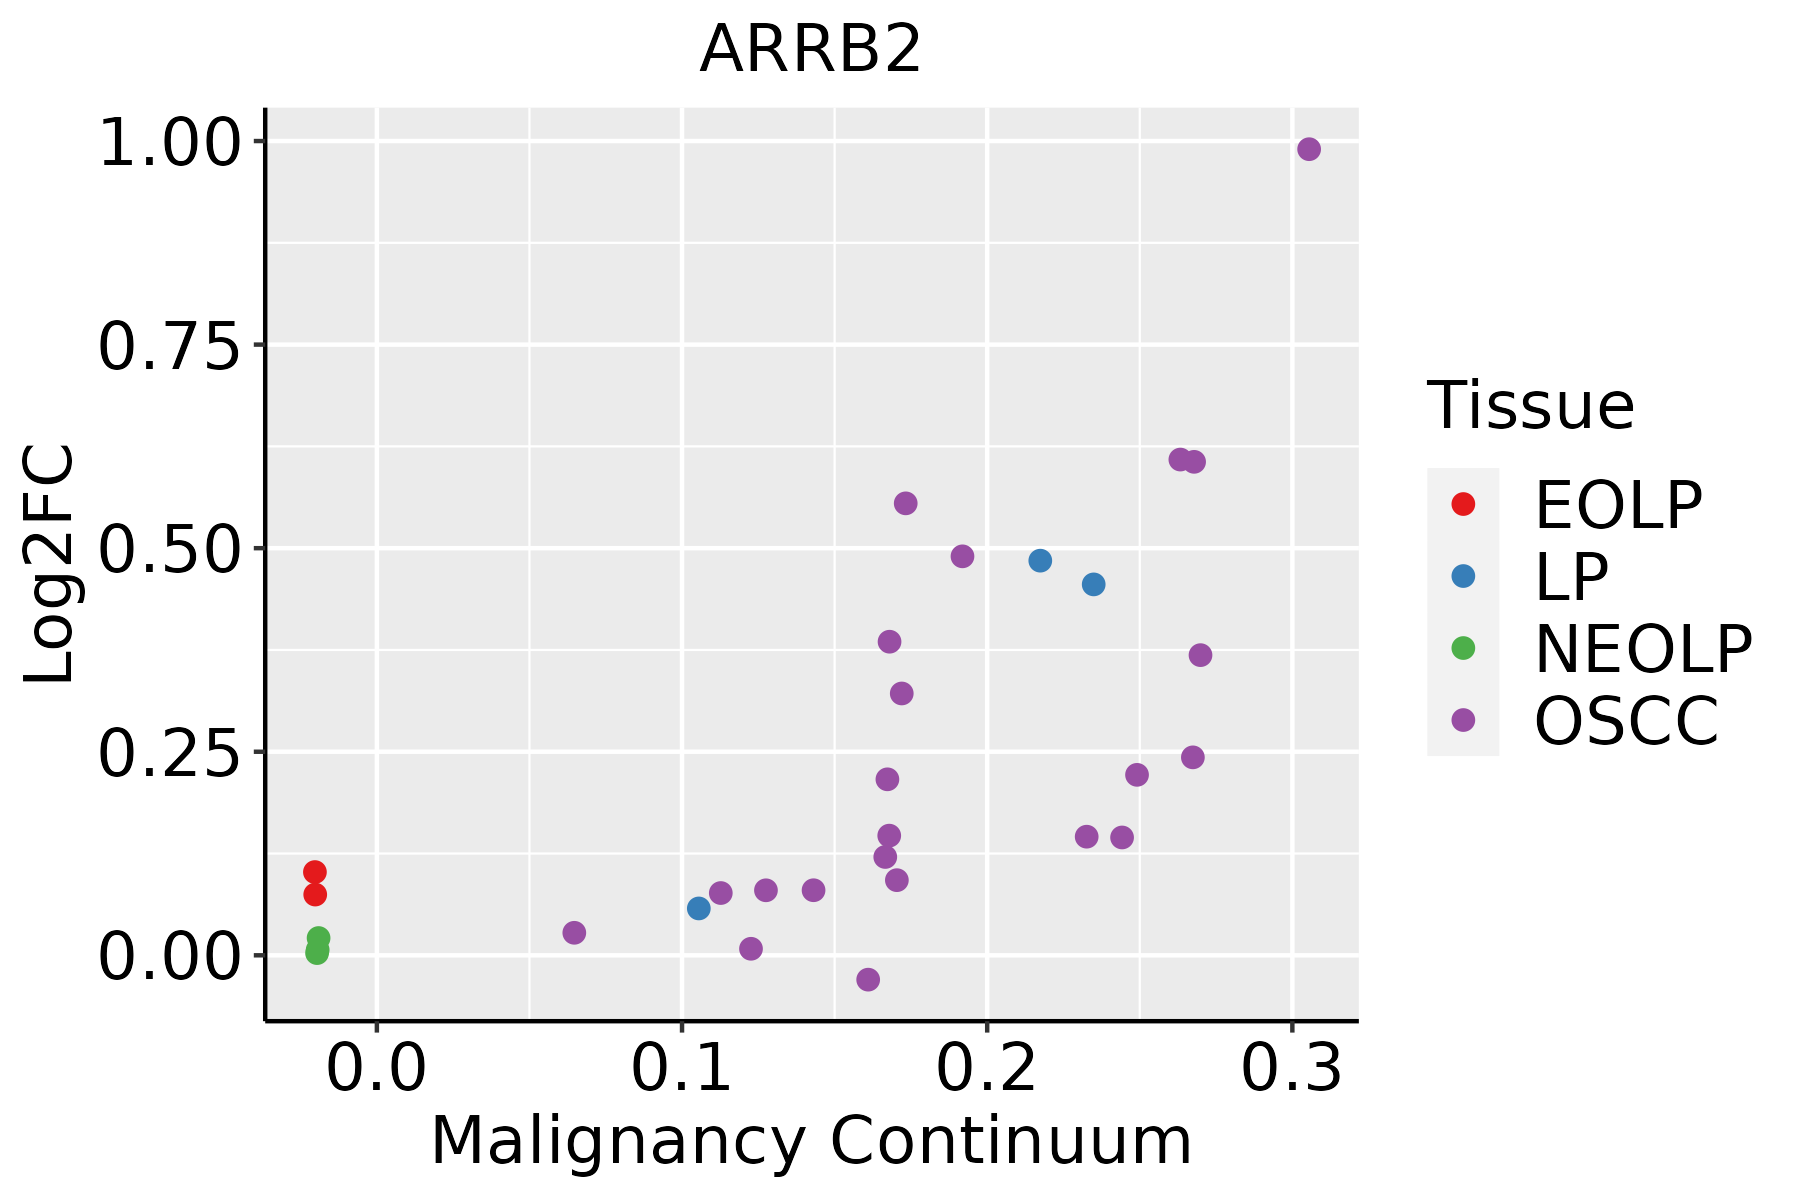 | EOLP: Erosive Oral lichen planus |
| LP: leukoplakia | ||
| NEOLP: Non-erosive oral lichen planus | ||
| OSCC: Oral squamous cell carcinoma |
| ∗log2FC in expression of this searched gene in stem-like cells from each diseased tissue sample relative to stem-like cells in normal samples in each tissue plotted against the malignancy continuum. Samples are colored based on if they are from different disease stage. |
Top |
Malignant transformation related pathway analysis |
| Find out the enriched GO biological processes and KEGG pathways involved in transition from healthy to precancer to cancer |
| Tissue | Disease Stage | Enriched GO biological Processes |
| Colorectum | AD |  |
| Colorectum | SER |  |
| Colorectum | MSS |  |
| Colorectum | MSI-H |  |
| Colorectum | FAP |  |
| ∗Top 15 enriched GO BP terms are showed in the bar plot of each disease state in each tissue. Each row represents a significant GO biological process which is colored according to the -log10(p.adjust). |
| Page: 1 2 3 4 5 6 7 8 9 |
| GO ID | Tissue | Disease Stage | Description | Gene Ratio | Bg Ratio | pvalue | p.adjust | Count |
| GO:0010498111 | Esophagus | ESCC | proteasomal protein catabolic process | 369/8552 | 490/18723 | 1.13e-41 | 1.80e-38 | 369 |
| GO:0043161111 | Esophagus | ESCC | proteasome-mediated ubiquitin-dependent protein catabolic process | 312/8552 | 412/18723 | 3.53e-36 | 4.48e-33 | 312 |
| GO:2001233111 | Esophagus | ESCC | regulation of apoptotic signaling pathway | 256/8552 | 356/18723 | 4.11e-24 | 1.04e-21 | 256 |
| GO:1903320111 | Esophagus | ESCC | regulation of protein modification by small protein conjugation or removal | 181/8552 | 242/18723 | 1.80e-20 | 2.60e-18 | 181 |
| GO:0051098111 | Esophagus | ESCC | regulation of binding | 251/8552 | 363/18723 | 6.73e-20 | 8.46e-18 | 251 |
| GO:0031396111 | Esophagus | ESCC | regulation of protein ubiquitination | 154/8552 | 210/18723 | 2.70e-16 | 2.04e-14 | 154 |
| GO:2001234111 | Esophagus | ESCC | negative regulation of apoptotic signaling pathway | 161/8552 | 224/18723 | 1.24e-15 | 8.09e-14 | 161 |
| GO:005105215 | Esophagus | ESCC | regulation of DNA metabolic process | 232/8552 | 359/18723 | 2.40e-13 | 1.13e-11 | 232 |
| GO:0010821110 | Esophagus | ESCC | regulation of mitochondrion organization | 107/8552 | 144/18723 | 2.31e-12 | 9.41e-11 | 107 |
| GO:0010563111 | Esophagus | ESCC | negative regulation of phosphorus metabolic process | 274/8552 | 442/18723 | 2.32e-12 | 9.41e-11 | 274 |
| GO:0045936111 | Esophagus | ESCC | negative regulation of phosphate metabolic process | 273/8552 | 441/18723 | 3.18e-12 | 1.25e-10 | 273 |
| GO:007189716 | Esophagus | ESCC | DNA biosynthetic process | 127/8552 | 180/18723 | 1.04e-11 | 3.85e-10 | 127 |
| GO:005105417 | Esophagus | ESCC | positive regulation of DNA metabolic process | 139/8552 | 201/18723 | 1.20e-11 | 4.33e-10 | 139 |
| GO:0008637110 | Esophagus | ESCC | apoptotic mitochondrial changes | 83/8552 | 107/18723 | 1.43e-11 | 5.08e-10 | 83 |
| GO:2000116111 | Esophagus | ESCC | regulation of cysteine-type endopeptidase activity | 158/8552 | 235/18723 | 1.67e-11 | 5.90e-10 | 158 |
| GO:0043281111 | Esophagus | ESCC | regulation of cysteine-type endopeptidase activity involved in apoptotic process | 143/8552 | 209/18723 | 2.12e-11 | 7.31e-10 | 143 |
| GO:004339320 | Esophagus | ESCC | regulation of protein binding | 135/8552 | 196/18723 | 3.69e-11 | 1.22e-09 | 135 |
| GO:200057319 | Esophagus | ESCC | positive regulation of DNA biosynthetic process | 56/8552 | 66/18723 | 4.51e-11 | 1.45e-09 | 56 |
| GO:2000278110 | Esophagus | ESCC | regulation of DNA biosynthetic process | 81/8552 | 106/18723 | 9.81e-11 | 2.96e-09 | 81 |
| GO:0042326111 | Esophagus | ESCC | negative regulation of phosphorylation | 237/8552 | 385/18723 | 1.86e-10 | 5.33e-09 | 237 |
| Page: 1 2 3 4 5 6 7 8 9 10 11 12 13 14 15 16 17 18 19 20 |
| Pathway ID | Tissue | Disease Stage | Description | Gene Ratio | Bg Ratio | pvalue | p.adjust | qvalue | Count |
| hsa04144210 | Esophagus | ESCC | Endocytosis | 186/4205 | 251/8465 | 9.74e-16 | 4.66e-14 | 2.39e-14 | 186 |
| hsa049268 | Esophagus | ESCC | Relaxin signaling pathway | 81/4205 | 129/8465 | 1.72e-03 | 5.09e-03 | 2.61e-03 | 81 |
| hsa0492816 | Esophagus | ESCC | Parathyroid hormone synthesis, secretion and action | 66/4205 | 106/8465 | 5.86e-03 | 1.47e-02 | 7.51e-03 | 66 |
| hsa0414437 | Esophagus | ESCC | Endocytosis | 186/4205 | 251/8465 | 9.74e-16 | 4.66e-14 | 2.39e-14 | 186 |
| hsa0492616 | Esophagus | ESCC | Relaxin signaling pathway | 81/4205 | 129/8465 | 1.72e-03 | 5.09e-03 | 2.61e-03 | 81 |
| hsa0492817 | Esophagus | ESCC | Parathyroid hormone synthesis, secretion and action | 66/4205 | 106/8465 | 5.86e-03 | 1.47e-02 | 7.51e-03 | 66 |
| hsa0414422 | Liver | HCC | Endocytosis | 178/4020 | 251/8465 | 2.03e-14 | 5.22e-13 | 2.91e-13 | 178 |
| hsa049262 | Liver | HCC | Relaxin signaling pathway | 75/4020 | 129/8465 | 9.33e-03 | 2.46e-02 | 1.37e-02 | 75 |
| hsa0414432 | Liver | HCC | Endocytosis | 178/4020 | 251/8465 | 2.03e-14 | 5.22e-13 | 2.91e-13 | 178 |
| hsa0492611 | Liver | HCC | Relaxin signaling pathway | 75/4020 | 129/8465 | 9.33e-03 | 2.46e-02 | 1.37e-02 | 75 |
| hsa0414427 | Oral cavity | OSCC | Endocytosis | 174/3704 | 251/8465 | 9.42e-17 | 4.51e-15 | 2.29e-15 | 174 |
| hsa0401014 | Oral cavity | OSCC | MAPK signaling pathway | 165/3704 | 302/8465 | 7.11e-05 | 2.74e-04 | 1.40e-04 | 165 |
| hsa049267 | Oral cavity | OSCC | Relaxin signaling pathway | 74/3704 | 129/8465 | 1.20e-03 | 3.37e-03 | 1.72e-03 | 74 |
| hsa04144112 | Oral cavity | OSCC | Endocytosis | 174/3704 | 251/8465 | 9.42e-17 | 4.51e-15 | 2.29e-15 | 174 |
| hsa0401015 | Oral cavity | OSCC | MAPK signaling pathway | 165/3704 | 302/8465 | 7.11e-05 | 2.74e-04 | 1.40e-04 | 165 |
| hsa0492615 | Oral cavity | OSCC | Relaxin signaling pathway | 74/3704 | 129/8465 | 1.20e-03 | 3.37e-03 | 1.72e-03 | 74 |
| hsa0414428 | Oral cavity | LP | Endocytosis | 121/2418 | 251/8465 | 1.89e-11 | 3.70e-10 | 2.38e-10 | 121 |
| hsa0414436 | Oral cavity | LP | Endocytosis | 121/2418 | 251/8465 | 1.89e-11 | 3.70e-10 | 2.38e-10 | 121 |
| hsa0414442 | Oral cavity | EOLP | Endocytosis | 71/1218 | 251/8465 | 5.28e-09 | 8.97e-08 | 5.29e-08 | 71 |
| hsa0401023 | Oral cavity | EOLP | MAPK signaling pathway | 68/1218 | 302/8465 | 7.48e-05 | 3.40e-04 | 2.01e-04 | 68 |
| Page: 1 2 |
Top |
Cell-cell communication analysis |
| Identification of potential cell-cell interactions between two cell types and their ligand-receptor pairs for different disease states |
| Ligand | Receptor | LRpair | Pathway | Tissue | Disease Stage |
| Page: 1 |
Top |
Single-cell gene regulatory network inference analysis |
| Find out the significant the regulons (TFs) and the target genes of each regulon across cell types for different disease states |
| TF | Cell Type | Tissue | Disease Stage | Target Gene | RSS | Regulon Activity |
| ∗The dot plots of a searched regulon are shown for all cell subpopulations in each disease state of each tissue based on the regulon specific score inferred using pySCENIC and by calculating the average expression. |
| Page: 1 |
Top |
Somatic mutation of malignant transformation related genes |
| Annotation of somatic variants for genes involved in malignant transformation |
| Hugo Symbol | Variant Class | Variant Classification | dbSNP RS | HGVSc | HGVSp | HGVSp Short | SWISSPROT | BIOTYPE | SIFT | PolyPhen | Tumor Sample Barcode | Tissue | Histology | Sex | Age | Stage | Therapy Types | Drugs | Outcome |
| ARRB2 | SNV | Missense_Mutation | c.614C>T | p.Ser205Leu | p.S205L | P32121 | protein_coding | tolerated(0.38) | benign(0.049) | TCGA-E2-A14Y-01 | Breast | breast invasive carcinoma | Female | <65 | I/II | Chemotherapy | carboplatin | SD | |
| ARRB2 | SNV | Missense_Mutation | c.1214N>T | p.Asp405Val | p.D405V | P32121 | protein_coding | deleterious(0) | probably_damaging(0.999) | TCGA-DG-A2KJ-01 | Cervix | cervical & endocervical cancer | Female | <65 | III/IV | Chemotherapy | cisplatin | SD | |
| ARRB2 | SNV | Missense_Mutation | rs758418471 | c.572G>A | p.Arg191Gln | p.R191Q | P32121 | protein_coding | deleterious(0) | probably_damaging(0.997) | TCGA-D5-6539-01 | Colorectum | colon adenocarcinoma | Female | <65 | I/II | Unknown | Unknown | SD |
| ARRB2 | SNV | Missense_Mutation | rs373133862 | c.629G>A | p.Arg210His | p.R210H | P32121 | protein_coding | deleterious(0.03) | probably_damaging(0.999) | TCGA-D5-6930-01 | Colorectum | colon adenocarcinoma | Male | >=65 | I/II | Unknown | Unknown | SD |
| ARRB2 | SNV | Missense_Mutation | novel | c.75N>T | p.Lys25Asn | p.K25N | P32121 | protein_coding | deleterious(0) | probably_damaging(0.999) | TCGA-A5-A0G2-01 | Endometrium | uterine corpus endometrioid carcinoma | Female | <65 | III/IV | Unknown | Unknown | SD |
| ARRB2 | SNV | Missense_Mutation | c.781N>A | p.Ala261Thr | p.A261T | P32121 | protein_coding | tolerated(0.43) | possibly_damaging(0.871) | TCGA-A5-A2K3-01 | Endometrium | uterine corpus endometrioid carcinoma | Female | >=65 | I/II | Chemotherapy | carboplatin | SD | |
| ARRB2 | SNV | Missense_Mutation | rs780678997 | c.230N>A | p.Arg77His | p.R77H | P32121 | protein_coding | deleterious(0.01) | possibly_damaging(0.614) | TCGA-AJ-A3EL-01 | Endometrium | uterine corpus endometrioid carcinoma | Female | <65 | I/II | Unknown | Unknown | SD |
| ARRB2 | SNV | Missense_Mutation | novel | c.1253A>G | p.Lys418Arg | p.K418R | P32121 | protein_coding | tolerated(0.13) | possibly_damaging(0.492) | TCGA-AJ-A3OJ-01 | Endometrium | uterine corpus endometrioid carcinoma | Female | <65 | I/II | Chemotherapy | carboplatin | CR |
| ARRB2 | SNV | Missense_Mutation | rs777117300 | c.1073N>T | p.Ser358Phe | p.S358F | P32121 | protein_coding | tolerated(0.5) | possibly_damaging(0.575) | TCGA-AP-A059-01 | Endometrium | uterine corpus endometrioid carcinoma | Female | >=65 | I/II | Unknown | Unknown | SD |
| ARRB2 | SNV | Missense_Mutation | novel | c.263N>C | p.Phe88Ser | p.F88S | P32121 | protein_coding | deleterious(0) | benign(0.381) | TCGA-AP-A1DK-01 | Endometrium | uterine corpus endometrioid carcinoma | Female | <65 | I/II | Unknown | Unknown | SD |
| Page: 1 2 3 |
Top |
Related drugs of malignant transformation related genes |
| Identification of chemicals and drugs interact with genes involved in malignant transfromation |
| (DGIdb 4.0) |
| Entrez ID | Symbol | Category | Interaction Types | Drug Claim Name | Drug Name | PMIDs |
| 409 | ARRB2 | ION CHANNEL, G PROTEIN COUPLED RECEPTOR | tramadol | TRAMADOL | 30549211 | |
| 409 | ARRB2 | ION CHANNEL, G PROTEIN COUPLED RECEPTOR | fentanyl | FENTANYL | 30549211 | |
| 409 | ARRB2 | ION CHANNEL, G PROTEIN COUPLED RECEPTOR | methamphetamine | METHAMPHETAMINE | 17233643 | |
| 409 | ARRB2 | ION CHANNEL, G PROTEIN COUPLED RECEPTOR | buprenorphine | BUPRENORPHINE | 30549211 |
| Page: 1 |

Copyright 2023-Present -The University of Texas Health Science Center at Houston |