
|
|||||
|
 | |
| |
| |
| |
| |
| |
|
Gene: ARPP19 |
Gene summary for ARPP19 |
| Gene information | Species | Human | Gene symbol | ARPP19 | Gene ID | 10776 |
| Gene name | cAMP regulated phosphoprotein 19 | |
| Gene Alias | ARPP-16 | |
| Cytomap | 15q21.2 | |
| Gene Type | protein-coding | GO ID | GO:0000086 | UniProtAcc | H3BMD8 |
Top |
Malignant transformation analysis |
| Identification of the aberrant gene expression in precancerous and cancerous lesions by comparing the gene expression of stem-like cells in diseased tissues with normal stem cells |
| Entrez ID | Symbol | Replicates | Species | Organ | Tissue | Adj P-value | Log2FC | Malignancy |
| 10776 | ARPP19 | LZE2D | Human | Esophagus | HGIN | 1.55e-03 | 6.69e-02 | 0.0642 |
| 10776 | ARPP19 | LZE4T | Human | Esophagus | ESCC | 1.11e-10 | 5.06e-01 | 0.0811 |
| 10776 | ARPP19 | LZE7T | Human | Esophagus | ESCC | 9.69e-04 | 6.02e-01 | 0.0667 |
| 10776 | ARPP19 | LZE8T | Human | Esophagus | ESCC | 1.61e-03 | 1.95e-01 | 0.067 |
| 10776 | ARPP19 | LZE20T | Human | Esophagus | ESCC | 7.60e-10 | -3.00e-02 | 0.0662 |
| 10776 | ARPP19 | LZE22D1 | Human | Esophagus | HGIN | 1.25e-04 | -1.30e-01 | 0.0595 |
| 10776 | ARPP19 | LZE22T | Human | Esophagus | ESCC | 2.29e-04 | 3.62e-01 | 0.068 |
| 10776 | ARPP19 | LZE24T | Human | Esophagus | ESCC | 2.56e-08 | 2.17e-01 | 0.0596 |
| 10776 | ARPP19 | LZE21T | Human | Esophagus | ESCC | 2.58e-12 | 1.78e-01 | 0.0655 |
| 10776 | ARPP19 | LZE6T | Human | Esophagus | ESCC | 4.15e-05 | 3.85e-01 | 0.0845 |
| 10776 | ARPP19 | P1T-E | Human | Esophagus | ESCC | 9.62e-04 | 6.44e-01 | 0.0875 |
| 10776 | ARPP19 | P2T-E | Human | Esophagus | ESCC | 3.09e-20 | 3.41e-01 | 0.1177 |
| 10776 | ARPP19 | P4T-E | Human | Esophagus | ESCC | 6.83e-36 | 1.06e+00 | 0.1323 |
| 10776 | ARPP19 | P5T-E | Human | Esophagus | ESCC | 3.81e-45 | 9.48e-01 | 0.1327 |
| 10776 | ARPP19 | P8T-E | Human | Esophagus | ESCC | 6.33e-29 | 6.65e-01 | 0.0889 |
| 10776 | ARPP19 | P9T-E | Human | Esophagus | ESCC | 6.91e-30 | 9.13e-01 | 0.1131 |
| 10776 | ARPP19 | P10T-E | Human | Esophagus | ESCC | 4.76e-31 | 8.00e-01 | 0.116 |
| 10776 | ARPP19 | P11T-E | Human | Esophagus | ESCC | 6.76e-11 | 5.72e-01 | 0.1426 |
| 10776 | ARPP19 | P12T-E | Human | Esophagus | ESCC | 2.34e-33 | 8.22e-01 | 0.1122 |
| 10776 | ARPP19 | P15T-E | Human | Esophagus | ESCC | 1.81e-42 | 1.08e+00 | 0.1149 |
| Page: 1 2 3 4 5 6 7 |
| Tissue | Expression Dynamics | Abbreviation |
| Esophagus | 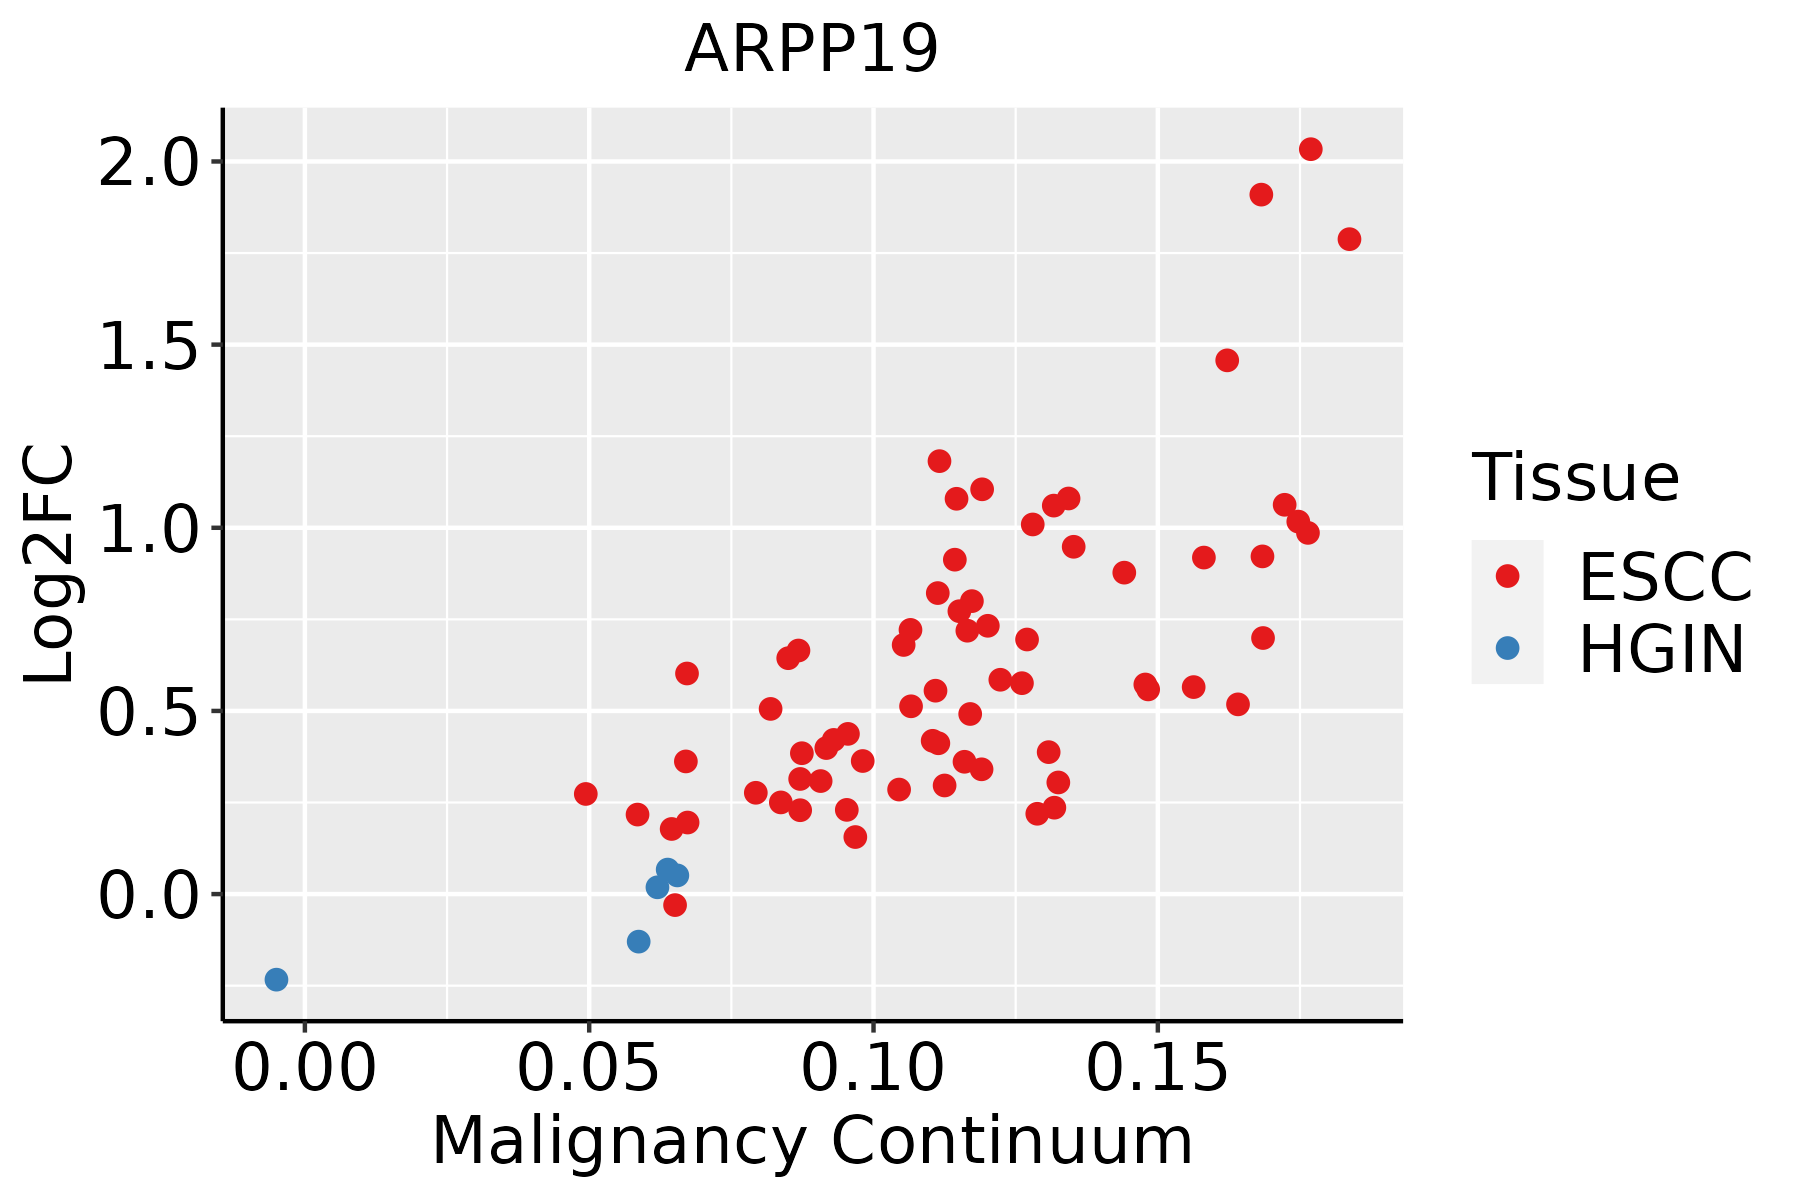 | ESCC: Esophageal squamous cell carcinoma |
| HGIN: High-grade intraepithelial neoplasias | ||
| LGIN: Low-grade intraepithelial neoplasias | ||
| Liver | 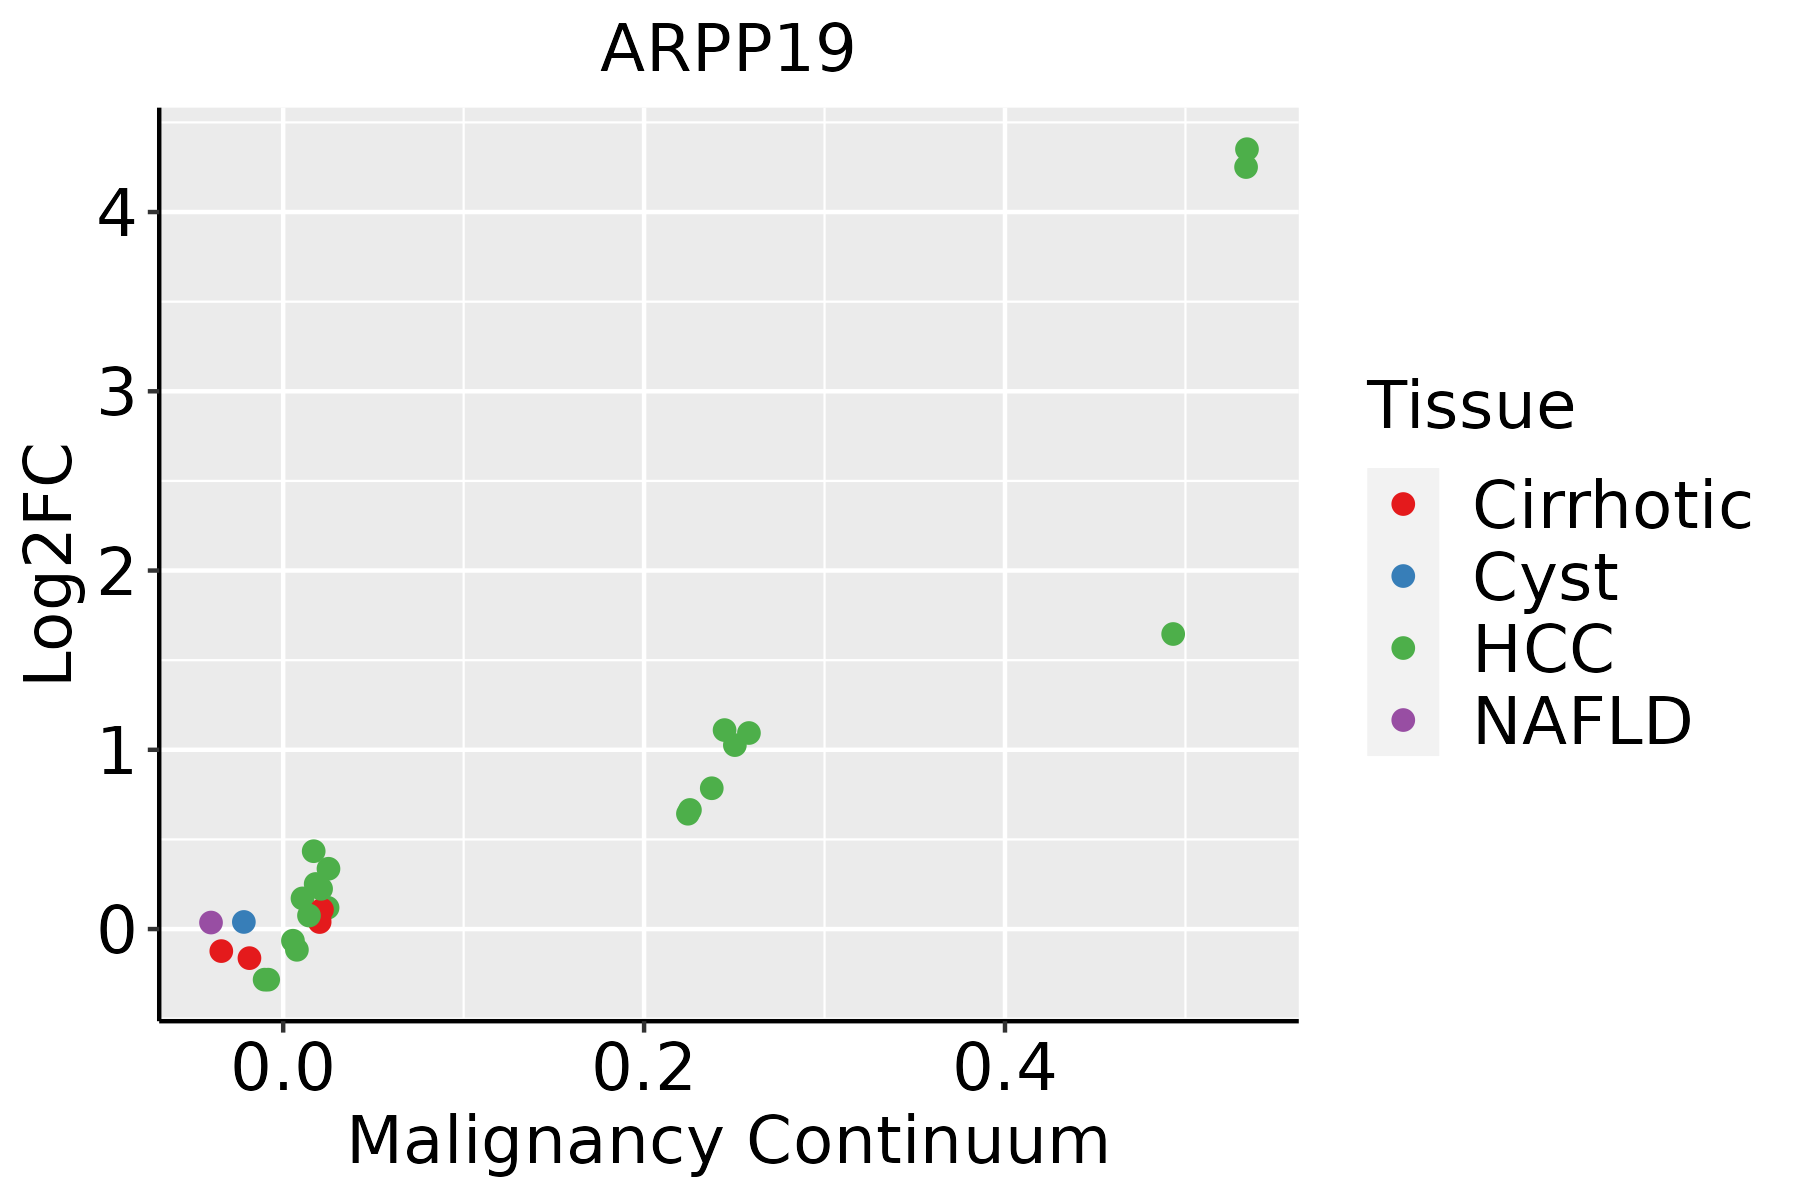 | HCC: Hepatocellular carcinoma |
| NAFLD: Non-alcoholic fatty liver disease | ||
| Oral Cavity | 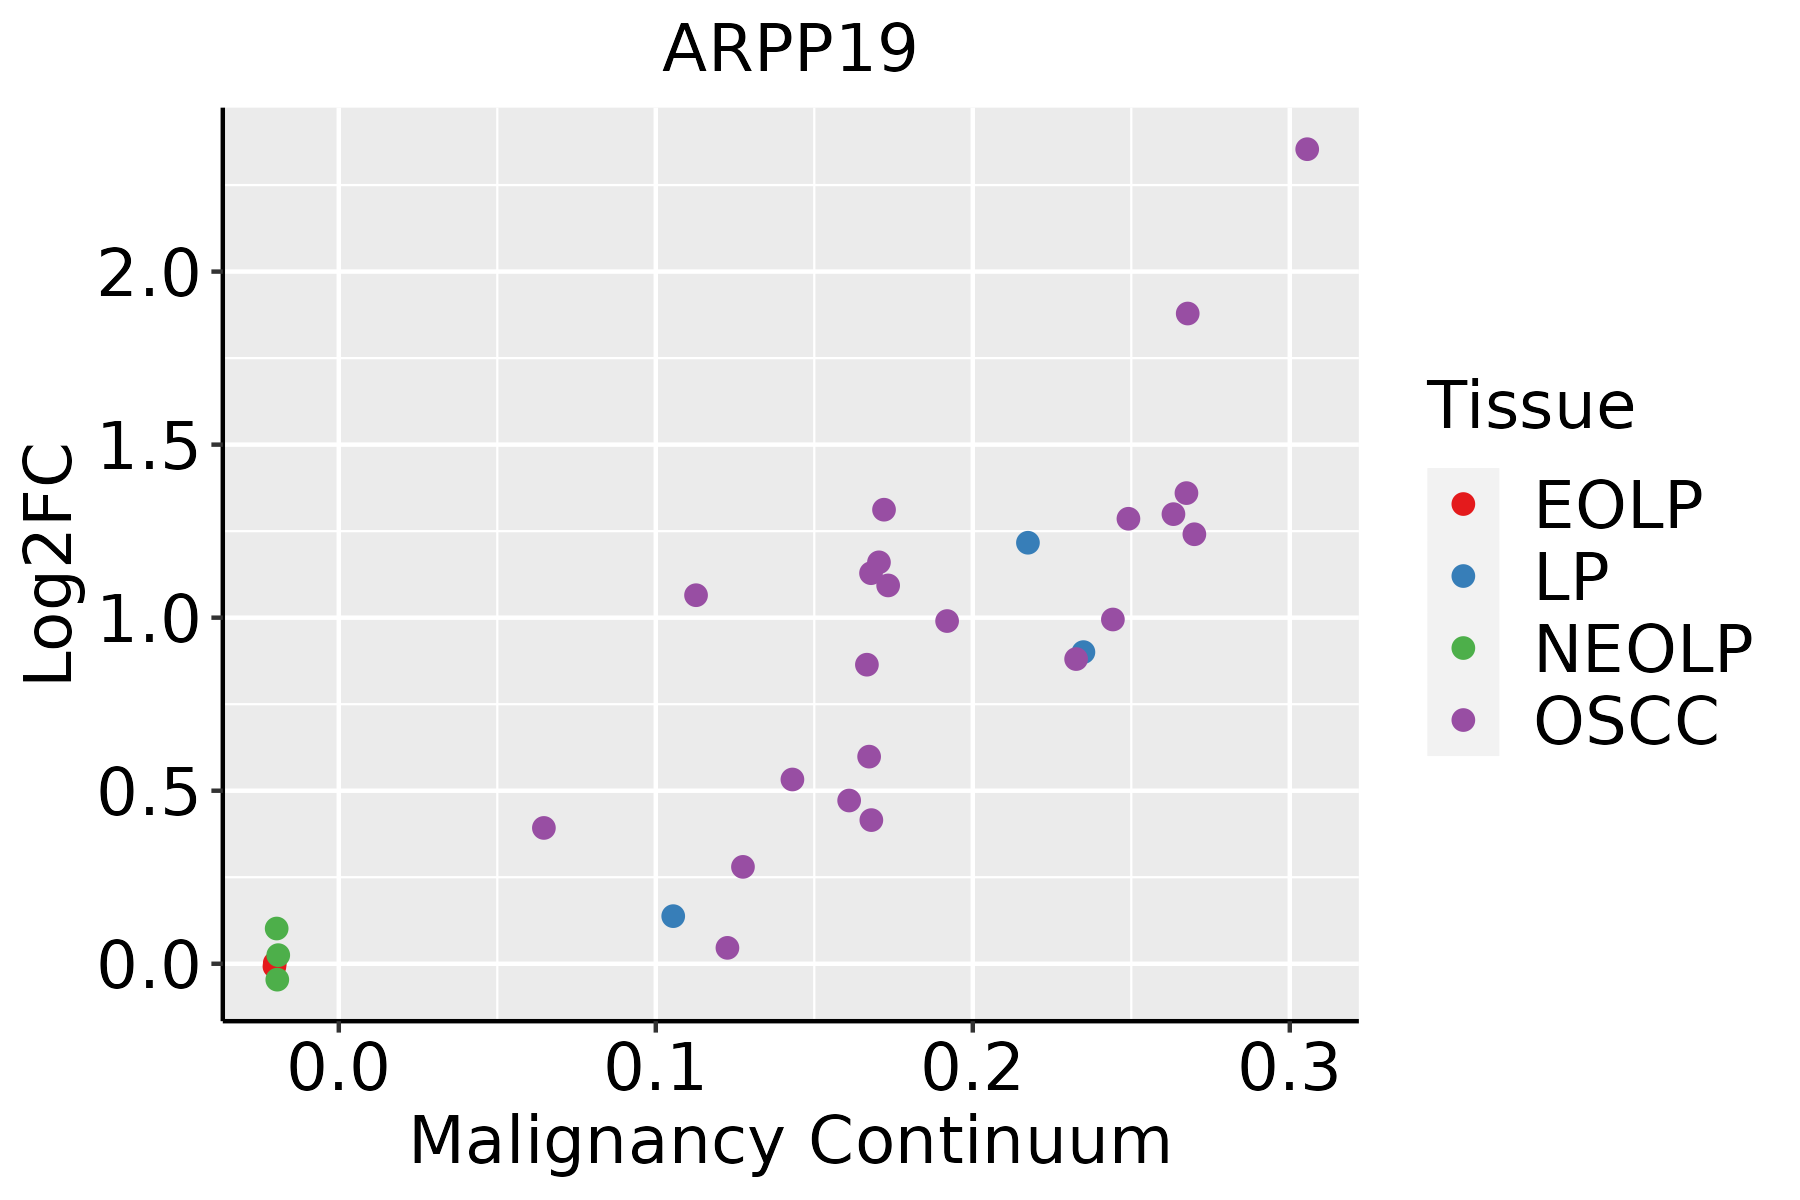 | EOLP: Erosive Oral lichen planus |
| LP: leukoplakia | ||
| NEOLP: Non-erosive oral lichen planus | ||
| OSCC: Oral squamous cell carcinoma | ||
| Skin | 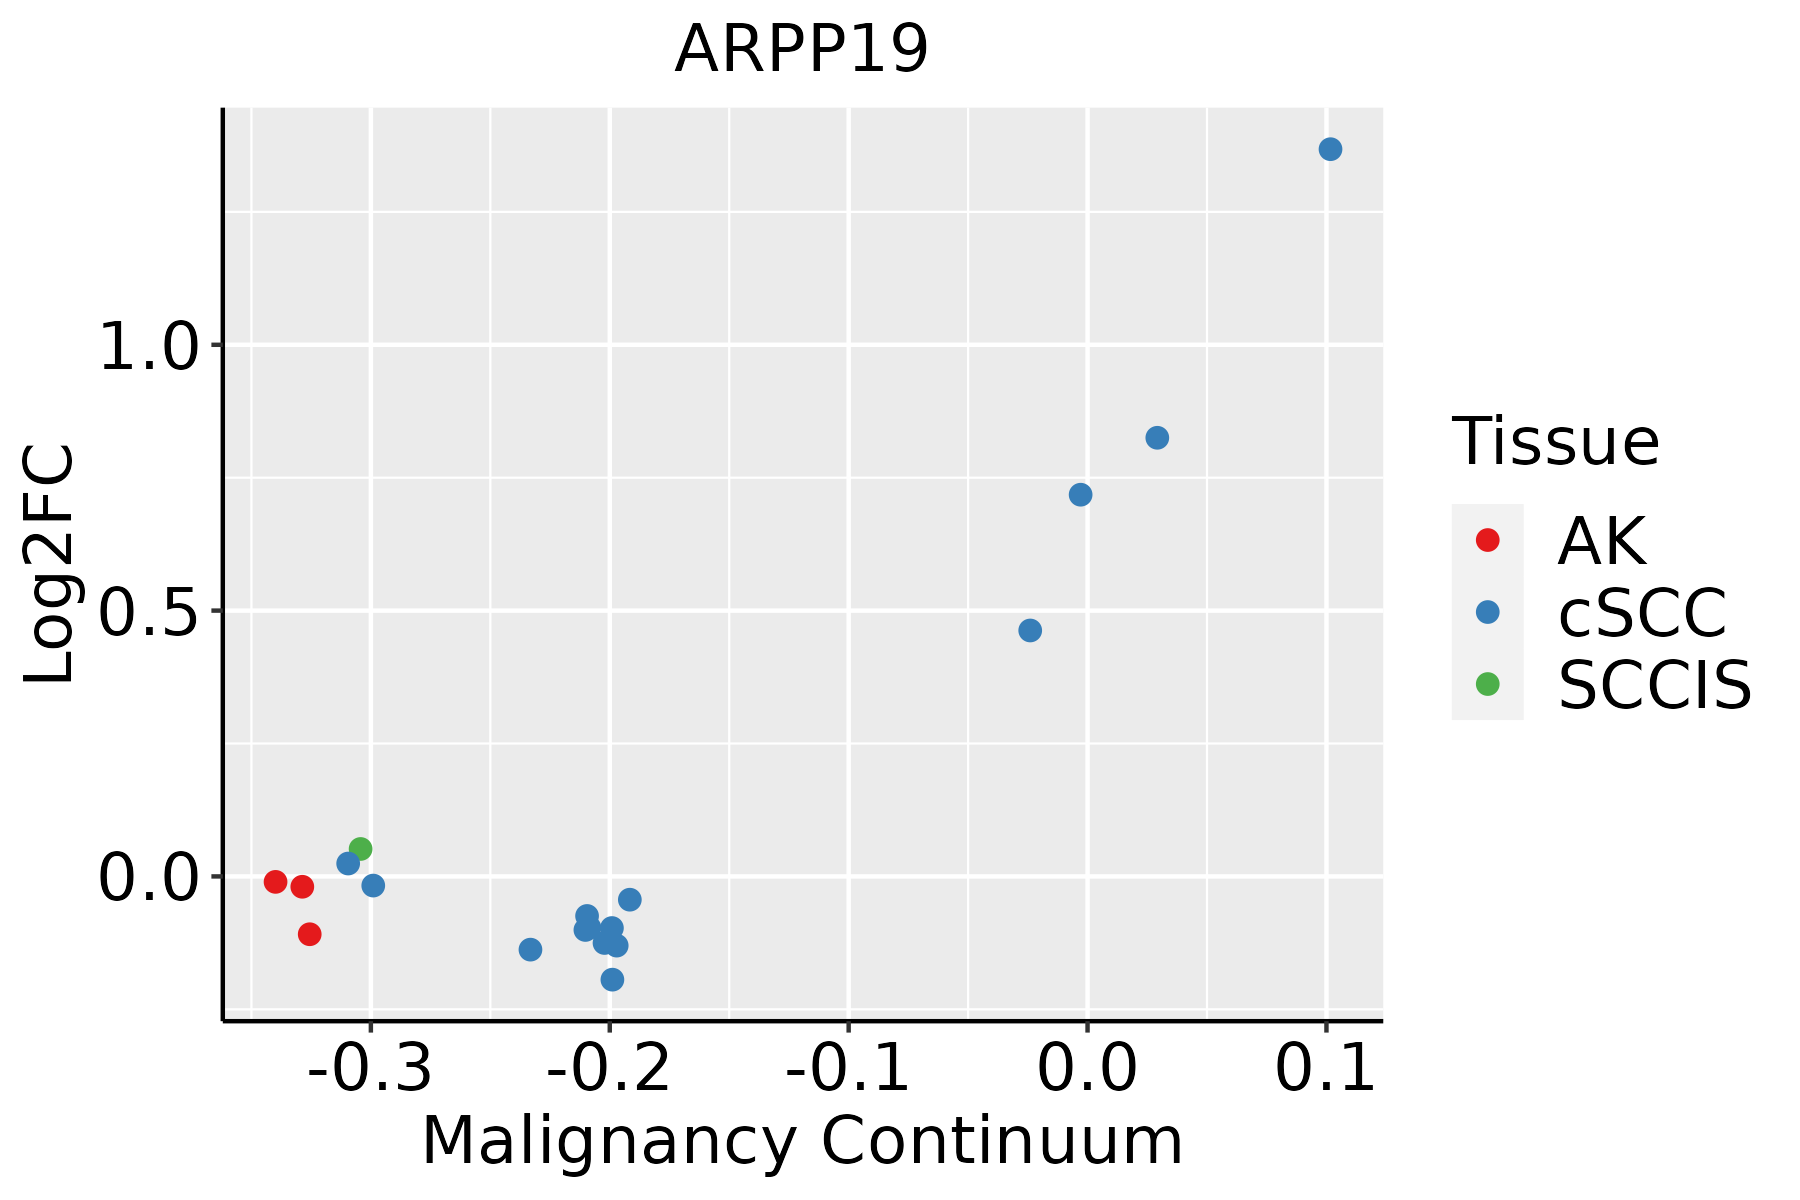 | AK: Actinic keratosis |
| cSCC: Cutaneous squamous cell carcinoma | ||
| SCCIS:squamous cell carcinoma in situ | ||
| Thyroid | 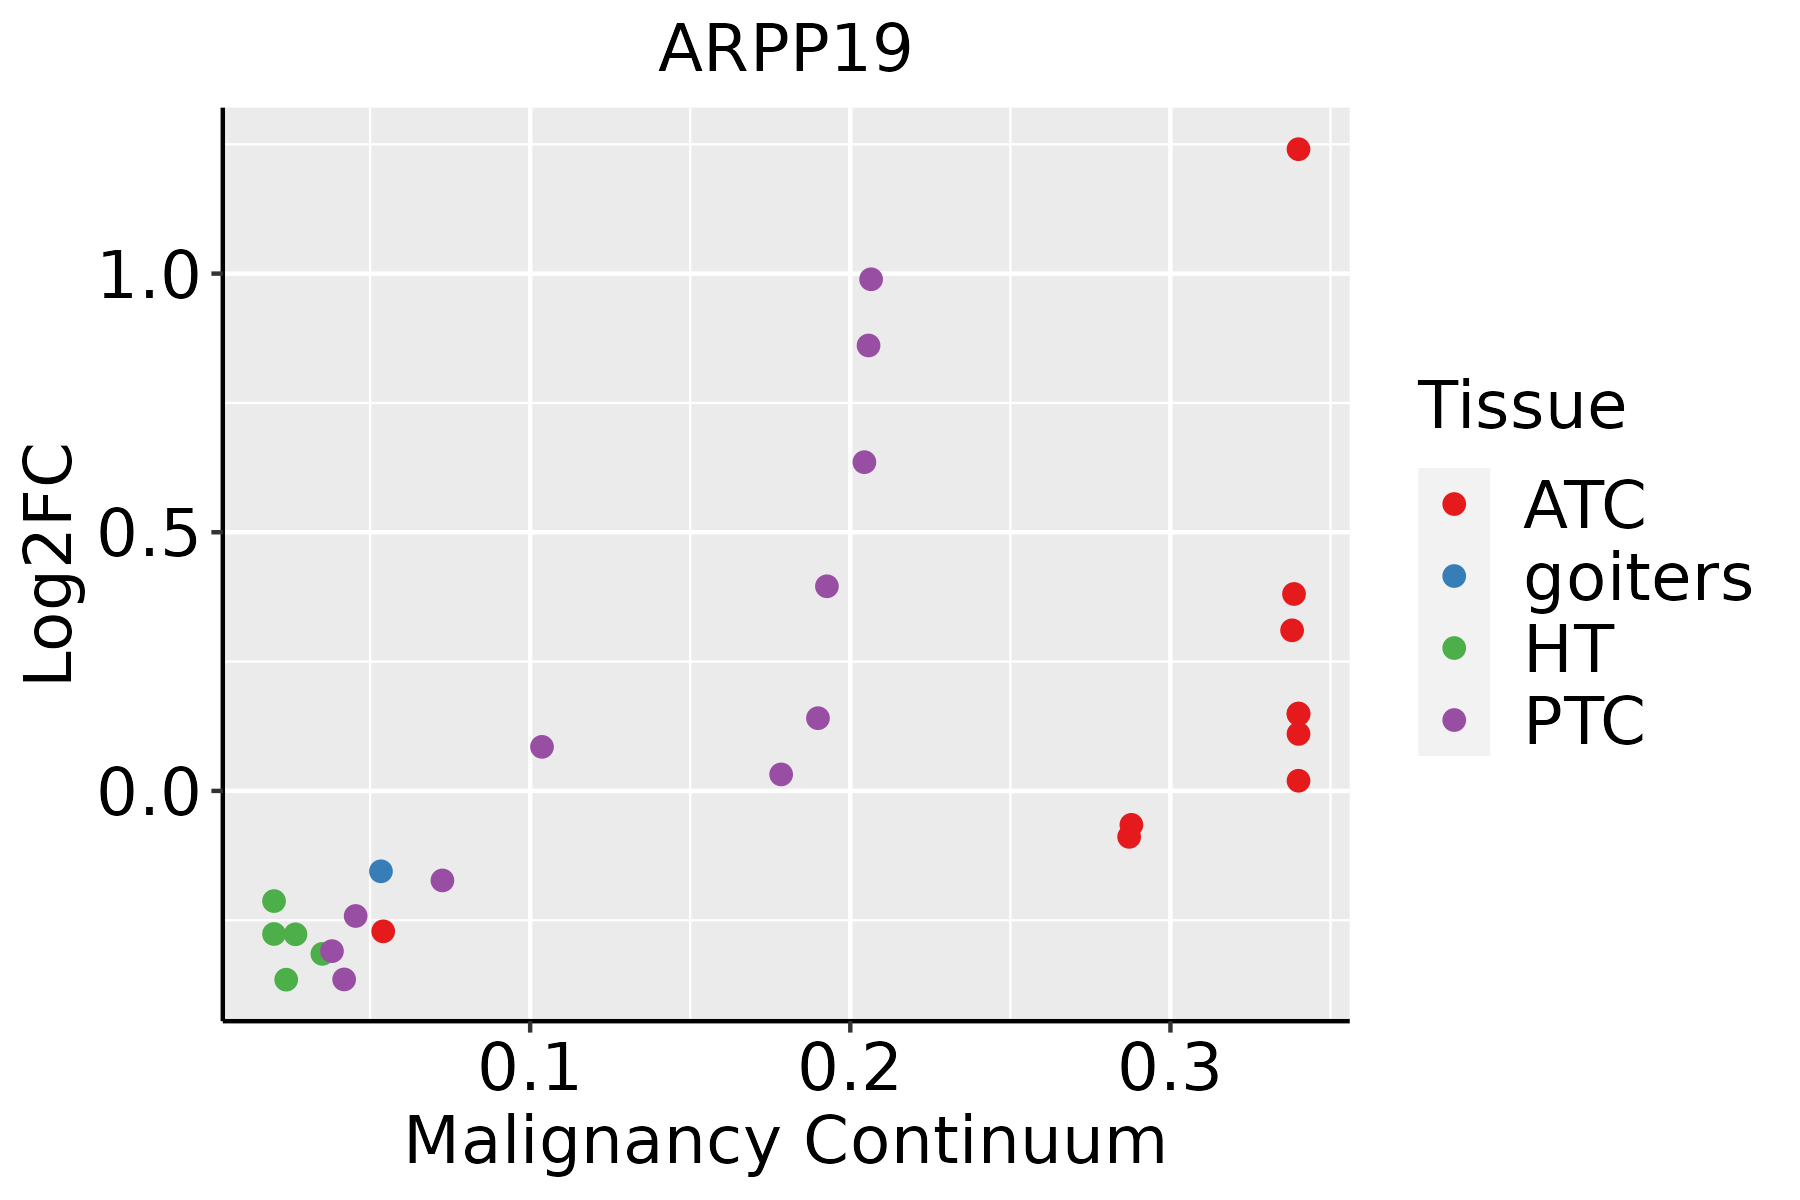 | ATC: Anaplastic thyroid cancer |
| HT: Hashimoto's thyroiditis | ||
| PTC: Papillary thyroid cancer |
| ∗log2FC in expression of this searched gene in stem-like cells from each diseased tissue sample relative to stem-like cells in normal samples in each tissue plotted against the malignancy continuum. Samples are colored based on if they are from different disease stage. |
Top |
Malignant transformation related pathway analysis |
| Find out the enriched GO biological processes and KEGG pathways involved in transition from healthy to precancer to cancer |
| Tissue | Disease Stage | Enriched GO biological Processes |
| Colorectum | AD |  |
| Colorectum | SER |  |
| Colorectum | MSS |  |
| Colorectum | MSI-H |  |
| Colorectum | FAP |  |
| ∗Top 15 enriched GO BP terms are showed in the bar plot of each disease state in each tissue. Each row represents a significant GO biological process which is colored according to the -log10(p.adjust). |
| Page: 1 2 3 4 5 6 7 8 9 |
| GO ID | Tissue | Disease Stage | Description | Gene Ratio | Bg Ratio | pvalue | p.adjust | Count |
| GO:00447729 | Esophagus | HGIN | mitotic cell cycle phase transition | 89/2587 | 424/18723 | 2.80e-05 | 7.21e-04 | 89 |
| GO:004593626 | Esophagus | HGIN | negative regulation of phosphate metabolic process | 89/2587 | 441/18723 | 1.24e-04 | 2.54e-03 | 89 |
| GO:001056326 | Esophagus | HGIN | negative regulation of phosphorus metabolic process | 89/2587 | 442/18723 | 1.34e-04 | 2.71e-03 | 89 |
| GO:000647017 | Esophagus | HGIN | protein dephosphorylation | 61/2587 | 281/18723 | 1.86e-04 | 3.51e-03 | 61 |
| GO:003530425 | Esophagus | HGIN | regulation of protein dephosphorylation | 24/2587 | 90/18723 | 9.27e-04 | 1.17e-02 | 24 |
| GO:003530320 | Esophagus | HGIN | regulation of dephosphorylation | 29/2587 | 128/18723 | 4.41e-03 | 3.87e-02 | 29 |
| GO:004477216 | Esophagus | ESCC | mitotic cell cycle phase transition | 281/8552 | 424/18723 | 4.63e-18 | 4.45e-16 | 281 |
| GO:0010563111 | Esophagus | ESCC | negative regulation of phosphorus metabolic process | 274/8552 | 442/18723 | 2.32e-12 | 9.41e-11 | 274 |
| GO:0045936111 | Esophagus | ESCC | negative regulation of phosphate metabolic process | 273/8552 | 441/18723 | 3.18e-12 | 1.25e-10 | 273 |
| GO:001631110 | Esophagus | ESCC | dephosphorylation | 251/8552 | 417/18723 | 1.26e-09 | 2.99e-08 | 251 |
| GO:00448394 | Esophagus | ESCC | cell cycle G2/M phase transition | 103/8552 | 148/18723 | 3.09e-09 | 6.67e-08 | 103 |
| GO:000647018 | Esophagus | ESCC | protein dephosphorylation | 177/8552 | 281/18723 | 3.13e-09 | 6.72e-08 | 177 |
| GO:00000864 | Esophagus | ESCC | G2/M transition of mitotic cell cycle | 96/8552 | 137/18723 | 6.00e-09 | 1.23e-07 | 96 |
| GO:0035304111 | Esophagus | ESCC | regulation of protein dephosphorylation | 66/8552 | 90/18723 | 8.82e-08 | 1.48e-06 | 66 |
| GO:0035303111 | Esophagus | ESCC | regulation of dephosphorylation | 88/8552 | 128/18723 | 1.04e-07 | 1.71e-06 | 88 |
| GO:00059969 | Esophagus | ESCC | monosaccharide metabolic process | 159/8552 | 257/18723 | 1.11e-07 | 1.81e-06 | 159 |
| GO:000726510 | Esophagus | ESCC | Ras protein signal transduction | 201/8552 | 337/18723 | 1.44e-07 | 2.30e-06 | 201 |
| GO:00193189 | Esophagus | ESCC | hexose metabolic process | 147/8552 | 237/18723 | 2.63e-07 | 3.94e-06 | 147 |
| GO:00060069 | Esophagus | ESCC | glucose metabolic process | 119/8552 | 196/18723 | 1.51e-05 | 1.36e-04 | 119 |
| GO:00442626 | Esophagus | ESCC | cellular carbohydrate metabolic process | 160/8552 | 283/18723 | 1.43e-04 | 9.66e-04 | 160 |
| Page: 1 2 3 4 5 6 7 8 9 |
| Pathway ID | Tissue | Disease Stage | Description | Gene Ratio | Bg Ratio | pvalue | p.adjust | qvalue | Count |
| Page: 1 |
Top |
Cell-cell communication analysis |
| Identification of potential cell-cell interactions between two cell types and their ligand-receptor pairs for different disease states |
| Ligand | Receptor | LRpair | Pathway | Tissue | Disease Stage |
| Page: 1 |
Top |
Single-cell gene regulatory network inference analysis |
| Find out the significant the regulons (TFs) and the target genes of each regulon across cell types for different disease states |
| TF | Cell Type | Tissue | Disease Stage | Target Gene | RSS | Regulon Activity |
| ∗The dot plots of a searched regulon are shown for all cell subpopulations in each disease state of each tissue based on the regulon specific score inferred using pySCENIC and by calculating the average expression. |
| Page: 1 |
Top |
Somatic mutation of malignant transformation related genes |
| Annotation of somatic variants for genes involved in malignant transformation |
| Hugo Symbol | Variant Class | Variant Classification | dbSNP RS | HGVSc | HGVSp | HGVSp Short | SWISSPROT | BIOTYPE | SIFT | PolyPhen | Tumor Sample Barcode | Tissue | Histology | Sex | Age | Stage | Therapy Types | Drugs | Outcome |
| ARPP19 | SNV | Missense_Mutation | rs770729483 | c.346N>A | p.Asp116Asn | p.D116N | protein_coding | tolerated(0.17) | probably_damaging(0.986) | TCGA-AA-3842-01 | Colorectum | colon adenocarcinoma | Male | <65 | III/IV | Chemotherapy | folinic | PD | |
| ARPP19 | SNV | Missense_Mutation | rs747291355 | c.341C>T | p.Pro114Leu | p.P114L | protein_coding | deleterious(0) | probably_damaging(0.985) | TCGA-A5-A0VP-01 | Endometrium | uterine corpus endometrioid carcinoma | Female | >=65 | I/II | Unknown | Unknown | SD | |
| ARPP19 | SNV | Missense_Mutation | rs777862029 | c.365N>T | p.Pro122Leu | p.P122L | protein_coding | deleterious(0.01) | benign(0.03) | TCGA-B5-A0JY-01 | Endometrium | uterine corpus endometrioid carcinoma | Female | <65 | III/IV | Chemotherapy | doxorubicin | SD | |
| ARPP19 | SNV | Missense_Mutation | novel | c.353N>T | p.Pro118Leu | p.P118L | protein_coding | deleterious(0) | possibly_damaging(0.905) | TCGA-B5-A5OC-01 | Endometrium | uterine corpus endometrioid carcinoma | Female | >=65 | III/IV | Chemotherapy | cisplatin | SD | |
| ARPP19 | SNV | Missense_Mutation | c.230N>C | p.Lys77Thr | p.K77T | protein_coding | deleterious(0.04) | probably_damaging(0.987) | TCGA-D1-A17Q-01 | Endometrium | uterine corpus endometrioid carcinoma | Female | <65 | I/II | Unknown | Unknown | SD | ||
| ARPP19 | SNV | Missense_Mutation | novel | c.224N>T | p.Gly75Val | p.G75V | protein_coding | deleterious(0) | probably_damaging(0.996) | TCGA-L9-A444-01 | Lung | lung adenocarcinoma | Female | <65 | I/II | Unknown | Unknown | SD | |
| ARPP19 | SNV | Missense_Mutation | novel | c.131N>T | p.Glu44Val | p.E44V | protein_coding | deleterious(0.01) | probably_damaging(1) | TCGA-BB-A5HY-01 | Oral cavity | head & neck squamous cell carcinoma | Male | <65 | I/II | Chemotherapy | cisplatin | PD | |
| ARPP19 | SNV | Missense_Mutation | c.161N>A | p.Arg54Lys | p.R54K | protein_coding | tolerated(1) | benign(0.108) | TCGA-BR-6452-01 | Stomach | stomach adenocarcinoma | Female | >=65 | I/II | Unknown | Unknown | SD | ||
| ARPP19 | SNV | Missense_Mutation | c.367N>C | p.Ser123Pro | p.S123P | protein_coding | tolerated(0.06) | benign(0.106) | TCGA-HU-A4G8-01 | Stomach | stomach adenocarcinoma | Female | >=65 | I/II | Chemotherapy | 5-fluorouracil | SD |
| Page: 1 |
Top |
Related drugs of malignant transformation related genes |
| Identification of chemicals and drugs interact with genes involved in malignant transfromation |
| (DGIdb 4.0) |
| Entrez ID | Symbol | Category | Interaction Types | Drug Claim Name | Drug Name | PMIDs |
| Page: 1 |

Copyright 2023-Present -The University of Texas Health Science Center at Houston |