
|
|||||
|
 | |
| |
| |
| |
| |
| |
|
Gene: ARPIN |
Gene summary for ARPIN |
| Gene information | Species | Human | Gene symbol | ARPIN | Gene ID | 348110 |
| Gene name | actin related protein 2/3 complex inhibitor | |
| Gene Alias | C15orf38 | |
| Cytomap | 15q26.1 | |
| Gene Type | protein-coding | GO ID | GO:0000902 | UniProtAcc | H0YMP5 |
Top |
Malignant transformation analysis |
| Identification of the aberrant gene expression in precancerous and cancerous lesions by comparing the gene expression of stem-like cells in diseased tissues with normal stem cells |
| Entrez ID | Symbol | Replicates | Species | Organ | Tissue | Adj P-value | Log2FC | Malignancy |
| 348110 | ARPIN | HTA11_3410_2000001011 | Human | Colorectum | AD | 2.54e-08 | 1.98e-01 | 0.0155 |
| 348110 | ARPIN | HTA11_2487_2000001011 | Human | Colorectum | SER | 5.80e-07 | 2.41e-01 | -0.1808 |
| 348110 | ARPIN | HTA11_1938_2000001011 | Human | Colorectum | AD | 4.00e-12 | 3.71e-01 | -0.0811 |
| 348110 | ARPIN | HTA11_78_2000001011 | Human | Colorectum | AD | 2.35e-06 | 2.20e-01 | -0.1088 |
| 348110 | ARPIN | HTA11_347_2000001011 | Human | Colorectum | AD | 2.88e-22 | 4.11e-01 | -0.1954 |
| 348110 | ARPIN | HTA11_411_2000001011 | Human | Colorectum | SER | 1.20e-07 | 5.38e-01 | -0.2602 |
| 348110 | ARPIN | HTA11_3361_2000001011 | Human | Colorectum | AD | 1.91e-05 | 2.02e-01 | -0.1207 |
| 348110 | ARPIN | HTA11_83_2000001011 | Human | Colorectum | SER | 3.64e-05 | 2.45e-01 | -0.1526 |
| 348110 | ARPIN | HTA11_696_2000001011 | Human | Colorectum | AD | 8.94e-11 | 2.47e-01 | -0.1464 |
| 348110 | ARPIN | HTA11_866_2000001011 | Human | Colorectum | AD | 1.42e-14 | 3.04e-01 | -0.1001 |
| 348110 | ARPIN | HTA11_1391_2000001011 | Human | Colorectum | AD | 2.92e-14 | 3.49e-01 | -0.059 |
| 348110 | ARPIN | HTA11_2992_2000001011 | Human | Colorectum | SER | 1.51e-04 | 3.33e-01 | -0.1706 |
| 348110 | ARPIN | HTA11_5212_2000001011 | Human | Colorectum | AD | 1.91e-11 | 4.59e-01 | -0.2061 |
| 348110 | ARPIN | HTA11_5216_2000001011 | Human | Colorectum | SER | 3.40e-02 | 2.22e-01 | -0.1462 |
| 348110 | ARPIN | HTA11_546_2000001011 | Human | Colorectum | AD | 2.76e-14 | 4.15e-01 | -0.0842 |
| 348110 | ARPIN | HTA11_7862_2000001011 | Human | Colorectum | AD | 1.12e-06 | 3.55e-01 | -0.0179 |
| 348110 | ARPIN | HTA11_866_3004761011 | Human | Colorectum | AD | 3.40e-12 | 2.77e-01 | 0.096 |
| 348110 | ARPIN | HTA11_4255_2000001011 | Human | Colorectum | SER | 3.40e-03 | 3.08e-01 | 0.0446 |
| 348110 | ARPIN | HTA11_7663_2000001011 | Human | Colorectum | SER | 7.58e-09 | 4.76e-01 | 0.0131 |
| 348110 | ARPIN | HTA11_10623_2000001011 | Human | Colorectum | AD | 4.46e-06 | 2.81e-01 | -0.0177 |
| Page: 1 2 3 4 5 6 |
| Tissue | Expression Dynamics | Abbreviation |
| Colorectum (GSE201348) |  | FAP: Familial adenomatous polyposis |
| CRC: Colorectal cancer | ||
| Colorectum (HTA11) |  | AD: Adenomas |
| SER: Sessile serrated lesions | ||
| MSI-H: Microsatellite-high colorectal cancer | ||
| MSS: Microsatellite stable colorectal cancer | ||
| Esophagus | 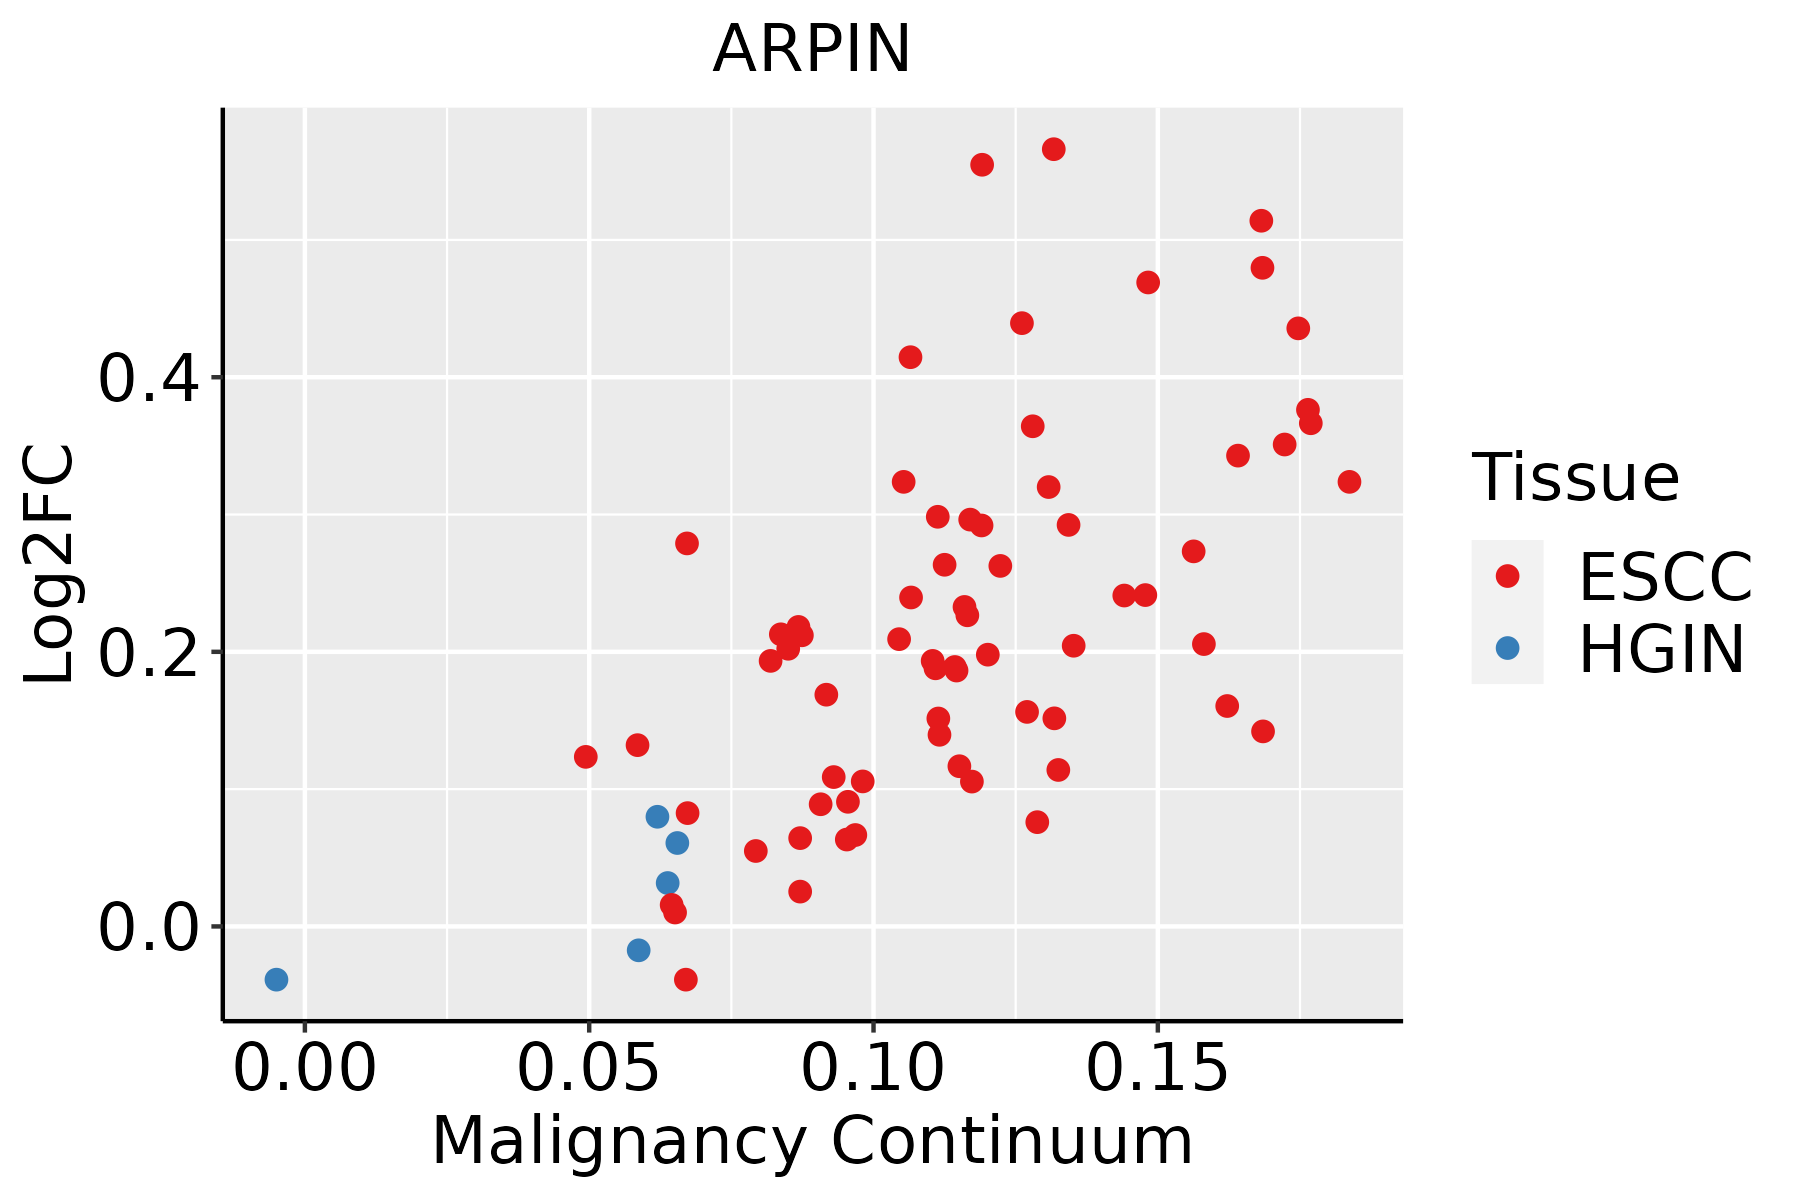 | ESCC: Esophageal squamous cell carcinoma |
| HGIN: High-grade intraepithelial neoplasias | ||
| LGIN: Low-grade intraepithelial neoplasias | ||
| Liver | 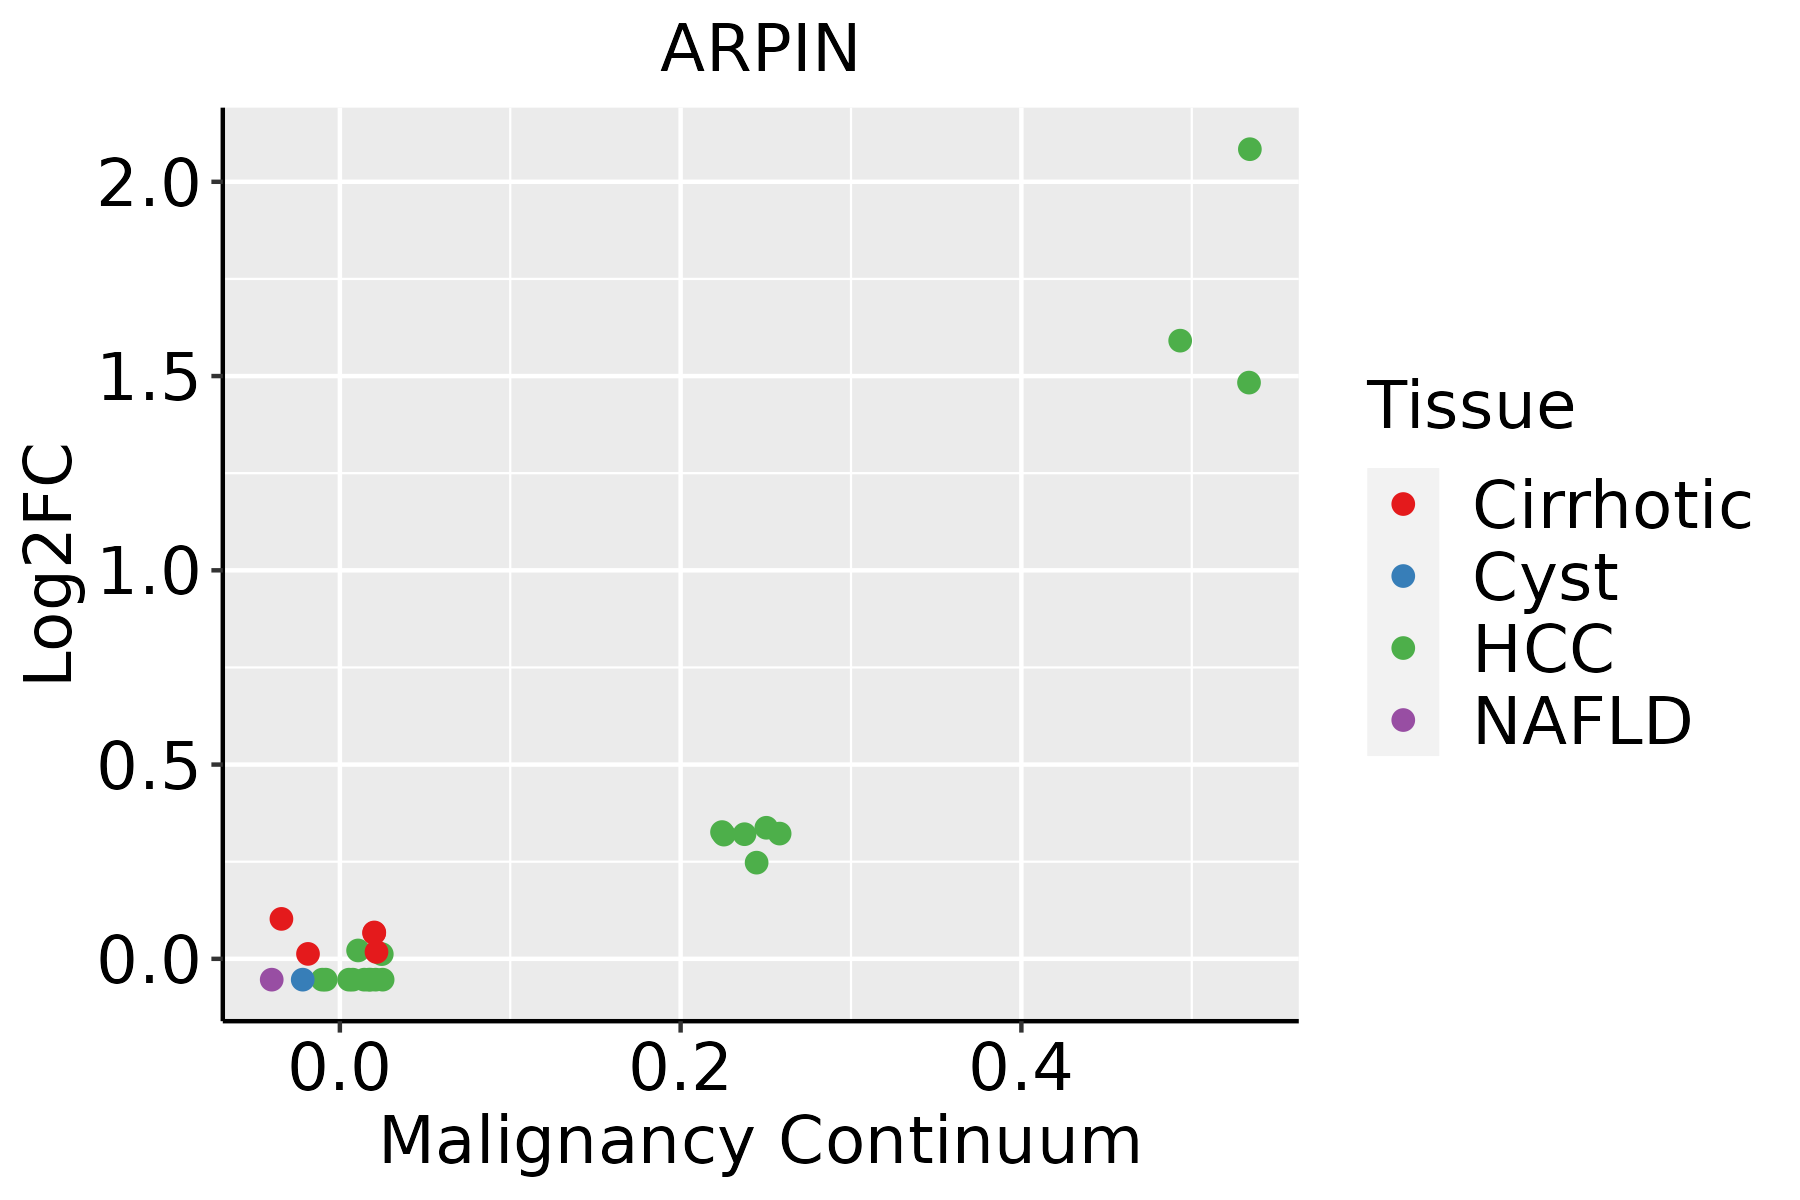 | HCC: Hepatocellular carcinoma |
| NAFLD: Non-alcoholic fatty liver disease | ||
| Oral Cavity | 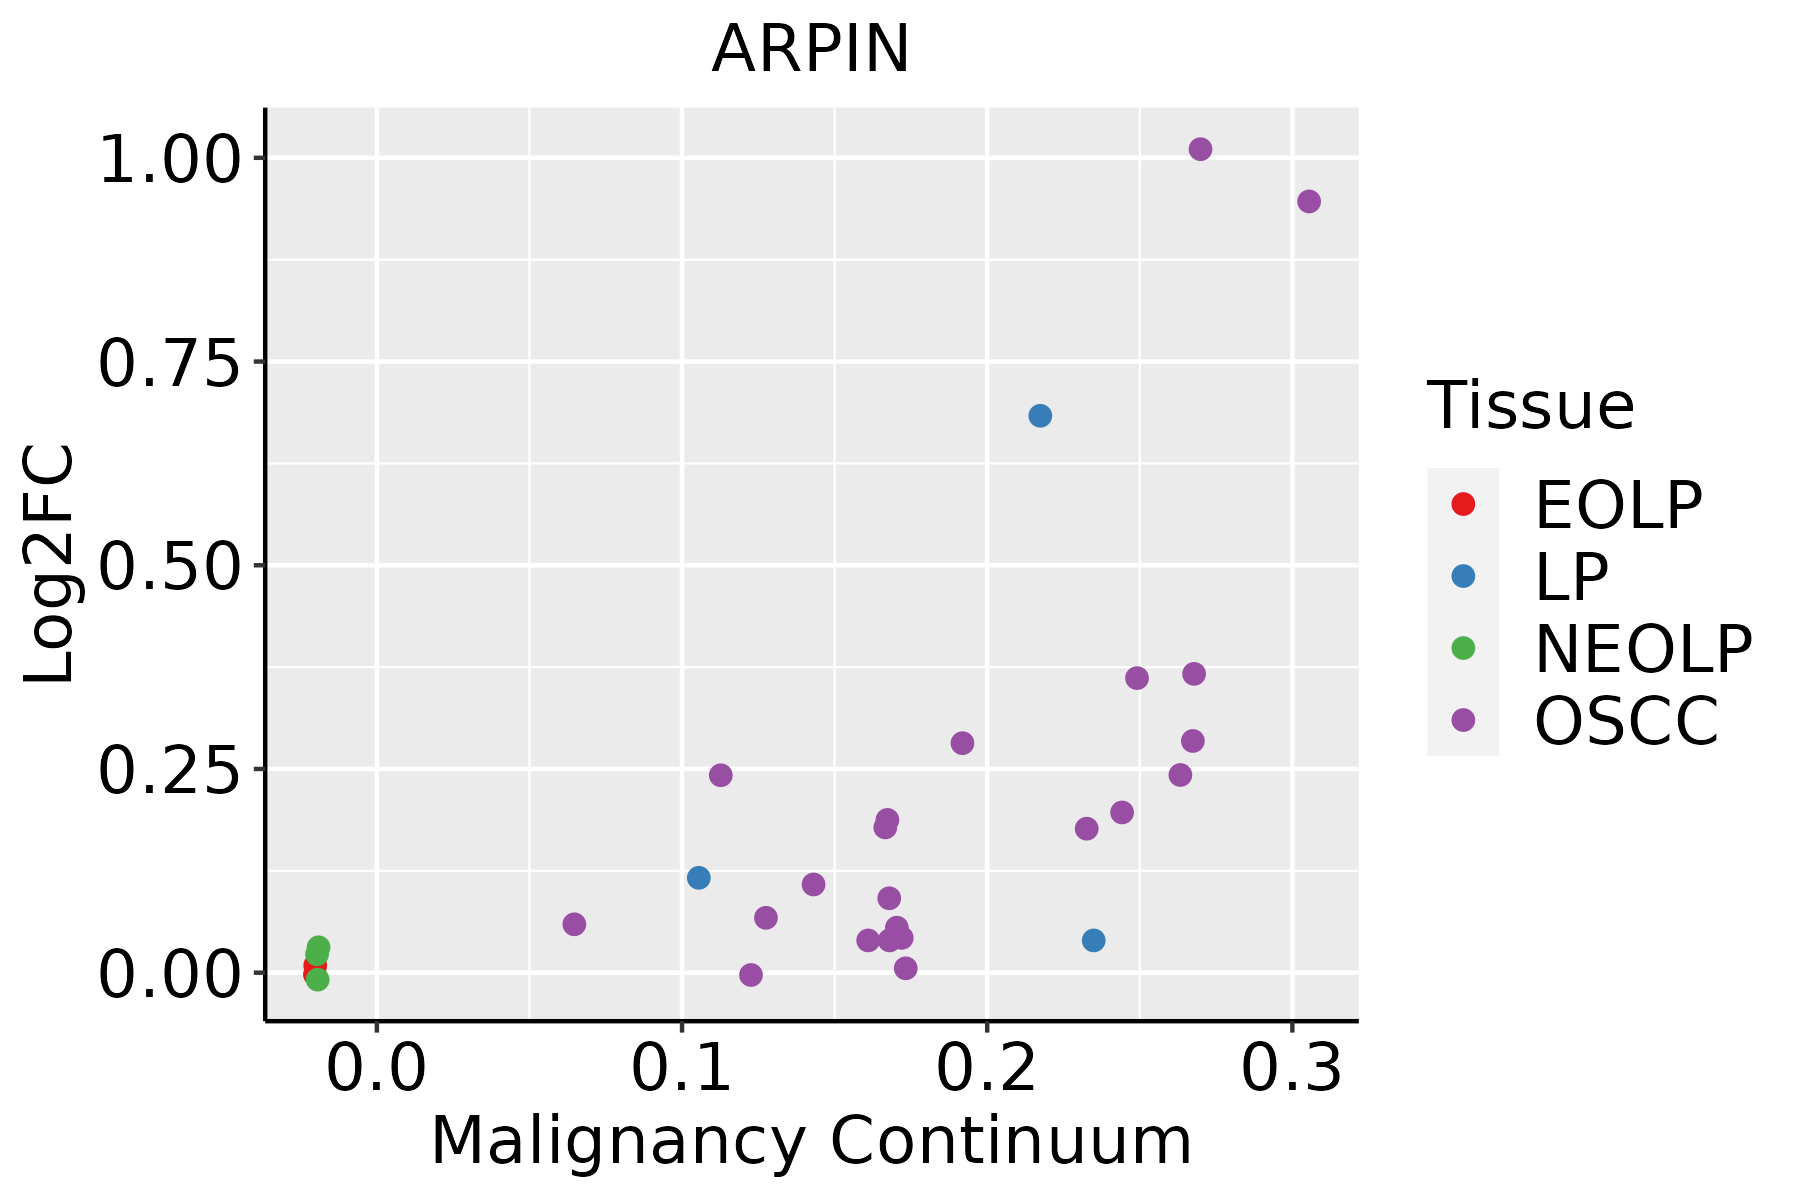 | EOLP: Erosive Oral lichen planus |
| LP: leukoplakia | ||
| NEOLP: Non-erosive oral lichen planus | ||
| OSCC: Oral squamous cell carcinoma |
| ∗log2FC in expression of this searched gene in stem-like cells from each diseased tissue sample relative to stem-like cells in normal samples in each tissue plotted against the malignancy continuum. Samples are colored based on if they are from different disease stage. |
Top |
Malignant transformation related pathway analysis |
| Find out the enriched GO biological processes and KEGG pathways involved in transition from healthy to precancer to cancer |
| Tissue | Disease Stage | Enriched GO biological Processes |
| Colorectum | AD |  |
| Colorectum | SER |  |
| Colorectum | MSS |  |
| Colorectum | MSI-H |  |
| Colorectum | FAP |  |
| ∗Top 15 enriched GO BP terms are showed in the bar plot of each disease state in each tissue. Each row represents a significant GO biological process which is colored according to the -log10(p.adjust). |
| Page: 1 2 3 4 5 6 7 8 9 |
| GO ID | Tissue | Disease Stage | Description | Gene Ratio | Bg Ratio | pvalue | p.adjust | Count |
| GO:00104989 | Breast | Precancer | proteasomal protein catabolic process | 58/1080 | 490/18723 | 1.54e-07 | 8.05e-06 | 58 |
| GO:0050727 | Breast | Precancer | regulation of inflammatory response | 44/1080 | 386/18723 | 1.26e-05 | 3.22e-04 | 44 |
| GO:00713568 | Breast | Precancer | cellular response to tumor necrosis factor | 28/1080 | 229/18723 | 1.42e-04 | 2.45e-03 | 28 |
| GO:00431619 | Breast | Precancer | proteasome-mediated ubiquitin-dependent protein catabolic process | 42/1080 | 412/18723 | 2.49e-04 | 3.72e-03 | 42 |
| GO:00085445 | Breast | Precancer | epidermis development | 35/1080 | 324/18723 | 2.71e-04 | 3.96e-03 | 35 |
| GO:00224119 | Breast | Precancer | cellular component disassembly | 44/1080 | 443/18723 | 3.17e-04 | 4.51e-03 | 44 |
| GO:00346128 | Breast | Precancer | response to tumor necrosis factor | 29/1080 | 253/18723 | 3.32e-04 | 4.70e-03 | 29 |
| GO:00099136 | Breast | Precancer | epidermal cell differentiation | 23/1080 | 202/18723 | 1.43e-03 | 1.50e-02 | 23 |
| GO:00302163 | Breast | Precancer | keratinocyte differentiation | 17/1080 | 139/18723 | 2.71e-03 | 2.39e-02 | 17 |
| GO:00072496 | Breast | Precancer | I-kappaB kinase/NF-kappaB signaling | 27/1080 | 281/18723 | 6.58e-03 | 4.53e-02 | 27 |
| GO:001049814 | Breast | IDC | proteasomal protein catabolic process | 75/1434 | 490/18723 | 5.59e-09 | 4.41e-07 | 75 |
| GO:004316114 | Breast | IDC | proteasome-mediated ubiquitin-dependent protein catabolic process | 57/1434 | 412/18723 | 9.55e-06 | 2.68e-04 | 57 |
| GO:007135613 | Breast | IDC | cellular response to tumor necrosis factor | 35/1434 | 229/18723 | 6.64e-05 | 1.35e-03 | 35 |
| GO:003461213 | Breast | IDC | response to tumor necrosis factor | 36/1434 | 253/18723 | 2.29e-04 | 3.64e-03 | 36 |
| GO:00507271 | Breast | IDC | regulation of inflammatory response | 48/1434 | 386/18723 | 5.99e-04 | 7.54e-03 | 48 |
| GO:00431227 | Breast | IDC | regulation of I-kappaB kinase/NF-kappaB signaling | 34/1434 | 249/18723 | 7.18e-04 | 8.77e-03 | 34 |
| GO:000724914 | Breast | IDC | I-kappaB kinase/NF-kappaB signaling | 37/1434 | 281/18723 | 8.58e-04 | 9.98e-03 | 37 |
| GO:000854412 | Breast | IDC | epidermis development | 41/1434 | 324/18723 | 1.03e-03 | 1.14e-02 | 41 |
| GO:000991312 | Breast | IDC | epidermal cell differentiation | 28/1434 | 202/18723 | 1.62e-03 | 1.60e-02 | 28 |
| GO:00431236 | Breast | IDC | positive regulation of I-kappaB kinase/NF-kappaB signaling | 26/1434 | 186/18723 | 2.06e-03 | 1.95e-02 | 26 |
| Page: 1 2 3 4 5 6 7 8 9 10 11 12 13 14 15 16 17 18 19 |
| Pathway ID | Tissue | Disease Stage | Description | Gene Ratio | Bg Ratio | pvalue | p.adjust | qvalue | Count |
| Page: 1 |
Top |
Cell-cell communication analysis |
| Identification of potential cell-cell interactions between two cell types and their ligand-receptor pairs for different disease states |
| Ligand | Receptor | LRpair | Pathway | Tissue | Disease Stage |
| Page: 1 |
Top |
Single-cell gene regulatory network inference analysis |
| Find out the significant the regulons (TFs) and the target genes of each regulon across cell types for different disease states |
| TF | Cell Type | Tissue | Disease Stage | Target Gene | RSS | Regulon Activity |
| ∗The dot plots of a searched regulon are shown for all cell subpopulations in each disease state of each tissue based on the regulon specific score inferred using pySCENIC and by calculating the average expression. |
| Page: 1 |
Top |
Somatic mutation of malignant transformation related genes |
| Annotation of somatic variants for genes involved in malignant transformation |
| Hugo Symbol | Variant Class | Variant Classification | dbSNP RS | HGVSc | HGVSp | HGVSp Short | SWISSPROT | BIOTYPE | SIFT | PolyPhen | Tumor Sample Barcode | Tissue | Histology | Sex | Age | Stage | Therapy Types | Drugs | Outcome |
| ARPIN | SNV | Missense_Mutation | c.655G>A | p.Ala219Thr | p.A219T | Q7Z6K5 | protein_coding | deleterious(0.02) | probably_damaging(0.961) | TCGA-A1-A0SO-01 | Breast | breast invasive carcinoma | Female | >=65 | I/II | Chemotherapy | SD | ||
| ARPIN | SNV | Missense_Mutation | c.134N>T | p.Ser45Phe | p.S45F | Q7Z6K5 | protein_coding | deleterious(0) | probably_damaging(0.999) | TCGA-GM-A2DO-01 | Breast | breast invasive carcinoma | Female | <65 | I/II | Hormone Therapy | tamoxiphen | CR | |
| ARPIN | deletion | Frame_Shift_Del | novel | c.608delN | p.Lys203SerfsTer38 | p.K203Sfs*38 | Q7Z6K5 | protein_coding | TCGA-D8-A27V-01 | Breast | breast invasive carcinoma | Female | <65 | I/II | Hormone Therapy | tamoxiphen | SD | ||
| ARPIN | SNV | Missense_Mutation | c.143G>A | p.Ser48Asn | p.S48N | Q7Z6K5 | protein_coding | tolerated(0.33) | benign(0.01) | TCGA-AA-3864-01 | Colorectum | colon adenocarcinoma | Male | >=65 | I/II | Unknown | Unknown | SD | |
| ARPIN | SNV | Missense_Mutation | rs201638212 | c.416N>T | p.Ala139Val | p.A139V | Q7Z6K5 | protein_coding | deleterious(0.01) | probably_damaging(0.999) | TCGA-AG-A002-01 | Colorectum | rectum adenocarcinoma | Male | <65 | I/II | Unknown | Unknown | SD |
| ARPIN | SNV | Missense_Mutation | novel | c.505N>A | p.Leu169Met | p.L169M | Q7Z6K5 | protein_coding | deleterious(0) | possibly_damaging(0.682) | TCGA-AJ-A3EK-01 | Endometrium | uterine corpus endometrioid carcinoma | Female | <65 | I/II | Chemotherapy | carboplatin | CR |
| ARPIN | SNV | Missense_Mutation | rs370605817 | c.212G>A | p.Arg71His | p.R71H | Q7Z6K5 | protein_coding | deleterious(0.04) | benign(0.015) | TCGA-AP-A051-01 | Endometrium | uterine corpus endometrioid carcinoma | Female | >=65 | I/II | Unknown | Unknown | SD |
| ARPIN | SNV | Missense_Mutation | novel | c.127N>A | p.Asp43Asn | p.D43N | Q7Z6K5 | protein_coding | deleterious(0.03) | probably_damaging(0.999) | TCGA-AP-A1DV-01 | Endometrium | uterine corpus endometrioid carcinoma | Female | <65 | I/II | Unknown | Unknown | SD |
| ARPIN | SNV | Missense_Mutation | c.614N>T | p.Ser205Leu | p.S205L | Q7Z6K5 | protein_coding | tolerated(0.13) | benign(0.003) | TCGA-B5-A0JY-01 | Endometrium | uterine corpus endometrioid carcinoma | Female | <65 | III/IV | Chemotherapy | doxorubicin | SD | |
| ARPIN | SNV | Missense_Mutation | rs749897855 | c.215N>A | p.Arg72His | p.R72H | Q7Z6K5 | protein_coding | deleterious(0) | probably_damaging(0.975) | TCGA-B5-A3FC-01 | Endometrium | uterine corpus endometrioid carcinoma | Female | <65 | I/II | Unknown | Unknown | SD |
| Page: 1 2 |
Top |
Related drugs of malignant transformation related genes |
| Identification of chemicals and drugs interact with genes involved in malignant transfromation |
| (DGIdb 4.0) |
| Entrez ID | Symbol | Category | Interaction Types | Drug Claim Name | Drug Name | PMIDs |
| Page: 1 |

Copyright 2023-Present -The University of Texas Health Science Center at Houston |