
|
|||||
|
 | |
| |
| |
| |
| |
| |
|
Gene: ARPC4 |
Gene summary for ARPC4 |
| Gene information | Species | Human | Gene symbol | ARPC4 | Gene ID | 10093 |
| Gene name | actin related protein 2/3 complex subunit 4 | |
| Gene Alias | ARC20 | |
| Cytomap | 3p25.3 | |
| Gene Type | protein-coding | GO ID | GO:0006996 | UniProtAcc | P59998 |
Top |
Malignant transformation analysis |
| Identification of the aberrant gene expression in precancerous and cancerous lesions by comparing the gene expression of stem-like cells in diseased tissues with normal stem cells |
| Entrez ID | Symbol | Replicates | Species | Organ | Tissue | Adj P-value | Log2FC | Malignancy |
| 10093 | ARPC4 | HTA11_3410_2000001011 | Human | Colorectum | AD | 7.51e-33 | 5.43e-01 | 0.0155 |
| 10093 | ARPC4 | HTA11_2487_2000001011 | Human | Colorectum | SER | 1.74e-47 | 1.13e+00 | -0.1808 |
| 10093 | ARPC4 | HTA11_2951_2000001011 | Human | Colorectum | AD | 6.82e-15 | 7.16e-01 | 0.0216 |
| 10093 | ARPC4 | HTA11_1938_2000001011 | Human | Colorectum | AD | 1.60e-37 | 1.01e+00 | -0.0811 |
| 10093 | ARPC4 | HTA11_78_2000001011 | Human | Colorectum | AD | 9.72e-21 | 4.73e-01 | -0.1088 |
| 10093 | ARPC4 | HTA11_347_2000001011 | Human | Colorectum | AD | 6.11e-63 | 9.82e-01 | -0.1954 |
| 10093 | ARPC4 | HTA11_411_2000001011 | Human | Colorectum | SER | 1.38e-28 | 2.00e+00 | -0.2602 |
| 10093 | ARPC4 | HTA11_2112_2000001011 | Human | Colorectum | SER | 7.50e-21 | 1.11e+00 | -0.2196 |
| 10093 | ARPC4 | HTA11_3361_2000001011 | Human | Colorectum | AD | 2.22e-42 | 1.21e+00 | -0.1207 |
| 10093 | ARPC4 | HTA11_83_2000001011 | Human | Colorectum | SER | 4.09e-28 | 9.52e-01 | -0.1526 |
| 10093 | ARPC4 | HTA11_696_2000001011 | Human | Colorectum | AD | 8.29e-72 | 1.24e+00 | -0.1464 |
| 10093 | ARPC4 | HTA11_866_2000001011 | Human | Colorectum | AD | 3.10e-42 | 7.75e-01 | -0.1001 |
| 10093 | ARPC4 | HTA11_1391_2000001011 | Human | Colorectum | AD | 1.44e-58 | 1.23e+00 | -0.059 |
| 10093 | ARPC4 | HTA11_2992_2000001011 | Human | Colorectum | SER | 1.22e-31 | 1.28e+00 | -0.1706 |
| 10093 | ARPC4 | HTA11_5212_2000001011 | Human | Colorectum | AD | 4.66e-34 | 9.87e-01 | -0.2061 |
| 10093 | ARPC4 | HTA11_5216_2000001011 | Human | Colorectum | SER | 1.31e-28 | 1.15e+00 | -0.1462 |
| 10093 | ARPC4 | HTA11_546_2000001011 | Human | Colorectum | AD | 9.03e-33 | 9.18e-01 | -0.0842 |
| 10093 | ARPC4 | HTA11_9341_2000001011 | Human | Colorectum | SER | 4.42e-10 | 6.00e-01 | -0.00410000000000005 |
| 10093 | ARPC4 | HTA11_7862_2000001011 | Human | Colorectum | AD | 7.42e-19 | 5.42e-01 | -0.0179 |
| 10093 | ARPC4 | HTA11_866_3004761011 | Human | Colorectum | AD | 5.18e-29 | 6.15e-01 | 0.096 |
| Page: 1 2 3 4 5 6 7 8 9 |
| Tissue | Expression Dynamics | Abbreviation |
| Colorectum (GSE201348) |  | FAP: Familial adenomatous polyposis |
| CRC: Colorectal cancer | ||
| Colorectum (HTA11) |  | AD: Adenomas |
| SER: Sessile serrated lesions | ||
| MSI-H: Microsatellite-high colorectal cancer | ||
| MSS: Microsatellite stable colorectal cancer | ||
| Esophagus | 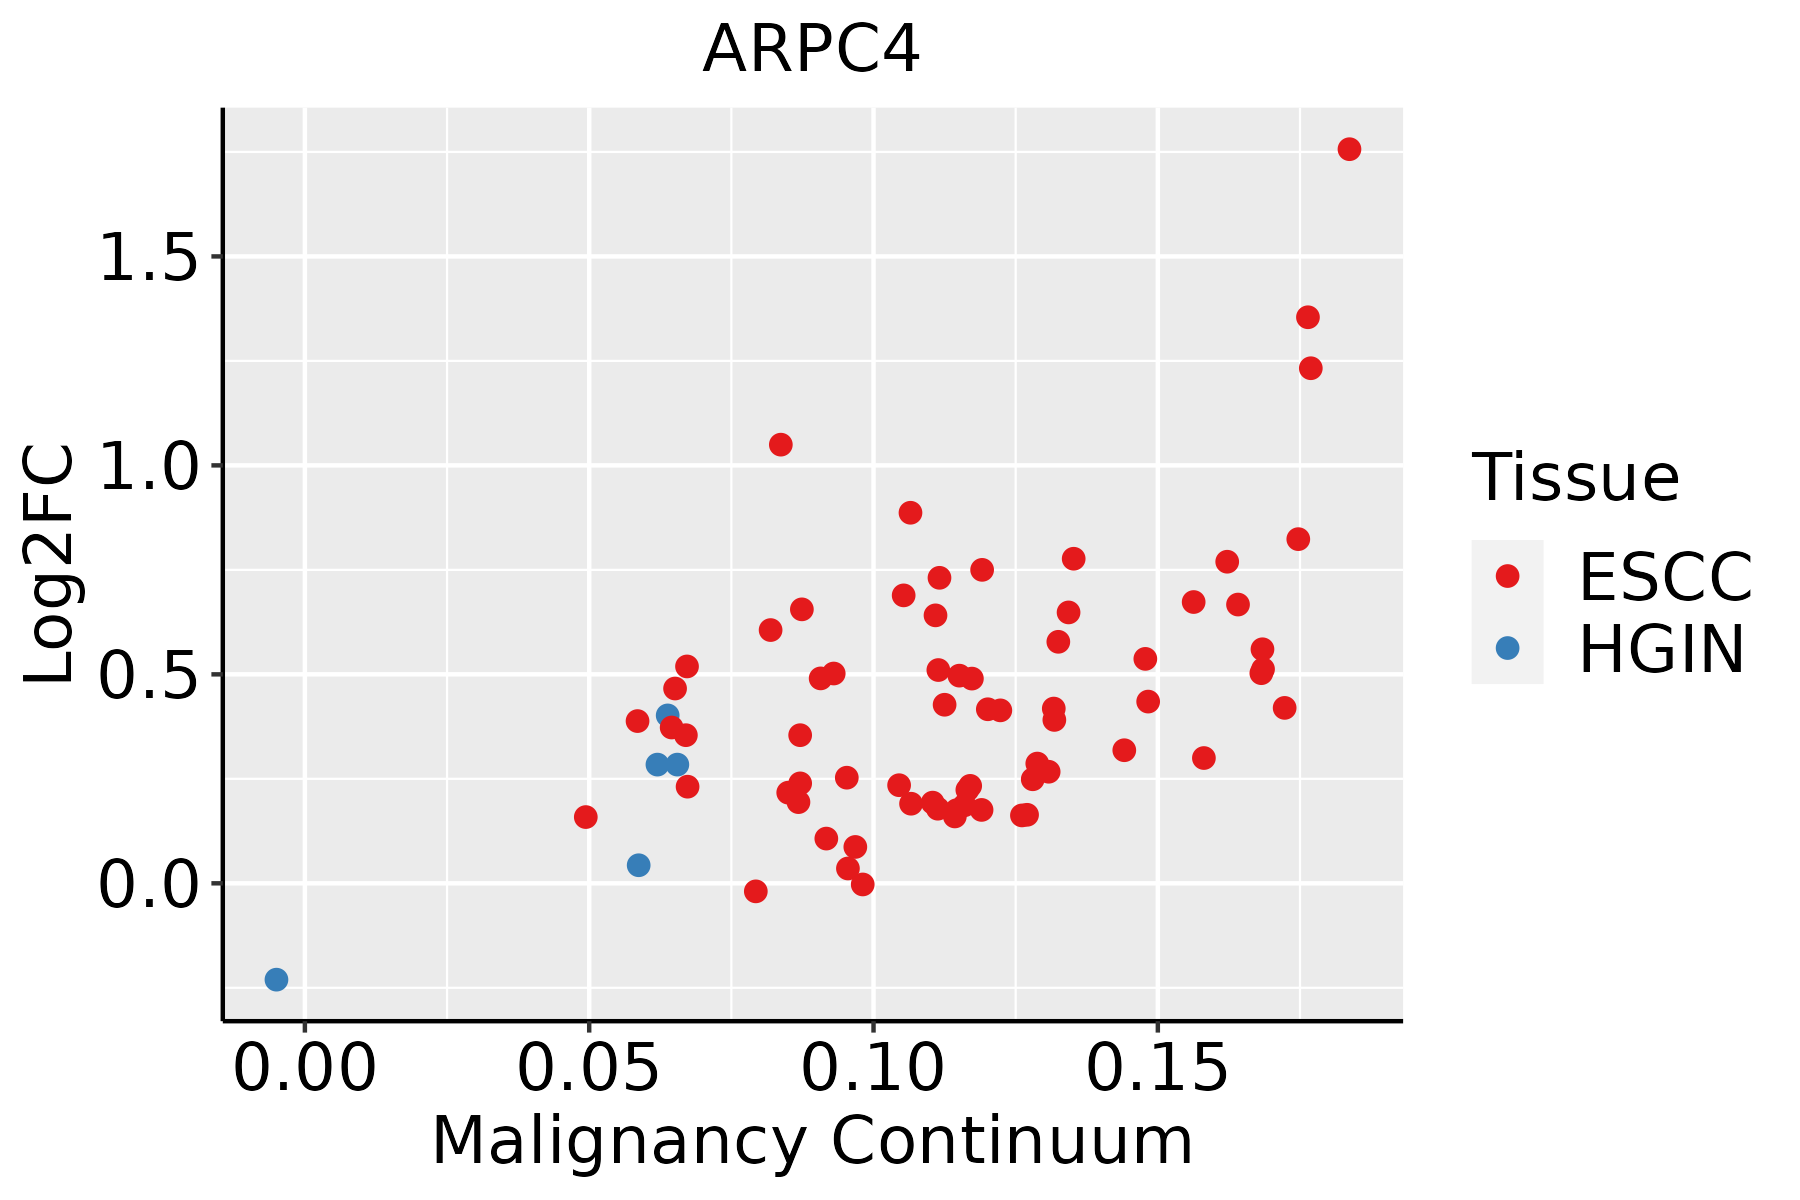 | ESCC: Esophageal squamous cell carcinoma |
| HGIN: High-grade intraepithelial neoplasias | ||
| LGIN: Low-grade intraepithelial neoplasias | ||
| Liver | 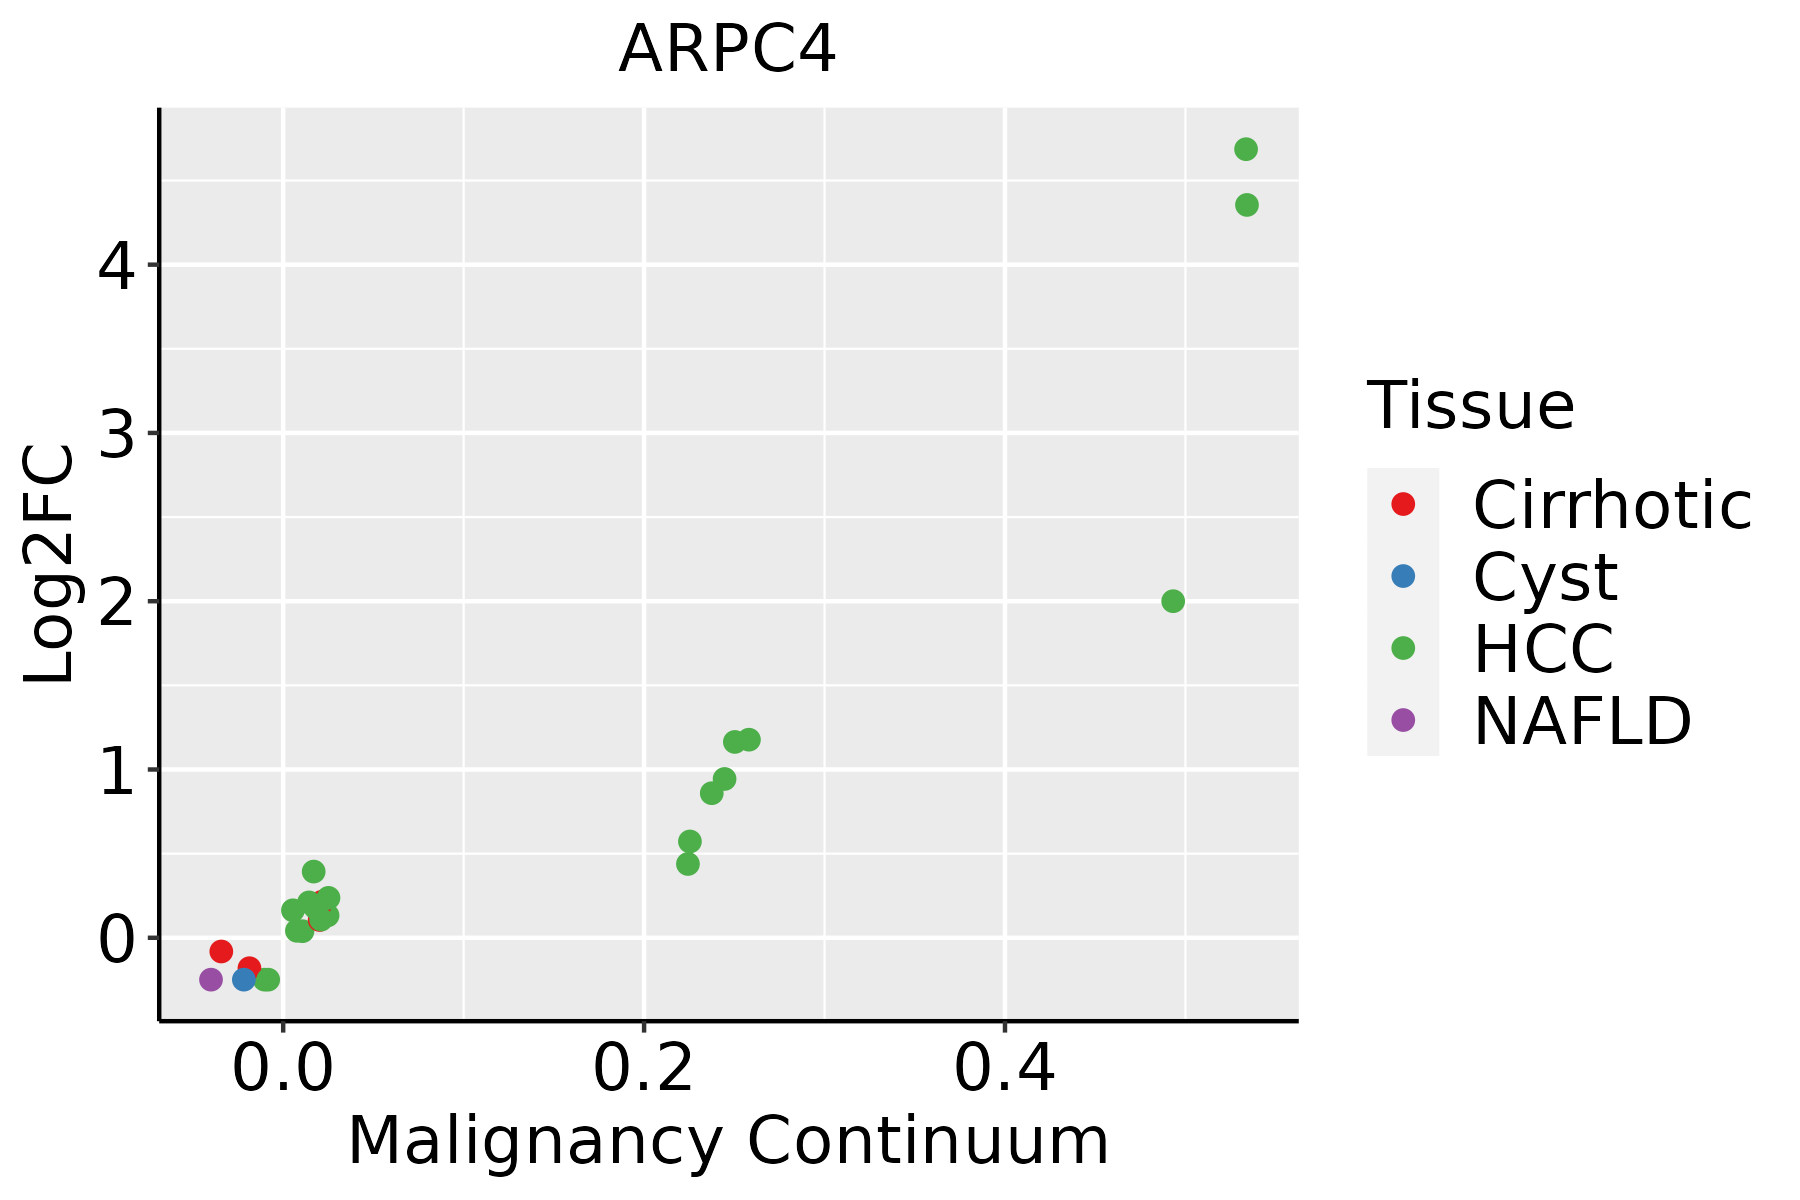 | HCC: Hepatocellular carcinoma |
| NAFLD: Non-alcoholic fatty liver disease | ||
| Oral Cavity | 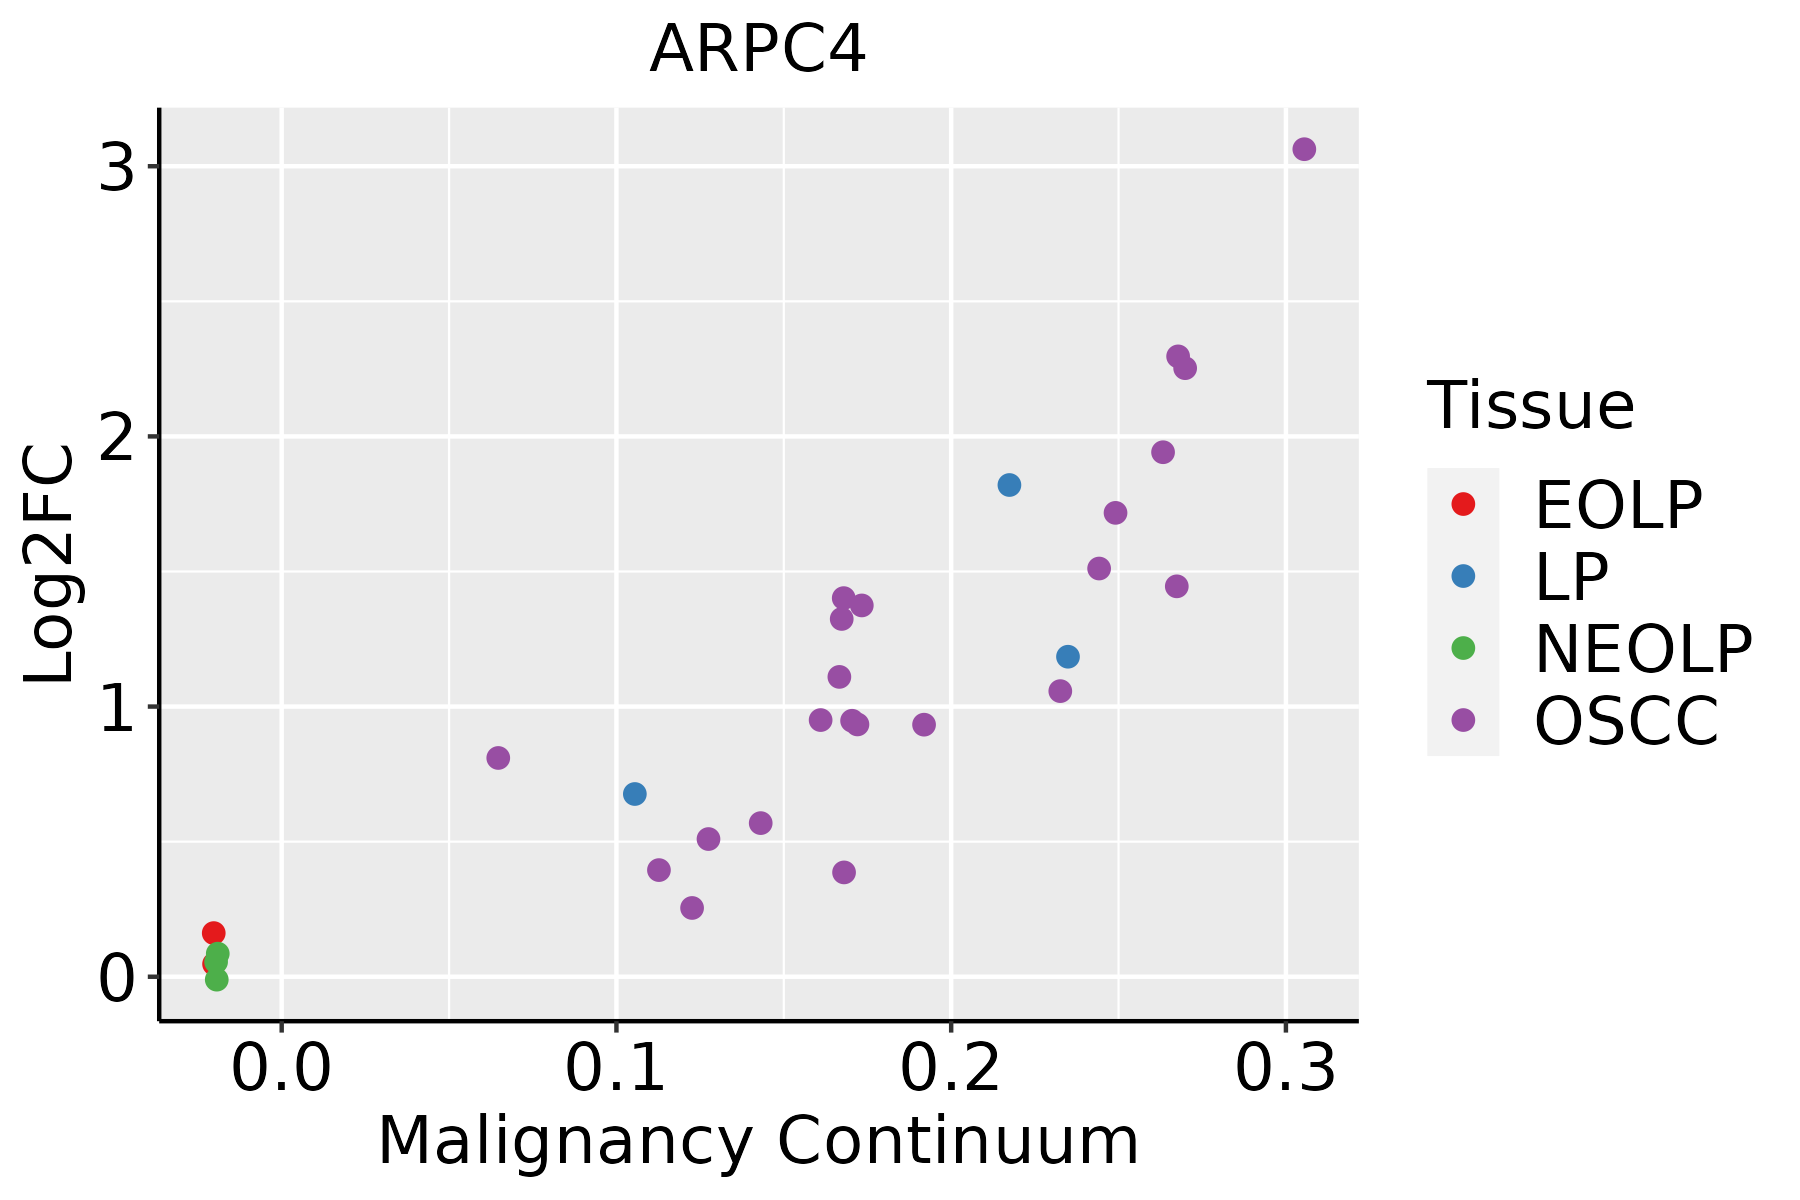 | EOLP: Erosive Oral lichen planus |
| LP: leukoplakia | ||
| NEOLP: Non-erosive oral lichen planus | ||
| OSCC: Oral squamous cell carcinoma | ||
| Prostate |  | BPH: Benign Prostatic Hyperplasia |
| Skin | 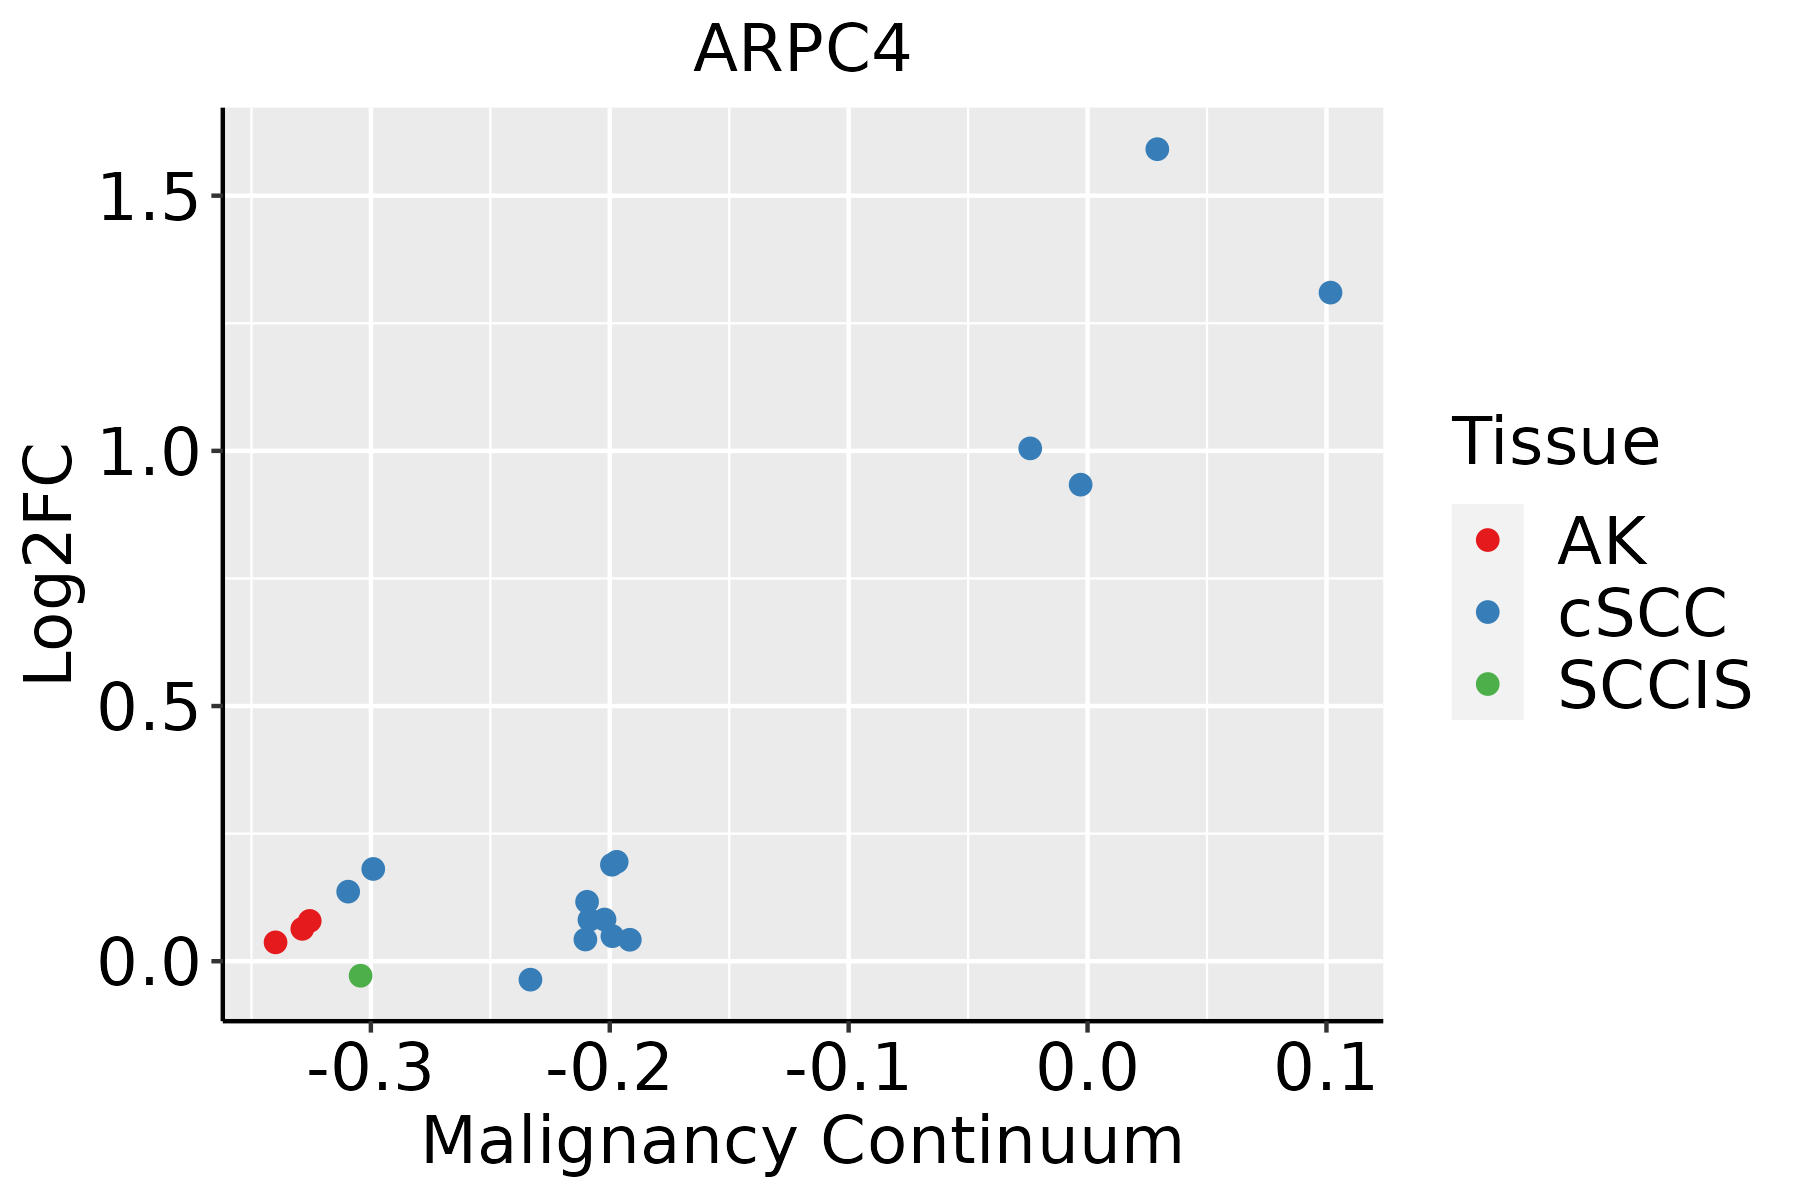 | AK: Actinic keratosis |
| cSCC: Cutaneous squamous cell carcinoma | ||
| SCCIS:squamous cell carcinoma in situ | ||
| Thyroid | 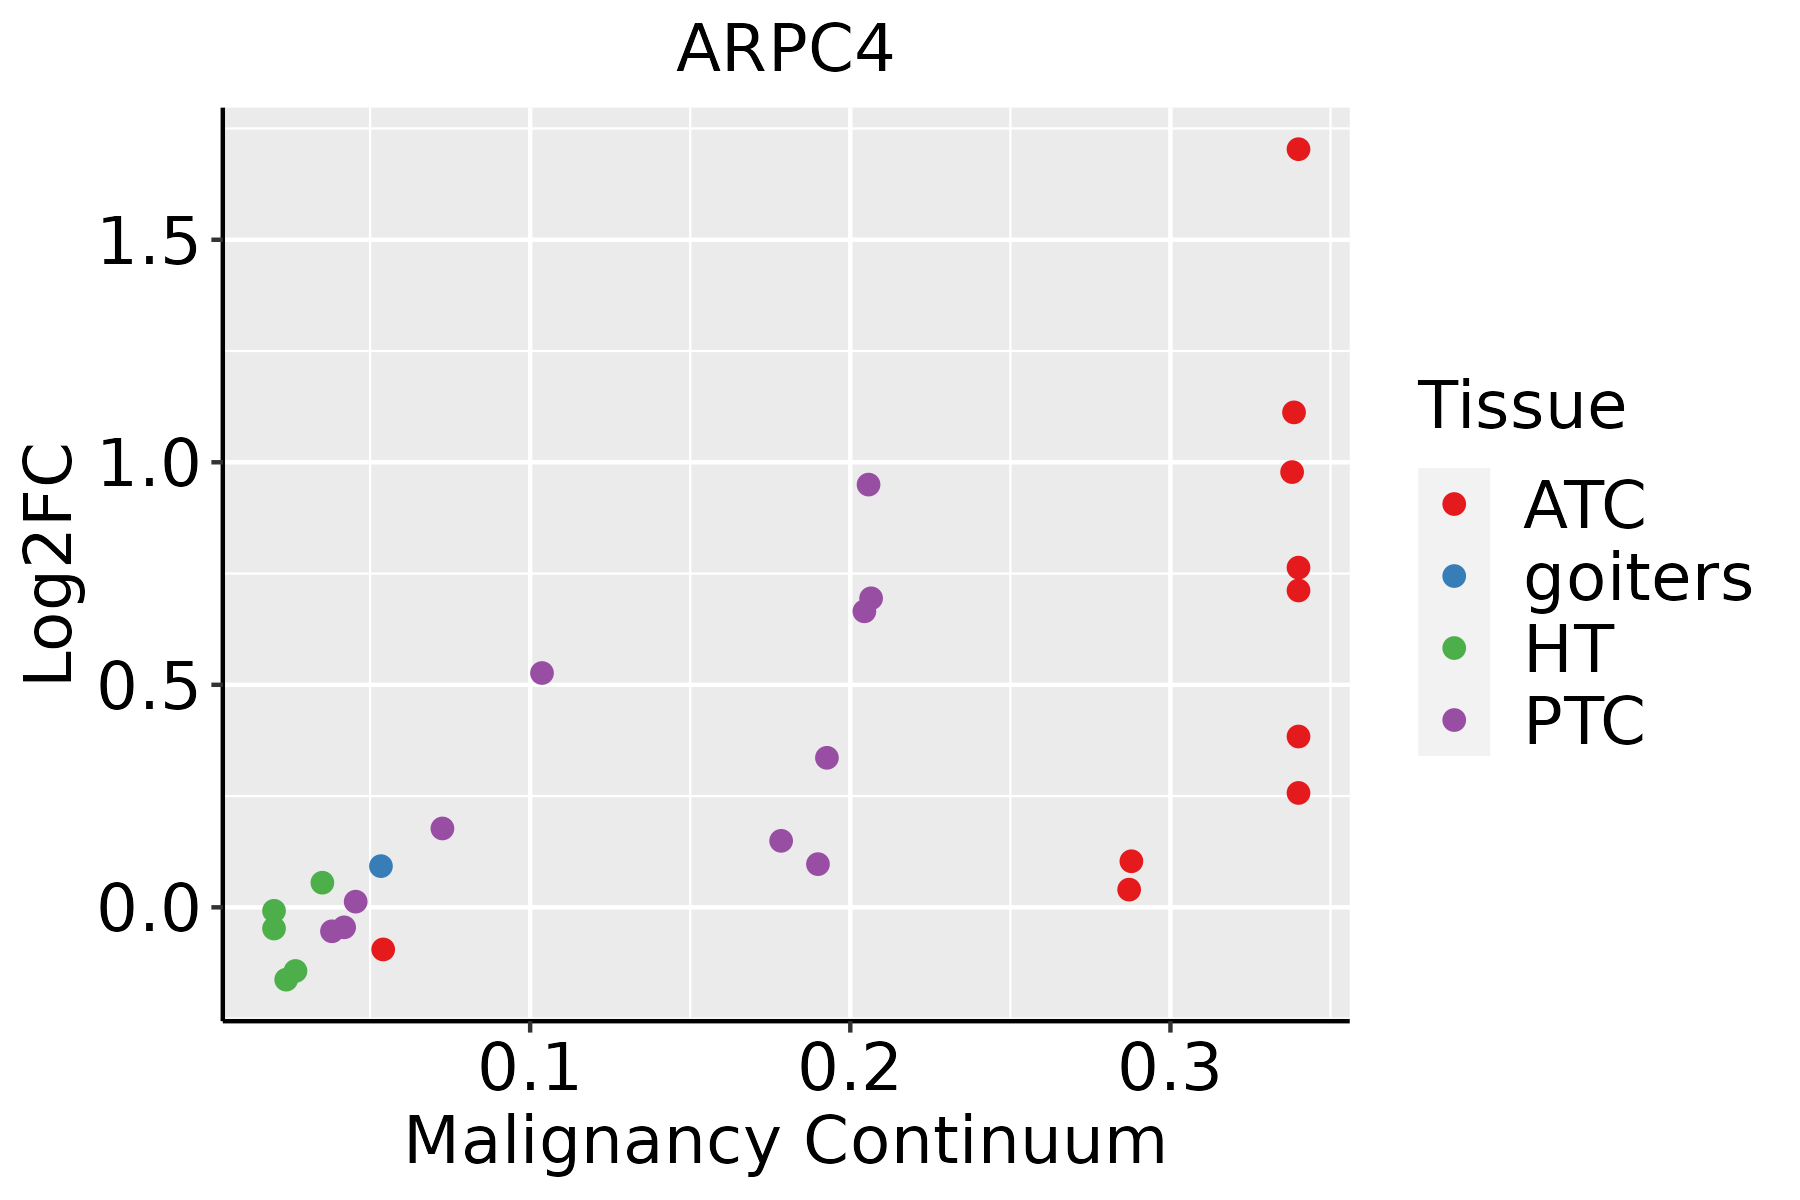 | ATC: Anaplastic thyroid cancer |
| HT: Hashimoto's thyroiditis | ||
| PTC: Papillary thyroid cancer |
| ∗log2FC in expression of this searched gene in stem-like cells from each diseased tissue sample relative to stem-like cells in normal samples in each tissue plotted against the malignancy continuum. Samples are colored based on if they are from different disease stage. |
Top |
Malignant transformation related pathway analysis |
| Find out the enriched GO biological processes and KEGG pathways involved in transition from healthy to precancer to cancer |
| Tissue | Disease Stage | Enriched GO biological Processes |
| Colorectum | AD |  |
| Colorectum | SER |  |
| Colorectum | MSS |  |
| Colorectum | MSI-H |  |
| Colorectum | FAP |  |
| ∗Top 15 enriched GO BP terms are showed in the bar plot of each disease state in each tissue. Each row represents a significant GO biological process which is colored according to the -log10(p.adjust). |
| Page: 1 2 3 4 5 6 7 8 9 |
| GO ID | Tissue | Disease Stage | Description | Gene Ratio | Bg Ratio | pvalue | p.adjust | Count |
| GO:0007015 | Colorectum | AD | actin filament organization | 167/3918 | 442/18723 | 1.65e-16 | 7.94e-14 | 167 |
| GO:0032535 | Colorectum | AD | regulation of cellular component size | 142/3918 | 383/18723 | 1.74e-13 | 3.41e-11 | 142 |
| GO:1902903 | Colorectum | AD | regulation of supramolecular fiber organization | 139/3918 | 383/18723 | 2.01e-12 | 3.19e-10 | 139 |
| GO:0032970 | Colorectum | AD | regulation of actin filament-based process | 142/3918 | 397/18723 | 4.05e-12 | 5.90e-10 | 142 |
| GO:0110053 | Colorectum | AD | regulation of actin filament organization | 108/3918 | 278/18723 | 5.02e-12 | 6.98e-10 | 108 |
| GO:0008154 | Colorectum | AD | actin polymerization or depolymerization | 90/3918 | 218/18723 | 6.14e-12 | 8.23e-10 | 90 |
| GO:0032271 | Colorectum | AD | regulation of protein polymerization | 94/3918 | 233/18723 | 1.01e-11 | 1.29e-09 | 94 |
| GO:0030041 | Colorectum | AD | actin filament polymerization | 81/3918 | 191/18723 | 1.35e-11 | 1.69e-09 | 81 |
| GO:0051258 | Colorectum | AD | protein polymerization | 112/3918 | 297/18723 | 1.85e-11 | 2.27e-09 | 112 |
| GO:0043254 | Colorectum | AD | regulation of protein-containing complex assembly | 148/3918 | 428/18723 | 2.64e-11 | 3.18e-09 | 148 |
| GO:0008064 | Colorectum | AD | regulation of actin polymerization or depolymerization | 79/3918 | 188/18723 | 4.17e-11 | 4.74e-09 | 79 |
| GO:0030833 | Colorectum | AD | regulation of actin filament polymerization | 74/3918 | 172/18723 | 4.50e-11 | 5.03e-09 | 74 |
| GO:0030832 | Colorectum | AD | regulation of actin filament length | 79/3918 | 189/18723 | 5.71e-11 | 6.27e-09 | 79 |
| GO:1902905 | Colorectum | AD | positive regulation of supramolecular fiber organization | 85/3918 | 209/18723 | 5.95e-11 | 6.33e-09 | 85 |
| GO:0032956 | Colorectum | AD | regulation of actin cytoskeleton organization | 127/3918 | 358/18723 | 1.03e-10 | 1.04e-08 | 127 |
| GO:0051495 | Colorectum | AD | positive regulation of cytoskeleton organization | 89/3918 | 226/18723 | 1.61e-10 | 1.56e-08 | 89 |
| GO:0032273 | Colorectum | AD | positive regulation of protein polymerization | 62/3918 | 138/18723 | 1.94e-10 | 1.76e-08 | 62 |
| GO:0031334 | Colorectum | AD | positive regulation of protein-containing complex assembly | 91/3918 | 237/18723 | 4.78e-10 | 3.99e-08 | 91 |
| GO:0030838 | Colorectum | AD | positive regulation of actin filament polymerization | 48/3918 | 99/18723 | 9.21e-10 | 7.03e-08 | 48 |
| GO:0045010 | Colorectum | AD | actin nucleation | 26/3918 | 52/18723 | 3.10e-06 | 8.77e-05 | 26 |
| Page: 1 2 3 4 5 6 7 8 9 10 11 12 13 14 15 |
| Pathway ID | Tissue | Disease Stage | Description | Gene Ratio | Bg Ratio | pvalue | p.adjust | qvalue | Count |
| hsa04144 | Colorectum | AD | Endocytosis | 111/2092 | 251/8465 | 5.95e-12 | 1.42e-10 | 9.08e-11 | 111 |
| hsa05131 | Colorectum | AD | Shigellosis | 109/2092 | 247/8465 | 1.09e-11 | 2.44e-10 | 1.55e-10 | 109 |
| hsa05100 | Colorectum | AD | Bacterial invasion of epithelial cells | 44/2092 | 77/8465 | 1.13e-09 | 2.22e-08 | 1.42e-08 | 44 |
| hsa04530 | Colorectum | AD | Tight junction | 76/2092 | 169/8465 | 5.49e-09 | 9.69e-08 | 6.18e-08 | 76 |
| hsa05132 | Colorectum | AD | Salmonella infection | 102/2092 | 249/8465 | 7.65e-09 | 1.28e-07 | 8.17e-08 | 102 |
| hsa04666 | Colorectum | AD | Fc gamma R-mediated phagocytosis | 46/2092 | 97/8465 | 9.10e-07 | 1.22e-05 | 7.77e-06 | 46 |
| hsa05130 | Colorectum | AD | Pathogenic Escherichia coli infection | 79/2092 | 197/8465 | 1.05e-06 | 1.36e-05 | 8.65e-06 | 79 |
| hsa05135 | Colorectum | AD | Yersinia infection | 58/2092 | 137/8465 | 3.90e-06 | 4.35e-05 | 2.78e-05 | 58 |
| hsa04810 | Colorectum | AD | Regulation of actin cytoskeleton | 75/2092 | 229/8465 | 3.36e-03 | 1.76e-02 | 1.12e-02 | 75 |
| hsa041441 | Colorectum | AD | Endocytosis | 111/2092 | 251/8465 | 5.95e-12 | 1.42e-10 | 9.08e-11 | 111 |
| hsa051311 | Colorectum | AD | Shigellosis | 109/2092 | 247/8465 | 1.09e-11 | 2.44e-10 | 1.55e-10 | 109 |
| hsa051001 | Colorectum | AD | Bacterial invasion of epithelial cells | 44/2092 | 77/8465 | 1.13e-09 | 2.22e-08 | 1.42e-08 | 44 |
| hsa045301 | Colorectum | AD | Tight junction | 76/2092 | 169/8465 | 5.49e-09 | 9.69e-08 | 6.18e-08 | 76 |
| hsa051321 | Colorectum | AD | Salmonella infection | 102/2092 | 249/8465 | 7.65e-09 | 1.28e-07 | 8.17e-08 | 102 |
| hsa046661 | Colorectum | AD | Fc gamma R-mediated phagocytosis | 46/2092 | 97/8465 | 9.10e-07 | 1.22e-05 | 7.77e-06 | 46 |
| hsa051301 | Colorectum | AD | Pathogenic Escherichia coli infection | 79/2092 | 197/8465 | 1.05e-06 | 1.36e-05 | 8.65e-06 | 79 |
| hsa051351 | Colorectum | AD | Yersinia infection | 58/2092 | 137/8465 | 3.90e-06 | 4.35e-05 | 2.78e-05 | 58 |
| hsa048101 | Colorectum | AD | Regulation of actin cytoskeleton | 75/2092 | 229/8465 | 3.36e-03 | 1.76e-02 | 1.12e-02 | 75 |
| hsa051312 | Colorectum | SER | Shigellosis | 87/1580 | 247/8465 | 3.07e-10 | 7.27e-09 | 5.28e-09 | 87 |
| hsa051002 | Colorectum | SER | Bacterial invasion of epithelial cells | 36/1580 | 77/8465 | 1.56e-08 | 3.45e-07 | 2.50e-07 | 36 |
| Page: 1 2 3 4 5 6 7 8 9 10 |
Top |
Cell-cell communication analysis |
| Identification of potential cell-cell interactions between two cell types and their ligand-receptor pairs for different disease states |
| Ligand | Receptor | LRpair | Pathway | Tissue | Disease Stage |
| Page: 1 |
Top |
Single-cell gene regulatory network inference analysis |
| Find out the significant the regulons (TFs) and the target genes of each regulon across cell types for different disease states |
| TF | Cell Type | Tissue | Disease Stage | Target Gene | RSS | Regulon Activity |
| ∗The dot plots of a searched regulon are shown for all cell subpopulations in each disease state of each tissue based on the regulon specific score inferred using pySCENIC and by calculating the average expression. |
| Page: 1 |
Top |
Somatic mutation of malignant transformation related genes |
| Annotation of somatic variants for genes involved in malignant transformation |
| Hugo Symbol | Variant Class | Variant Classification | dbSNP RS | HGVSc | HGVSp | HGVSp Short | SWISSPROT | BIOTYPE | SIFT | PolyPhen | Tumor Sample Barcode | Tissue | Histology | Sex | Age | Stage | Therapy Types | Drugs | Outcome |
| ARPC4 | SNV | Missense_Mutation | novel | c.463N>G | p.Ile155Val | p.I155V | P59998 | protein_coding | tolerated(0.19) | benign(0.049) | TCGA-EO-A22T-01 | Endometrium | uterine corpus endometrioid carcinoma | Female | <65 | I/II | Unknown | Unknown | SD |
| Page: 1 |
Top |
Related drugs of malignant transformation related genes |
| Identification of chemicals and drugs interact with genes involved in malignant transfromation |
| (DGIdb 4.0) |
| Entrez ID | Symbol | Category | Interaction Types | Drug Claim Name | Drug Name | PMIDs |
| Page: 1 |

Copyright 2023-Present -The University of Texas Health Science Center at Houston |