
|
|||||
|
 | |
| |
| |
| |
| |
| |
|
Gene: ARNTL2 |
Gene summary for ARNTL2 |
| Gene information | Species | Human | Gene symbol | ARNTL2 | Gene ID | 56938 |
| Gene name | aryl hydrocarbon receptor nuclear translocator like 2 | |
| Gene Alias | BMAL2 | |
| Cytomap | 12p11.23 | |
| Gene Type | protein-coding | GO ID | GO:0006139 | UniProtAcc | Q8WYA1 |
Top |
Malignant transformation analysis |
| Identification of the aberrant gene expression in precancerous and cancerous lesions by comparing the gene expression of stem-like cells in diseased tissues with normal stem cells |
| Entrez ID | Symbol | Replicates | Species | Organ | Tissue | Adj P-value | Log2FC | Malignancy |
| 56938 | ARNTL2 | CCI_1 | Human | Cervix | CC | 2.31e-12 | 1.00e+00 | 0.528 |
| 56938 | ARNTL2 | CCI_2 | Human | Cervix | CC | 1.18e-12 | 1.24e+00 | 0.5249 |
| 56938 | ARNTL2 | CCI_3 | Human | Cervix | CC | 1.21e-19 | 1.28e+00 | 0.516 |
| 56938 | ARNTL2 | Tumor | Human | Cervix | CC | 9.88e-07 | 2.71e-01 | 0.1241 |
| 56938 | ARNTL2 | sample3 | Human | Cervix | CC | 1.54e-23 | 4.43e-01 | 0.1387 |
| 56938 | ARNTL2 | H2 | Human | Cervix | HSIL_HPV | 7.62e-03 | 2.09e-01 | 0.0632 |
| 56938 | ARNTL2 | T3 | Human | Cervix | CC | 1.98e-24 | 4.24e-01 | 0.1389 |
| 56938 | ARNTL2 | LZE20T | Human | Esophagus | ESCC | 7.08e-07 | 1.90e-01 | 0.0662 |
| 56938 | ARNTL2 | LZE22T | Human | Esophagus | ESCC | 2.18e-02 | 2.79e-01 | 0.068 |
| 56938 | ARNTL2 | LZE24T | Human | Esophagus | ESCC | 6.05e-05 | 1.70e-01 | 0.0596 |
| 56938 | ARNTL2 | LZE21T | Human | Esophagus | ESCC | 3.99e-04 | 3.37e-01 | 0.0655 |
| 56938 | ARNTL2 | P1T-E | Human | Esophagus | ESCC | 1.94e-07 | 4.51e-01 | 0.0875 |
| 56938 | ARNTL2 | P2T-E | Human | Esophagus | ESCC | 1.08e-10 | 1.98e-01 | 0.1177 |
| 56938 | ARNTL2 | P4T-E | Human | Esophagus | ESCC | 2.66e-08 | 2.57e-01 | 0.1323 |
| 56938 | ARNTL2 | P5T-E | Human | Esophagus | ESCC | 2.46e-30 | 5.76e-01 | 0.1327 |
| 56938 | ARNTL2 | P8T-E | Human | Esophagus | ESCC | 5.22e-12 | 2.20e-01 | 0.0889 |
| 56938 | ARNTL2 | P9T-E | Human | Esophagus | ESCC | 5.83e-10 | 2.62e-01 | 0.1131 |
| 56938 | ARNTL2 | P12T-E | Human | Esophagus | ESCC | 5.41e-22 | 4.78e-01 | 0.1122 |
| 56938 | ARNTL2 | P15T-E | Human | Esophagus | ESCC | 7.92e-07 | 2.13e-01 | 0.1149 |
| 56938 | ARNTL2 | P16T-E | Human | Esophagus | ESCC | 1.10e-07 | 1.56e-01 | 0.1153 |
| Page: 1 2 3 4 5 |
| Tissue | Expression Dynamics | Abbreviation |
| Cervix | 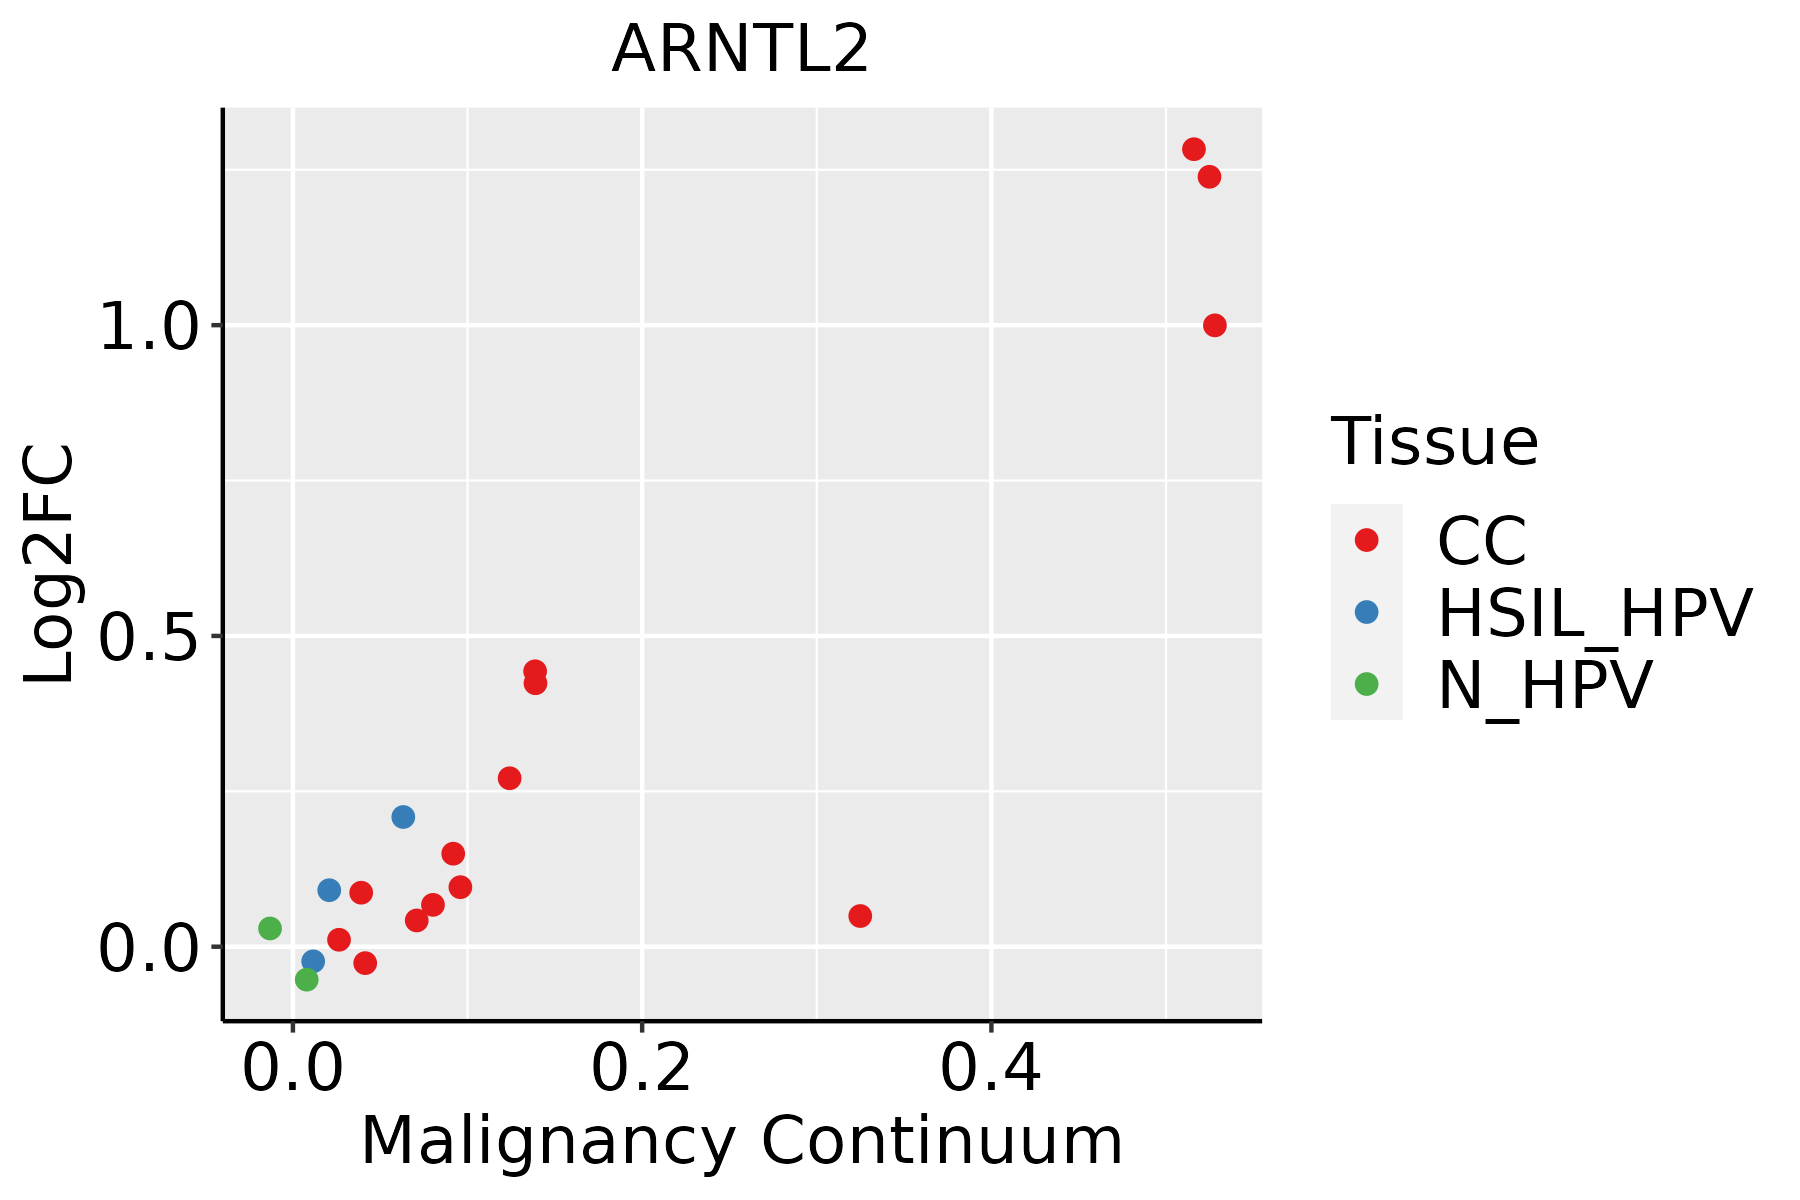 | CC: Cervix cancer |
| HSIL_HPV: HPV-infected high-grade squamous intraepithelial lesions | ||
| N_HPV: HPV-infected normal cervix | ||
| Esophagus | 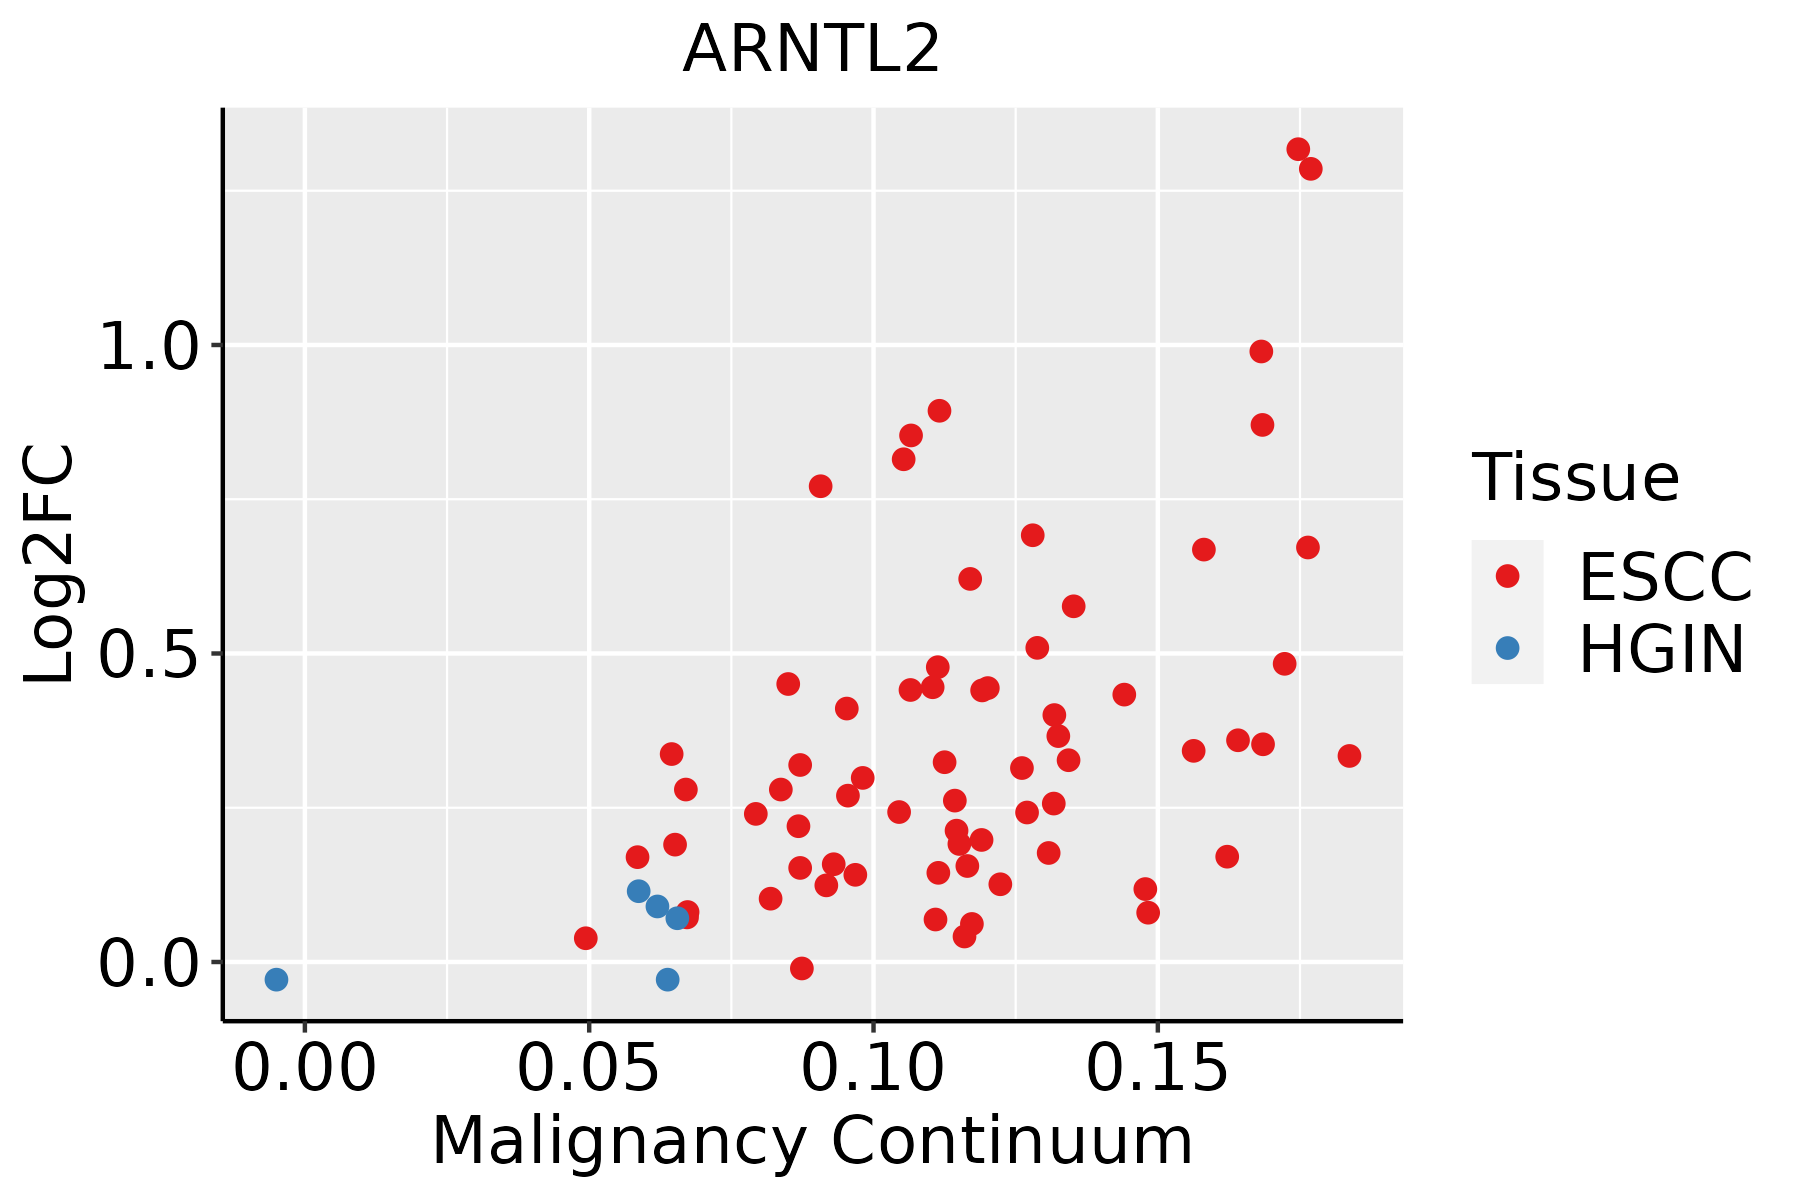 | ESCC: Esophageal squamous cell carcinoma |
| HGIN: High-grade intraepithelial neoplasias | ||
| LGIN: Low-grade intraepithelial neoplasias | ||
| Liver |  | HCC: Hepatocellular carcinoma |
| NAFLD: Non-alcoholic fatty liver disease | ||
| Oral Cavity |  | EOLP: Erosive Oral lichen planus |
| LP: leukoplakia | ||
| NEOLP: Non-erosive oral lichen planus | ||
| OSCC: Oral squamous cell carcinoma |
| ∗log2FC in expression of this searched gene in stem-like cells from each diseased tissue sample relative to stem-like cells in normal samples in each tissue plotted against the malignancy continuum. Samples are colored based on if they are from different disease stage. |
Top |
Malignant transformation related pathway analysis |
| Find out the enriched GO biological processes and KEGG pathways involved in transition from healthy to precancer to cancer |
| Tissue | Disease Stage | Enriched GO biological Processes |
| Colorectum | AD |  |
| Colorectum | SER |  |
| Colorectum | MSS |  |
| Colorectum | MSI-H |  |
| Colorectum | FAP |  |
| ∗Top 15 enriched GO BP terms are showed in the bar plot of each disease state in each tissue. Each row represents a significant GO biological process which is colored according to the -log10(p.adjust). |
| Page: 1 2 3 4 5 6 7 8 9 |
| GO ID | Tissue | Disease Stage | Description | Gene Ratio | Bg Ratio | pvalue | p.adjust | Count |
| GO:00485118 | Cervix | CC | rhythmic process | 65/2311 | 298/18723 | 2.79e-06 | 8.04e-05 | 65 |
| GO:00076238 | Cervix | CC | circadian rhythm | 46/2311 | 210/18723 | 6.76e-05 | 9.60e-04 | 46 |
| GO:004851118 | Esophagus | ESCC | rhythmic process | 164/8552 | 298/18723 | 6.80e-04 | 3.57e-03 | 164 |
| GO:000762319 | Esophagus | ESCC | circadian rhythm | 119/8552 | 210/18723 | 8.47e-04 | 4.36e-03 | 119 |
| GO:00427529 | Esophagus | ESCC | regulation of circadian rhythm | 68/8552 | 121/18723 | 1.27e-02 | 4.21e-02 | 68 |
| GO:000762321 | Liver | HCC | circadian rhythm | 117/7958 | 210/18723 | 7.29e-05 | 6.54e-04 | 117 |
| GO:004851121 | Liver | HCC | rhythmic process | 156/7958 | 298/18723 | 3.54e-04 | 2.46e-03 | 156 |
| GO:004275211 | Liver | HCC | regulation of circadian rhythm | 65/7958 | 121/18723 | 8.25e-03 | 3.24e-02 | 65 |
| GO:004851116 | Oral cavity | OSCC | rhythmic process | 157/7305 | 298/18723 | 1.00e-06 | 1.36e-05 | 157 |
| GO:000762316 | Oral cavity | OSCC | circadian rhythm | 110/7305 | 210/18723 | 5.40e-05 | 4.48e-04 | 110 |
| Page: 1 |
| Pathway ID | Tissue | Disease Stage | Description | Gene Ratio | Bg Ratio | pvalue | p.adjust | qvalue | Count |
| Page: 1 |
Top |
Cell-cell communication analysis |
| Identification of potential cell-cell interactions between two cell types and their ligand-receptor pairs for different disease states |
| Ligand | Receptor | LRpair | Pathway | Tissue | Disease Stage |
| Page: 1 |
Top |
Single-cell gene regulatory network inference analysis |
| Find out the significant the regulons (TFs) and the target genes of each regulon across cell types for different disease states |
| TF | Cell Type | Tissue | Disease Stage | Target Gene | RSS | Regulon Activity |
| ARNTL2 | TH17 | Colorectum | CRC | MAP3K13,LANCL2,MIR646HG, etc. | 6.49e-02 |  |
| ARNTL2 | TH17 | Colorectum | Healthy | MAP3K13,LANCL2,MIR646HG, etc. | 3.18e-02 |  |
| ARNTL2 | DC | Colorectum | MSI-H | MAP3K13,LANCL2,MIR646HG, etc. | 2.88e-02 |  |
| ARNTL2 | CD8TEXINT | Colorectum | MSS | MAP3K13,LANCL2,MIR646HG, etc. | 8.44e-02 |  |
| ARNTL2 | CD8TCM | Colorectum | MSS | MAP3K13,LANCL2,MIR646HG, etc. | 6.51e-02 | |
| ARNTL2 | cDC | Lung | AAH | BIRC3,TBC1D4,CCR7, etc. | 6.29e-02 |  |
| ARNTL2 | cDC | Lung | MIAC | BIRC3,LAMP3,WNT5B, etc. | 5.31e-02 |  |
| ARNTL2 | TH17 | Oral cavity | ADJ | LAMP3,BIRC3,FSCN1, etc. | 2.79e-02 |  |
| ARNTL2 | M1MAC | Oral cavity | EOLP | LAMP3,BIRC3,FSCN1, etc. | 6.43e-02 |  |
| ARNTL2 | CD8TEX | Oral cavity | Healthy | LAMP3,BIRC3,FSCN1, etc. | 7.29e-03 |  |
| ∗The dot plots of a searched regulon are shown for all cell subpopulations in each disease state of each tissue based on the regulon specific score inferred using pySCENIC and by calculating the average expression. |
| Page: 1 2 |
Top |
Somatic mutation of malignant transformation related genes |
| Annotation of somatic variants for genes involved in malignant transformation |
| Hugo Symbol | Variant Class | Variant Classification | dbSNP RS | HGVSc | HGVSp | HGVSp Short | SWISSPROT | BIOTYPE | SIFT | PolyPhen | Tumor Sample Barcode | Tissue | Histology | Sex | Age | Stage | Therapy Types | Drugs | Outcome |
| ARNTL2 | SNV | Missense_Mutation | rs140062821 | c.352N>T | p.Arg118Trp | p.R118W | Q8WYA1 | protein_coding | deleterious(0) | probably_damaging(0.999) | TCGA-A2-A0ES-01 | Breast | breast invasive carcinoma | Female | <65 | I/II | Chemotherapy | docetaxel | SD |
| ARNTL2 | SNV | Missense_Mutation | c.353N>A | p.Arg118Gln | p.R118Q | Q8WYA1 | protein_coding | deleterious(0) | probably_damaging(0.993) | TCGA-C8-A26Z-01 | Breast | breast invasive carcinoma | Female | <65 | I/II | Hormone Therapy | tamoxiphen | CR | |
| ARNTL2 | SNV | Missense_Mutation | novel | c.596N>A | p.Cys199Tyr | p.C199Y | Q8WYA1 | protein_coding | deleterious(0) | probably_damaging(1) | TCGA-2W-A8YY-01 | Cervix | cervical & endocervical cancer | Female | <65 | I/II | Chemotherapy | cisplatin | CR |
| ARNTL2 | SNV | Missense_Mutation | c.1264N>A | p.Ala422Thr | p.A422T | Q8WYA1 | protein_coding | tolerated(0.22) | benign(0.263) | TCGA-AA-3510-01 | Colorectum | colon adenocarcinoma | Male | >=65 | I/II | Unknown | Unknown | SD | |
| ARNTL2 | SNV | Missense_Mutation | rs780181750 | c.149N>A | p.Arg50Gln | p.R50Q | Q8WYA1 | protein_coding | deleterious(0) | benign(0.087) | TCGA-AA-3984-01 | Colorectum | colon adenocarcinoma | Female | <65 | I/II | Unknown | Unknown | SD |
| ARNTL2 | SNV | Missense_Mutation | c.1321N>T | p.Asp441Tyr | p.D441Y | Q8WYA1 | protein_coding | tolerated(0.16) | possibly_damaging(0.736) | TCGA-AA-A010-01 | Colorectum | colon adenocarcinoma | Female | <65 | I/II | Chemotherapy | folinic | CR | |
| ARNTL2 | SNV | Missense_Mutation | c.1036N>A | p.Leu346Ile | p.L346I | Q8WYA1 | protein_coding | deleterious(0) | probably_damaging(0.983) | TCGA-AD-A5EJ-01 | Colorectum | colon adenocarcinoma | Female | >=65 | I/II | Unknown | Unknown | SD | |
| ARNTL2 | SNV | Missense_Mutation | c.1784C>T | p.Ala595Val | p.A595V | Q8WYA1 | protein_coding | tolerated(0.12) | benign(0.003) | TCGA-AZ-6598-01 | Colorectum | colon adenocarcinoma | Female | >=65 | I/II | Unknown | Unknown | SD | |
| ARNTL2 | SNV | Missense_Mutation | c.1484C>T | p.Ser495Phe | p.S495F | Q8WYA1 | protein_coding | tolerated(0.79) | benign(0.001) | TCGA-CM-4746-01 | Colorectum | colon adenocarcinoma | Male | <65 | I/II | Unknown | Unknown | SD | |
| ARNTL2 | SNV | Missense_Mutation | rs756988598 | c.83N>A | p.Arg28His | p.R28H | Q8WYA1 | protein_coding | tolerated(0.67) | benign(0) | TCGA-D5-6928-01 | Colorectum | colon adenocarcinoma | Male | >=65 | I/II | Unknown | Unknown | SD |
| Page: 1 2 3 4 5 6 |
Top |
Related drugs of malignant transformation related genes |
| Identification of chemicals and drugs interact with genes involved in malignant transfromation |
| (DGIdb 4.0) |
| Entrez ID | Symbol | Category | Interaction Types | Drug Claim Name | Drug Name | PMIDs |
| Page: 1 |

Copyright 2023-Present -The University of Texas Health Science Center at Houston |