
|
|||||
|
 | |
| |
| |
| |
| |
| |
|
Gene: ARNTL |
Gene summary for ARNTL |
| Gene information | Species | Human | Gene symbol | ARNTL | Gene ID | 406 |
| Gene name | aryl hydrocarbon receptor nuclear translocator like | |
| Gene Alias | BMAL1 | |
| Cytomap | 11p15.3 | |
| Gene Type | protein-coding | GO ID | GO:0000003 | UniProtAcc | A0A140VKD3 |
Top |
Malignant transformation analysis |
| Identification of the aberrant gene expression in precancerous and cancerous lesions by comparing the gene expression of stem-like cells in diseased tissues with normal stem cells |
| Entrez ID | Symbol | Replicates | Species | Organ | Tissue | Adj P-value | Log2FC | Malignancy |
| 406 | ARNTL | Adj_PTCwithHT_6 | Human | Thyroid | HT | 1.78e-02 | -2.35e-01 | 0.02 |
| 406 | ARNTL | PTCwithHT_8 | Human | Thyroid | HT | 1.21e-04 | -2.52e-01 | 0.0351 |
| 406 | ARNTL | male-WTA | Human | Thyroid | PTC | 1.63e-35 | 2.66e-01 | 0.1037 |
| 406 | ARNTL | PTC01 | Human | Thyroid | PTC | 9.90e-07 | 2.22e-01 | 0.1899 |
| 406 | ARNTL | PTC04 | Human | Thyroid | PTC | 2.52e-07 | 3.98e-01 | 0.1927 |
| 406 | ARNTL | PTC05 | Human | Thyroid | PTC | 3.79e-24 | 1.29e+00 | 0.2065 |
| 406 | ARNTL | PTC06 | Human | Thyroid | PTC | 2.37e-47 | 1.55e+00 | 0.2057 |
| 406 | ARNTL | PTC07 | Human | Thyroid | PTC | 3.61e-20 | 5.27e-01 | 0.2044 |
| 406 | ARNTL | ATC09 | Human | Thyroid | ATC | 1.79e-02 | -1.18e-01 | 0.2871 |
| 406 | ARNTL | ATC12 | Human | Thyroid | ATC | 1.91e-11 | -1.11e-01 | 0.34 |
| 406 | ARNTL | ATC13 | Human | Thyroid | ATC | 1.36e-06 | -2.21e-01 | 0.34 |
| 406 | ARNTL | ATC2 | Human | Thyroid | ATC | 4.20e-07 | 2.40e-01 | 0.34 |
| 406 | ARNTL | ATC4 | Human | Thyroid | ATC | 1.06e-04 | -4.36e-02 | 0.34 |
| 406 | ARNTL | ATC5 | Human | Thyroid | ATC | 8.73e-09 | -2.16e-01 | 0.34 |
| Page: 1 |
| Tissue | Expression Dynamics | Abbreviation |
| Thyroid | 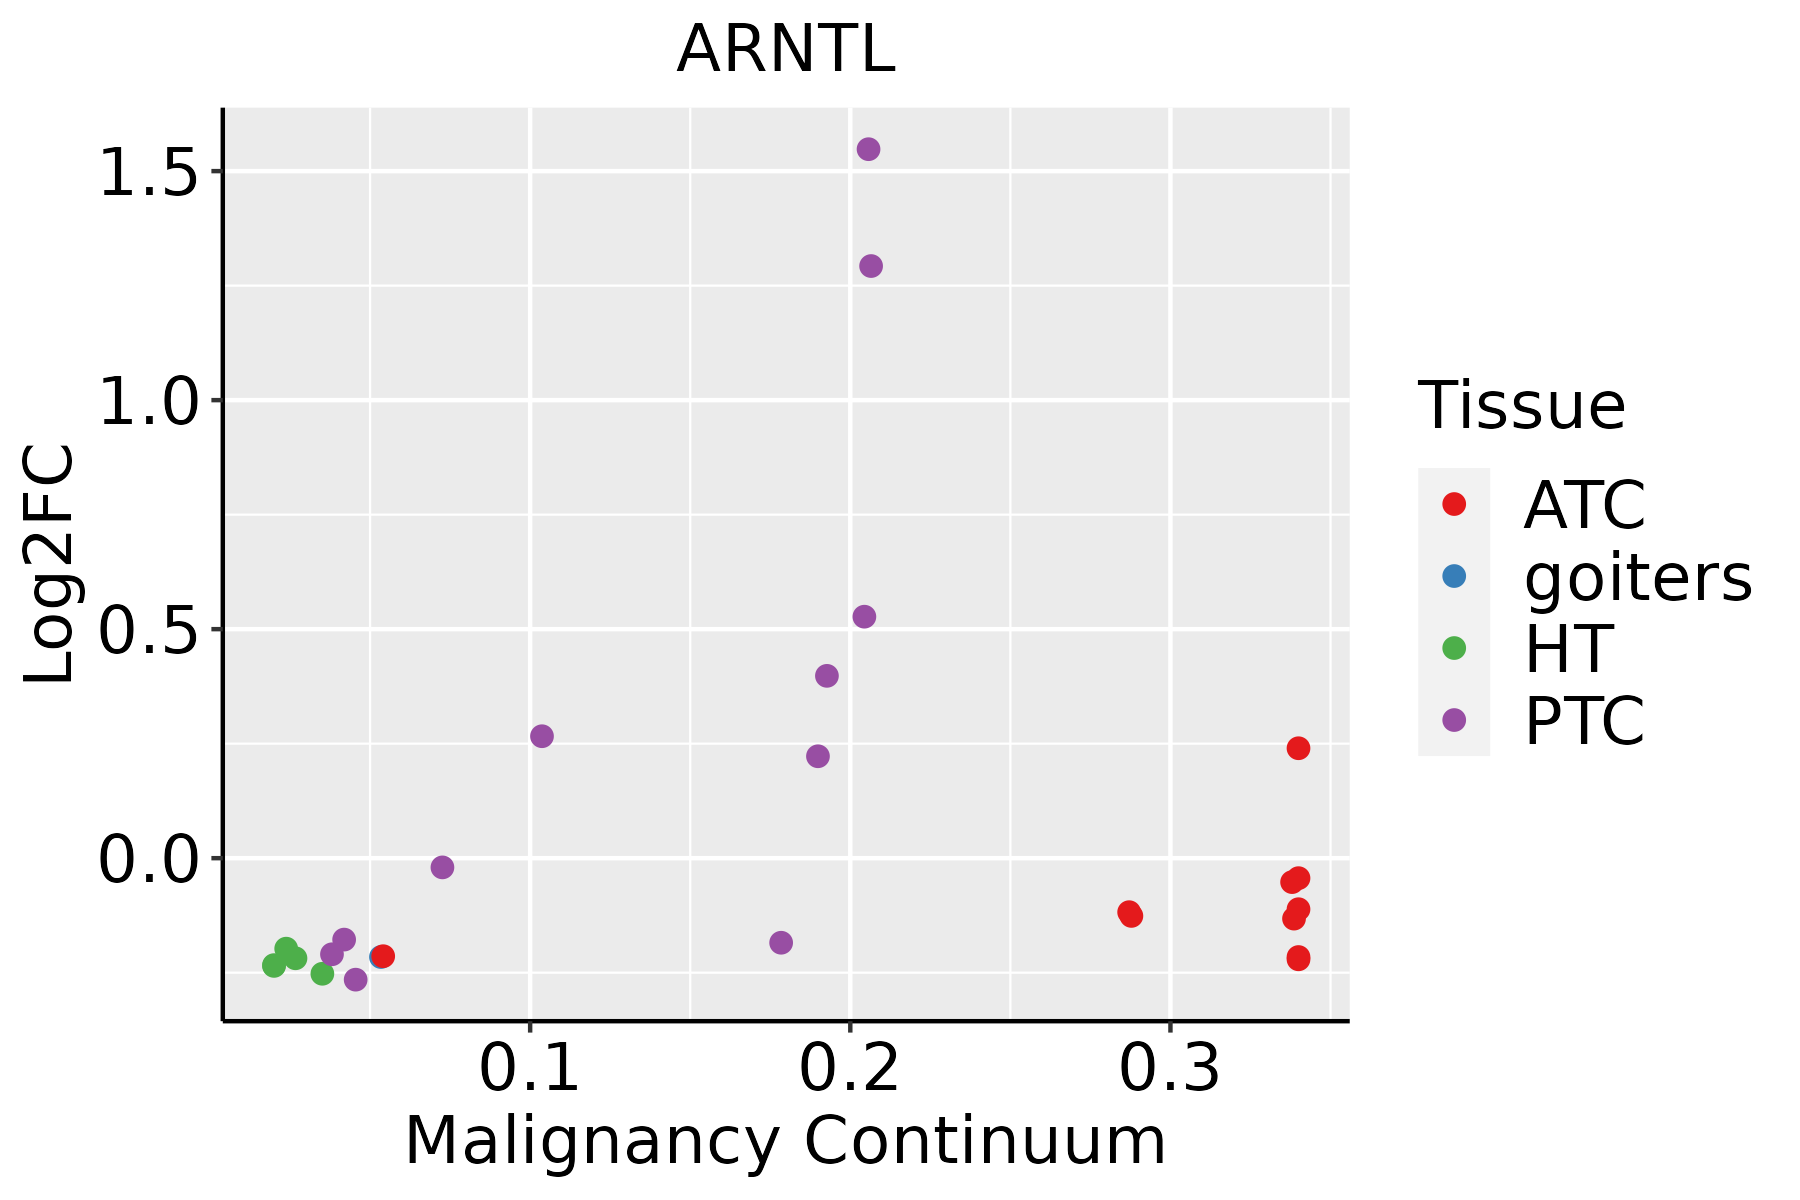 | ATC: Anaplastic thyroid cancer |
| HT: Hashimoto's thyroiditis | ||
| PTC: Papillary thyroid cancer |
| ∗log2FC in expression of this searched gene in stem-like cells from each diseased tissue sample relative to stem-like cells in normal samples in each tissue plotted against the malignancy continuum. Samples are colored based on if they are from different disease stage. |
Top |
Malignant transformation related pathway analysis |
| Find out the enriched GO biological processes and KEGG pathways involved in transition from healthy to precancer to cancer |
| Tissue | Disease Stage | Enriched GO biological Processes |
| Colorectum | AD |  |
| Colorectum | SER |  |
| Colorectum | MSS |  |
| Colorectum | MSI-H |  |
| Colorectum | FAP |  |
| ∗Top 15 enriched GO BP terms are showed in the bar plot of each disease state in each tissue. Each row represents a significant GO biological process which is colored according to the -log10(p.adjust). |
| Page: 1 2 3 4 5 6 7 8 9 |
| GO ID | Tissue | Disease Stage | Description | Gene Ratio | Bg Ratio | pvalue | p.adjust | Count |
| GO:00485118 | Cervix | CC | rhythmic process | 65/2311 | 298/18723 | 2.79e-06 | 8.04e-05 | 65 |
| GO:00076238 | Cervix | CC | circadian rhythm | 46/2311 | 210/18723 | 6.76e-05 | 9.60e-04 | 46 |
| GO:004851118 | Esophagus | ESCC | rhythmic process | 164/8552 | 298/18723 | 6.80e-04 | 3.57e-03 | 164 |
| GO:000762319 | Esophagus | ESCC | circadian rhythm | 119/8552 | 210/18723 | 8.47e-04 | 4.36e-03 | 119 |
| GO:00427529 | Esophagus | ESCC | regulation of circadian rhythm | 68/8552 | 121/18723 | 1.27e-02 | 4.21e-02 | 68 |
| GO:000762321 | Liver | HCC | circadian rhythm | 117/7958 | 210/18723 | 7.29e-05 | 6.54e-04 | 117 |
| GO:004851121 | Liver | HCC | rhythmic process | 156/7958 | 298/18723 | 3.54e-04 | 2.46e-03 | 156 |
| GO:004275211 | Liver | HCC | regulation of circadian rhythm | 65/7958 | 121/18723 | 8.25e-03 | 3.24e-02 | 65 |
| GO:004851116 | Oral cavity | OSCC | rhythmic process | 157/7305 | 298/18723 | 1.00e-06 | 1.36e-05 | 157 |
| GO:000762316 | Oral cavity | OSCC | circadian rhythm | 110/7305 | 210/18723 | 5.40e-05 | 4.48e-04 | 110 |
| GO:000697930 | Thyroid | HT | response to oxidative stress | 81/1272 | 446/18723 | 2.53e-16 | 1.17e-13 | 81 |
| GO:006053718 | Thyroid | HT | muscle tissue development | 62/1272 | 403/18723 | 1.10e-09 | 1.20e-07 | 62 |
| GO:006219730 | Thyroid | HT | cellular response to chemical stress | 54/1272 | 337/18723 | 3.07e-09 | 2.89e-07 | 54 |
| GO:004854530 | Thyroid | HT | response to steroid hormone | 54/1272 | 339/18723 | 3.80e-09 | 3.52e-07 | 54 |
| GO:003459929 | Thyroid | HT | cellular response to oxidative stress | 46/1272 | 288/18723 | 4.97e-08 | 3.15e-06 | 46 |
| GO:001470610 | Thyroid | HT | striated muscle tissue development | 55/1272 | 384/18723 | 1.16e-07 | 6.59e-06 | 55 |
| GO:007138327 | Thyroid | HT | cellular response to steroid hormone stimulus | 34/1272 | 204/18723 | 1.00e-06 | 3.99e-05 | 34 |
| GO:000206427 | Thyroid | HT | epithelial cell development | 35/1272 | 220/18723 | 2.12e-06 | 7.61e-05 | 35 |
| GO:000762324 | Thyroid | HT | circadian rhythm | 33/1272 | 210/18723 | 5.38e-06 | 1.66e-04 | 33 |
| GO:000756828 | Thyroid | HT | aging | 46/1272 | 339/18723 | 5.52e-06 | 1.68e-04 | 46 |
| Page: 1 2 3 4 5 6 7 8 |
| Pathway ID | Tissue | Disease Stage | Description | Gene Ratio | Bg Ratio | pvalue | p.adjust | qvalue | Count |
| Page: 1 |
Top |
Cell-cell communication analysis |
| Identification of potential cell-cell interactions between two cell types and their ligand-receptor pairs for different disease states |
| Ligand | Receptor | LRpair | Pathway | Tissue | Disease Stage |
| Page: 1 |
Top |
Single-cell gene regulatory network inference analysis |
| Find out the significant the regulons (TFs) and the target genes of each regulon across cell types for different disease states |
| TF | Cell Type | Tissue | Disease Stage | Target Gene | RSS | Regulon Activity |
| ARNTL | MYOEPI | Breast | IDC | LMOD1,FAM184B,DDIT3, etc. | 1.08e-01 |  |
| ARNTL | LYMEND | Colorectum | ADJ | NPHP4,FRMD5,MYRIP, etc. | 1.41e-01 |  |
| ARNTL | FIB | Endometrium | AEH | CRADD,RTKN2,GPSM3, etc. | 6.71e-02 |  |
| ARNTL | FIB | Endometrium | EEC | CRADD,RTKN2,GPSM3, etc. | 8.74e-02 |  |
| ARNTL | TFH | Liver | Cirrhotic | SMG1,TPM2,KRAS, etc. | 3.29e-01 |  |
| ARNTL | TFH | Liver | HCC | SMG1,TPM2,KRAS, etc. | 1.96e-01 |  |
| ARNTL | TFH | Liver | Healthy | SMG1,TPM2,KRAS, etc. | 3.30e-01 |  |
| ARNTL | CAF | Liver | Cirrhotic | SKAP1,IL2RB,AOAH, etc. | 3.09e-02 | |
| ARNTL | TH17 | Oral cavity | ADJ | RORA,HIST1H2BE,HEATR1, etc. | 3.31e-02 |  |
| ARNTL | TREG | Oral cavity | ADJ | RORA,HIST1H2BE,HEATR1, etc. | 2.21e-02 | |
| ∗The dot plots of a searched regulon are shown for all cell subpopulations in each disease state of each tissue based on the regulon specific score inferred using pySCENIC and by calculating the average expression. |
| Page: 1 2 3 |
Top |
Somatic mutation of malignant transformation related genes |
| Annotation of somatic variants for genes involved in malignant transformation |
| Hugo Symbol | Variant Class | Variant Classification | dbSNP RS | HGVSc | HGVSp | HGVSp Short | SWISSPROT | BIOTYPE | SIFT | PolyPhen | Tumor Sample Barcode | Tissue | Histology | Sex | Age | Stage | Therapy Types | Drugs | Outcome |
| ARNTL | SNV | Missense_Mutation | novel | c.971N>C | p.Val324Ala | p.V324A | O00327 | protein_coding | tolerated(0.39) | benign(0) | TCGA-AN-A046-01 | Breast | breast invasive carcinoma | Female | >=65 | I/II | Unknown | Unknown | SD |
| ARNTL | SNV | Missense_Mutation | c.1651N>T | p.Ser551Cys | p.S551C | O00327 | protein_coding | deleterious(0.02) | benign(0.172) | TCGA-D8-A145-01 | Breast | breast invasive carcinoma | Female | >=65 | I/II | Hormone Therapy | tamoxiphen | SD | |
| ARNTL | SNV | Missense_Mutation | rs760404876 | c.418N>T | p.Thr140Ser | p.T140S | O00327 | protein_coding | tolerated(1) | benign(0) | TCGA-D8-A1JG-01 | Breast | breast invasive carcinoma | Female | <65 | I/II | Chemotherapy | doxorubicin | SD |
| ARNTL | insertion | Nonsense_Mutation | novel | c.607_608insCTTACTAGAGGCTTGGCATTGTTCTAGGAACATCC | p.Lys203ThrfsTer3 | p.K203Tfs*3 | O00327 | protein_coding | TCGA-AN-A0AR-01 | Breast | breast invasive carcinoma | Female | <65 | I/II | Unknown | Unknown | SD | ||
| ARNTL | SNV | Missense_Mutation | c.737N>G | p.Ser246Cys | p.S246C | O00327 | protein_coding | deleterious(0) | probably_damaging(0.988) | TCGA-EK-A2PG-01 | Cervix | cervical & endocervical cancer | Female | >=65 | I/II | Unknown | Unknown | SD | |
| ARNTL | SNV | Missense_Mutation | c.1372N>T | p.Ala458Ser | p.A458S | O00327 | protein_coding | tolerated(1) | benign(0) | TCGA-A6-A565-01 | Colorectum | colon adenocarcinoma | Female | <65 | III/IV | Unspecific | 5FU | PD | |
| ARNTL | SNV | Missense_Mutation | c.1391A>T | p.Asp464Val | p.D464V | O00327 | protein_coding | tolerated(0.37) | benign(0.017) | TCGA-AA-3710-01 | Colorectum | colon adenocarcinoma | Female | >=65 | I/II | Unknown | Unknown | SD | |
| ARNTL | SNV | Missense_Mutation | rs370345058 | c.1184C>T | p.Thr395Met | p.T395M | O00327 | protein_coding | tolerated(0.13) | benign(0.006) | TCGA-AA-3864-01 | Colorectum | colon adenocarcinoma | Male | >=65 | I/II | Unknown | Unknown | SD |
| ARNTL | SNV | Missense_Mutation | c.250N>T | p.Arg84Cys | p.R84C | O00327 | protein_coding | deleterious(0) | probably_damaging(0.998) | TCGA-AA-3867-01 | Colorectum | colon adenocarcinoma | Male | >=65 | III/IV | Unknown | Unknown | PD | |
| ARNTL | SNV | Missense_Mutation | novel | c.264N>T | p.Met88Ile | p.M88I | O00327 | protein_coding | deleterious(0.01) | probably_damaging(0.968) | TCGA-AA-3984-01 | Colorectum | colon adenocarcinoma | Female | <65 | I/II | Unknown | Unknown | SD |
| Page: 1 2 3 4 5 6 7 |
Top |
Related drugs of malignant transformation related genes |
| Identification of chemicals and drugs interact with genes involved in malignant transfromation |
| (DGIdb 4.0) |
| Entrez ID | Symbol | Category | Interaction Types | Drug Claim Name | Drug Name | PMIDs |
| Page: 1 |

Copyright 2023-Present -The University of Texas Health Science Center at Houston |