
|
|||||
|
 | |
| |
| |
| |
| |
| |
|
Gene: ARMCX6 |
Gene summary for ARMCX6 |
| Gene information | Species | Human | Gene symbol | ARMCX6 | Gene ID | 54470 |
| Gene name | armadillo repeat containing X-linked 6 | |
| Gene Alias | GASP10 | |
| Cytomap | Xq22.1 | |
| Gene Type | protein-coding | GO ID | GO:0005575 | UniProtAcc | Q7L4S7 |
Top |
Malignant transformation analysis |
| Identification of the aberrant gene expression in precancerous and cancerous lesions by comparing the gene expression of stem-like cells in diseased tissues with normal stem cells |
| Entrez ID | Symbol | Replicates | Species | Organ | Tissue | Adj P-value | Log2FC | Malignancy |
| 54470 | ARMCX6 | LZE2T | Human | Esophagus | ESCC | 1.47e-05 | 5.58e-01 | 0.082 |
| 54470 | ARMCX6 | LZE4T | Human | Esophagus | ESCC | 9.34e-19 | 5.42e-01 | 0.0811 |
| 54470 | ARMCX6 | LZE5T | Human | Esophagus | ESCC | 8.38e-04 | 3.58e-01 | 0.0514 |
| 54470 | ARMCX6 | LZE7T | Human | Esophagus | ESCC | 1.95e-16 | 7.57e-01 | 0.0667 |
| 54470 | ARMCX6 | LZE8T | Human | Esophagus | ESCC | 5.39e-04 | 2.18e-01 | 0.067 |
| 54470 | ARMCX6 | LZE22D1 | Human | Esophagus | HGIN | 4.01e-03 | 2.33e-01 | 0.0595 |
| 54470 | ARMCX6 | LZE22T | Human | Esophagus | ESCC | 2.01e-06 | 3.58e-01 | 0.068 |
| 54470 | ARMCX6 | LZE24T | Human | Esophagus | ESCC | 5.97e-26 | 6.99e-01 | 0.0596 |
| 54470 | ARMCX6 | LZE21T | Human | Esophagus | ESCC | 1.06e-03 | 3.61e-01 | 0.0655 |
| 54470 | ARMCX6 | LZE6T | Human | Esophagus | ESCC | 8.53e-12 | 4.99e-01 | 0.0845 |
| 54470 | ARMCX6 | P1T-E | Human | Esophagus | ESCC | 8.36e-12 | 5.06e-01 | 0.0875 |
| 54470 | ARMCX6 | P2T-E | Human | Esophagus | ESCC | 5.09e-48 | 7.20e-01 | 0.1177 |
| 54470 | ARMCX6 | P4T-E | Human | Esophagus | ESCC | 3.12e-44 | 8.70e-01 | 0.1323 |
| 54470 | ARMCX6 | P5T-E | Human | Esophagus | ESCC | 1.85e-31 | 5.33e-01 | 0.1327 |
| 54470 | ARMCX6 | P8T-E | Human | Esophagus | ESCC | 1.31e-62 | 9.87e-01 | 0.0889 |
| 54470 | ARMCX6 | P9T-E | Human | Esophagus | ESCC | 6.47e-27 | 6.22e-01 | 0.1131 |
| 54470 | ARMCX6 | P10T-E | Human | Esophagus | ESCC | 6.36e-47 | 7.57e-01 | 0.116 |
| 54470 | ARMCX6 | P11T-E | Human | Esophagus | ESCC | 8.48e-20 | 6.91e-01 | 0.1426 |
| 54470 | ARMCX6 | P12T-E | Human | Esophagus | ESCC | 1.25e-25 | 4.58e-01 | 0.1122 |
| 54470 | ARMCX6 | P15T-E | Human | Esophagus | ESCC | 3.78e-26 | 5.91e-01 | 0.1149 |
| Page: 1 2 3 4 5 |
| Tissue | Expression Dynamics | Abbreviation |
| Esophagus | 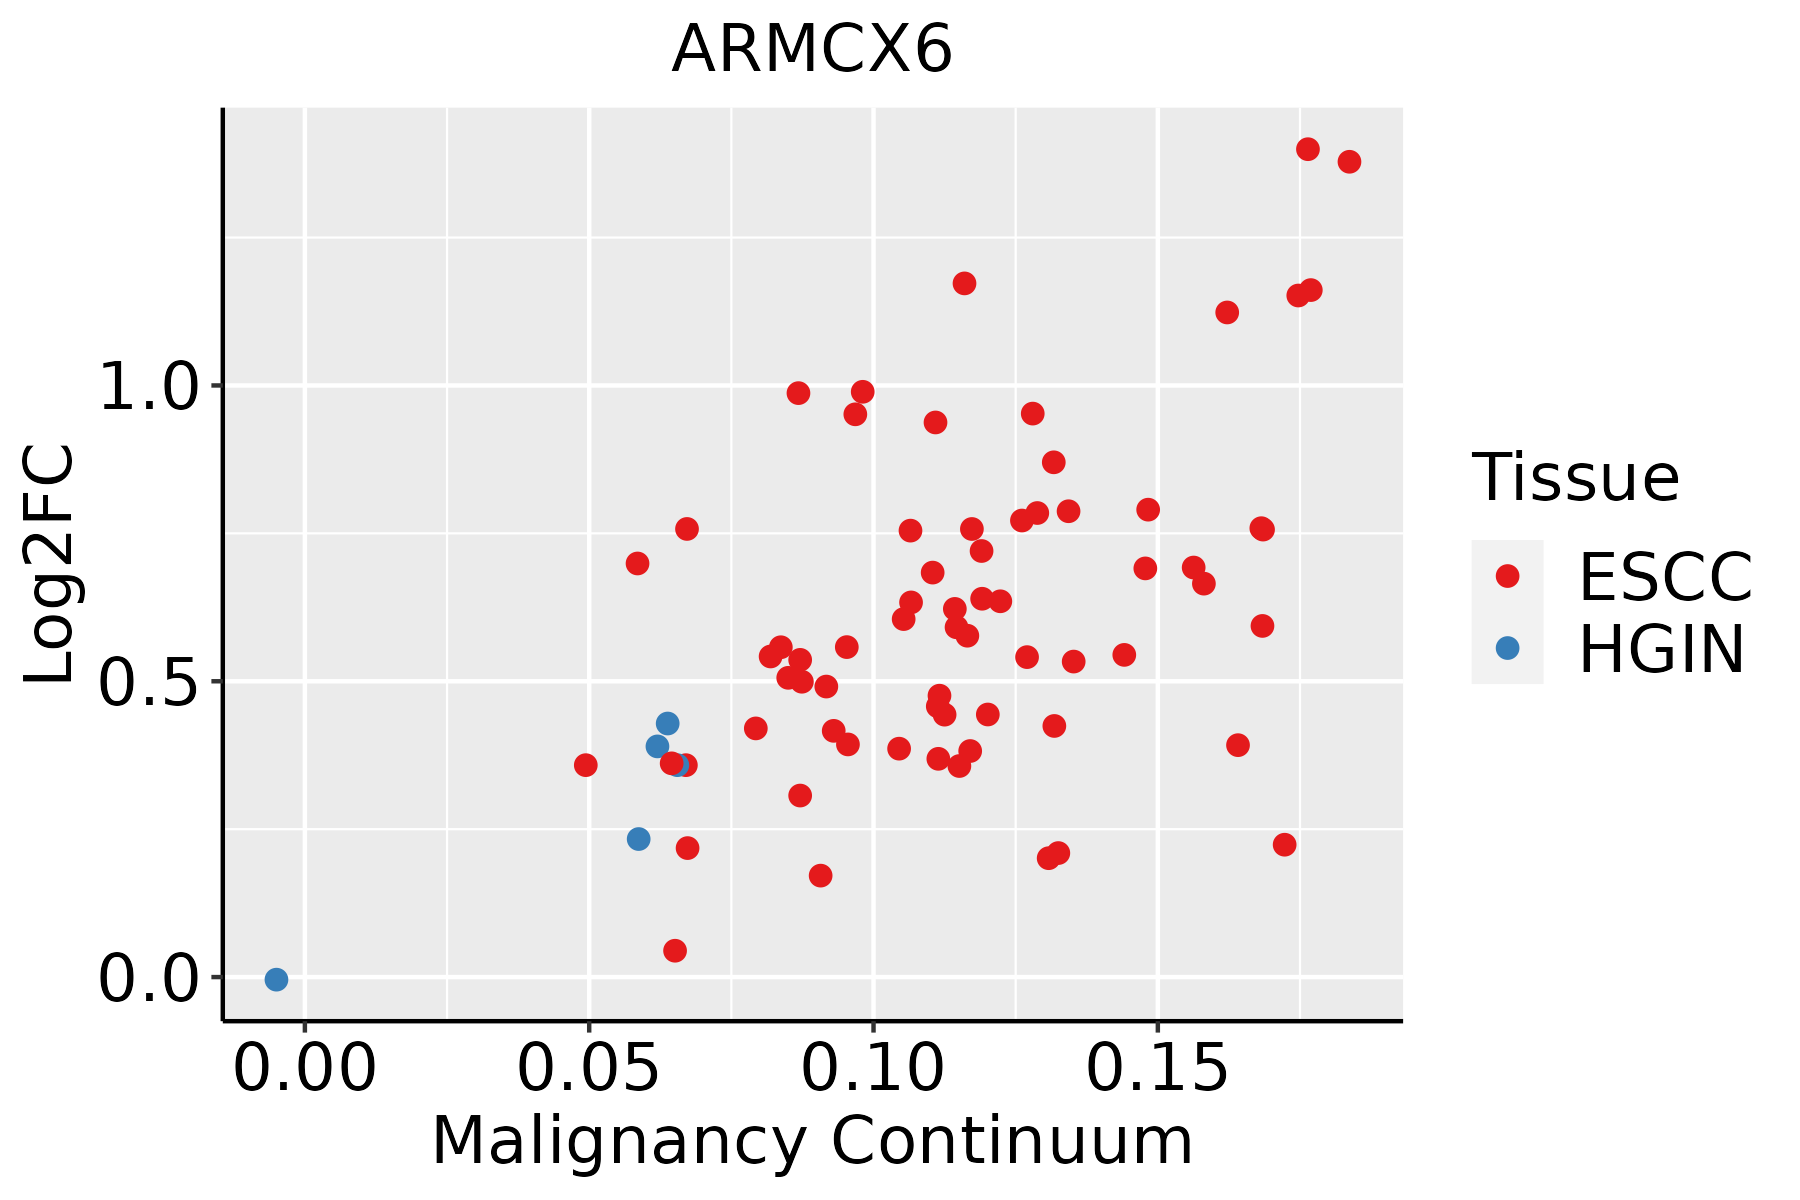 | ESCC: Esophageal squamous cell carcinoma |
| HGIN: High-grade intraepithelial neoplasias | ||
| LGIN: Low-grade intraepithelial neoplasias | ||
| Oral Cavity | 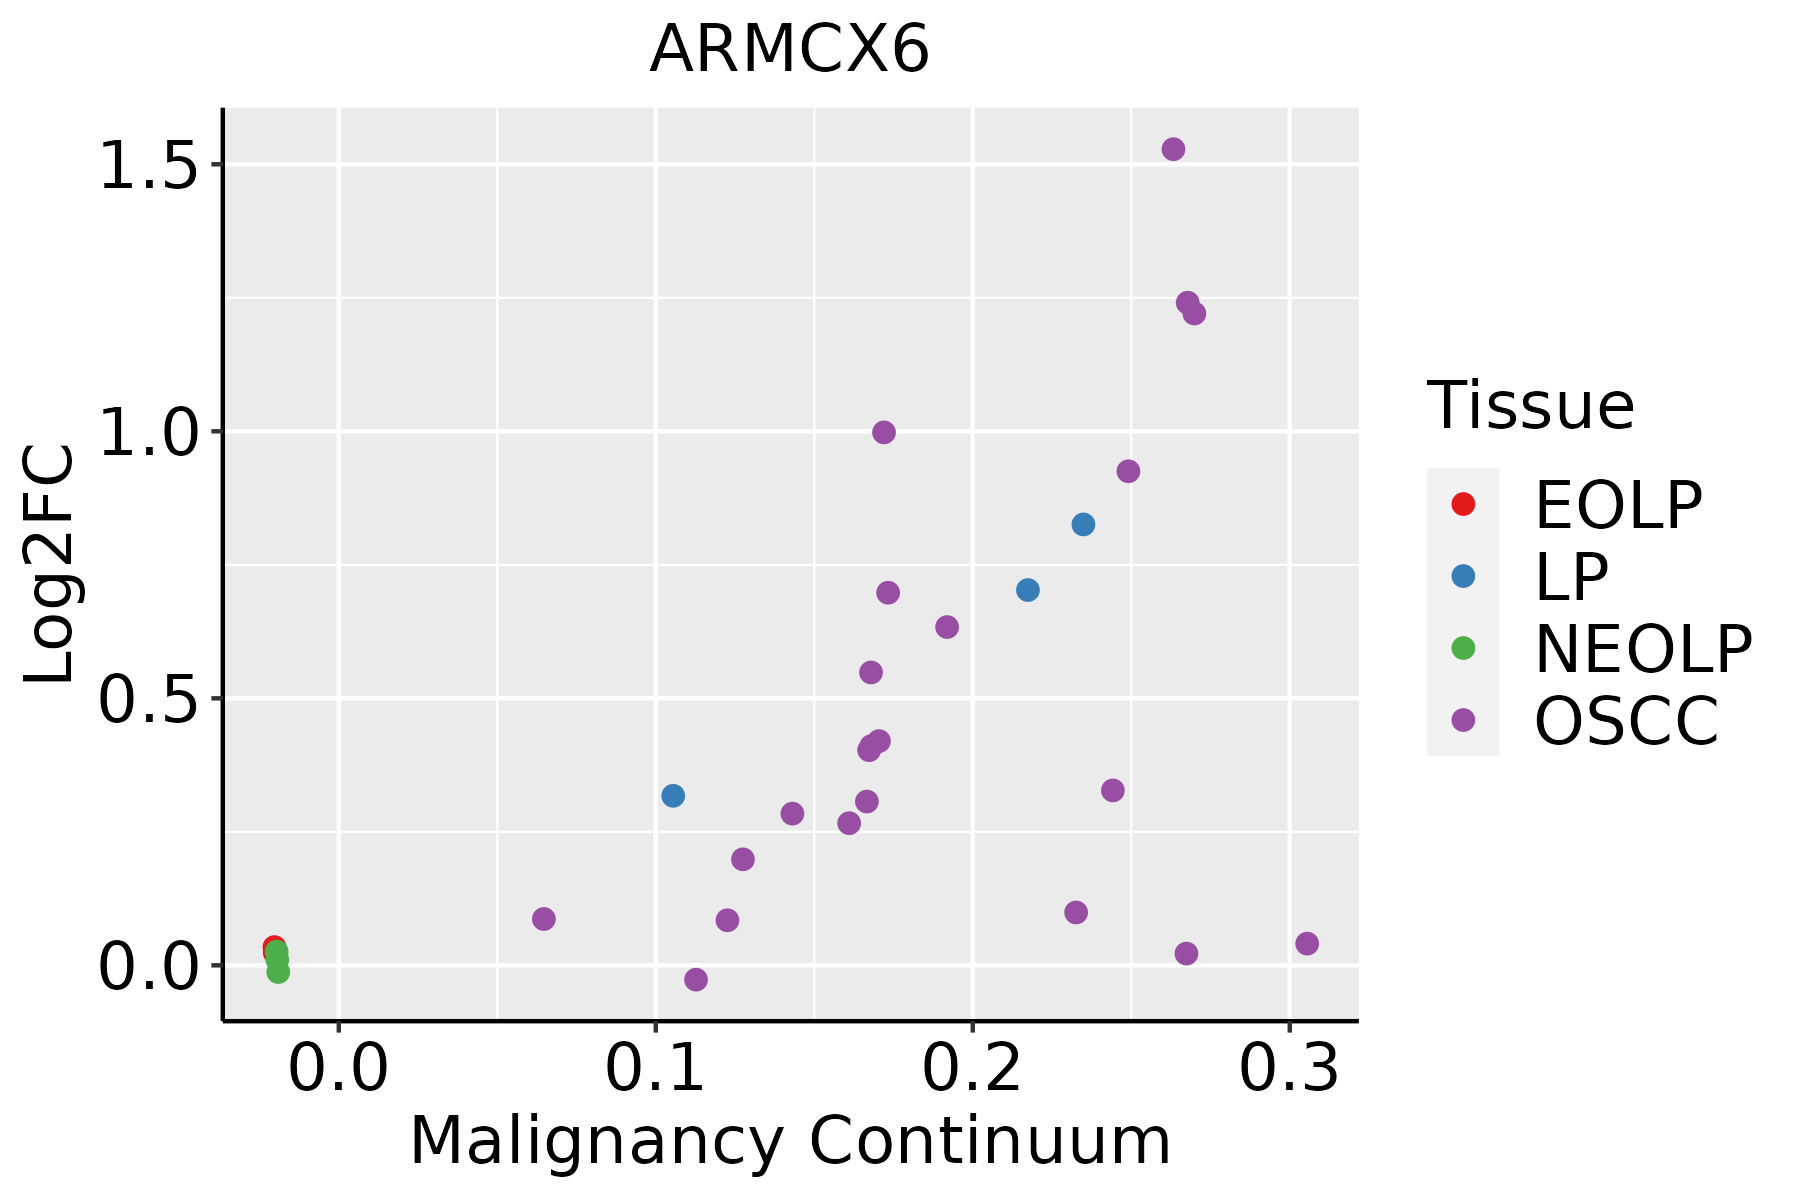 | EOLP: Erosive Oral lichen planus |
| LP: leukoplakia | ||
| NEOLP: Non-erosive oral lichen planus | ||
| OSCC: Oral squamous cell carcinoma | ||
| Thyroid |  | ATC: Anaplastic thyroid cancer |
| HT: Hashimoto's thyroiditis | ||
| PTC: Papillary thyroid cancer |
| ∗log2FC in expression of this searched gene in stem-like cells from each diseased tissue sample relative to stem-like cells in normal samples in each tissue plotted against the malignancy continuum. Samples are colored based on if they are from different disease stage. |
Top |
Malignant transformation related pathway analysis |
| Find out the enriched GO biological processes and KEGG pathways involved in transition from healthy to precancer to cancer |
| Tissue | Disease Stage | Enriched GO biological Processes |
| Colorectum | AD |  |
| Colorectum | SER |  |
| Colorectum | MSS |  |
| Colorectum | MSI-H |  |
| Colorectum | FAP |  |
| ∗Top 15 enriched GO BP terms are showed in the bar plot of each disease state in each tissue. Each row represents a significant GO biological process which is colored according to the -log10(p.adjust). |
| Page: 1 2 3 4 5 6 7 8 9 |
| GO ID | Tissue | Disease Stage | Description | Gene Ratio | Bg Ratio | pvalue | p.adjust | Count |
| Page: 1 |
| Pathway ID | Tissue | Disease Stage | Description | Gene Ratio | Bg Ratio | pvalue | p.adjust | qvalue | Count |
| Page: 1 |
Top |
Cell-cell communication analysis |
| Identification of potential cell-cell interactions between two cell types and their ligand-receptor pairs for different disease states |
| Ligand | Receptor | LRpair | Pathway | Tissue | Disease Stage |
| Page: 1 |
Top |
Single-cell gene regulatory network inference analysis |
| Find out the significant the regulons (TFs) and the target genes of each regulon across cell types for different disease states |
| TF | Cell Type | Tissue | Disease Stage | Target Gene | RSS | Regulon Activity |
| ∗The dot plots of a searched regulon are shown for all cell subpopulations in each disease state of each tissue based on the regulon specific score inferred using pySCENIC and by calculating the average expression. |
| Page: 1 |
Top |
Somatic mutation of malignant transformation related genes |
| Annotation of somatic variants for genes involved in malignant transformation |
| Hugo Symbol | Variant Class | Variant Classification | dbSNP RS | HGVSc | HGVSp | HGVSp Short | SWISSPROT | BIOTYPE | SIFT | PolyPhen | Tumor Sample Barcode | Tissue | Histology | Sex | Age | Stage | Therapy Types | Drugs | Outcome |
| ARMCX6 | SNV | Missense_Mutation | c.287G>A | p.Arg96Gln | p.R96Q | Q7L4S7 | protein_coding | tolerated(0.08) | probably_damaging(0.987) | TCGA-AN-A046-01 | Breast | breast invasive carcinoma | Female | >=65 | I/II | Unknown | Unknown | SD | |
| ARMCX6 | SNV | Missense_Mutation | c.130N>C | p.Glu44Gln | p.E44Q | Q7L4S7 | protein_coding | tolerated(0.38) | possibly_damaging(0.618) | TCGA-D8-A1J8-01 | Breast | breast invasive carcinoma | Female | >=65 | I/II | Hormone Therapy | nolvadex | SD | |
| ARMCX6 | SNV | Missense_Mutation | novel | c.367N>A | p.Cys123Ser | p.C123S | Q7L4S7 | protein_coding | tolerated(0.22) | possibly_damaging(0.561) | TCGA-5M-AAT6-01 | Colorectum | colon adenocarcinoma | Female | <65 | III/IV | Unknown | Unknown | PD |
| ARMCX6 | SNV | Missense_Mutation | novel | c.119N>G | p.Glu40Gly | p.E40G | Q7L4S7 | protein_coding | tolerated(0.18) | probably_damaging(0.986) | TCGA-AA-3877-01 | Colorectum | colon adenocarcinoma | Female | >=65 | I/II | Unknown | Unknown | SD |
| ARMCX6 | SNV | Missense_Mutation | c.46A>T | p.Ile16Phe | p.I16F | Q7L4S7 | protein_coding | deleterious(0) | probably_damaging(0.99) | TCGA-CK-5913-01 | Colorectum | colon adenocarcinoma | Female | <65 | I/II | Unknown | Unknown | SD | |
| ARMCX6 | SNV | Missense_Mutation | c.437N>A | p.Gly146Asp | p.G146D | Q7L4S7 | protein_coding | tolerated(0.05) | possibly_damaging(0.836) | TCGA-A5-A0VQ-01 | Endometrium | uterine corpus endometrioid carcinoma | Female | <65 | I/II | Chemotherapy | carboplatin | SD | |
| ARMCX6 | SNV | Missense_Mutation | rs781804370 | c.32C>T | p.Ala11Val | p.A11V | Q7L4S7 | protein_coding | deleterious(0) | probably_damaging(0.992) | TCGA-AP-A051-01 | Endometrium | uterine corpus endometrioid carcinoma | Female | >=65 | I/II | Unknown | Unknown | SD |
| ARMCX6 | SNV | Missense_Mutation | rs782019037 | c.307N>T | p.Arg103Trp | p.R103W | Q7L4S7 | protein_coding | deleterious(0) | probably_damaging(0.997) | TCGA-AP-A059-01 | Endometrium | uterine corpus endometrioid carcinoma | Female | >=65 | I/II | Unknown | Unknown | SD |
| ARMCX6 | SNV | Missense_Mutation | novel | c.217N>T | p.Gly73Trp | p.G73W | Q7L4S7 | protein_coding | deleterious(0) | probably_damaging(0.984) | TCGA-AP-A1E3-01 | Endometrium | uterine corpus endometrioid carcinoma | Female | <65 | III/IV | Chemotherapy | doxorubicin | SD |
| ARMCX6 | SNV | Missense_Mutation | novel | c.216N>A | p.Asp72Glu | p.D72E | Q7L4S7 | protein_coding | tolerated(0.19) | benign(0.007) | TCGA-AP-A1E3-01 | Endometrium | uterine corpus endometrioid carcinoma | Female | <65 | III/IV | Chemotherapy | doxorubicin | SD |
| Page: 1 2 3 |
Top |
Related drugs of malignant transformation related genes |
| Identification of chemicals and drugs interact with genes involved in malignant transfromation |
| (DGIdb 4.0) |
| Entrez ID | Symbol | Category | Interaction Types | Drug Claim Name | Drug Name | PMIDs |
| Page: 1 |

Copyright 2023-Present -The University of Texas Health Science Center at Houston |