
|
|||||
|
 | |
| |
| |
| |
| |
| |
|
Gene: ARMCX3 |
Gene summary for ARMCX3 |
| Gene information | Species | Human | Gene symbol | ARMCX3 | Gene ID | 51566 |
| Gene name | armadillo repeat containing X-linked 3 | |
| Gene Alias | ALEX3 | |
| Cytomap | Xq22.1 | |
| Gene Type | protein-coding | GO ID | GO:0006139 | UniProtAcc | A0A024RCF9 |
Top |
Malignant transformation analysis |
| Identification of the aberrant gene expression in precancerous and cancerous lesions by comparing the gene expression of stem-like cells in diseased tissues with normal stem cells |
| Entrez ID | Symbol | Replicates | Species | Organ | Tissue | Adj P-value | Log2FC | Malignancy |
| 51566 | ARMCX3 | AEH-subject1 | Human | Endometrium | AEH | 1.77e-10 | -3.05e-01 | -0.3059 |
| 51566 | ARMCX3 | AEH-subject2 | Human | Endometrium | AEH | 1.42e-10 | -4.02e-01 | -0.2525 |
| 51566 | ARMCX3 | AEH-subject3 | Human | Endometrium | AEH | 8.86e-11 | -3.04e-01 | -0.2576 |
| 51566 | ARMCX3 | AEH-subject4 | Human | Endometrium | AEH | 2.55e-02 | -2.35e-01 | -0.2657 |
| 51566 | ARMCX3 | AEH-subject5 | Human | Endometrium | AEH | 3.04e-07 | -2.94e-01 | -0.2953 |
| 51566 | ARMCX3 | EEC-subject1 | Human | Endometrium | EEC | 3.54e-05 | -2.71e-01 | -0.2682 |
| 51566 | ARMCX3 | EEC-subject2 | Human | Endometrium | EEC | 4.72e-12 | -3.40e-01 | -0.2607 |
| 51566 | ARMCX3 | EEC-subject3 | Human | Endometrium | EEC | 1.30e-29 | -4.06e-01 | -0.2525 |
| 51566 | ARMCX3 | EEC-subject4 | Human | Endometrium | EEC | 2.46e-09 | -2.97e-01 | -0.2571 |
| 51566 | ARMCX3 | EEC-subject5 | Human | Endometrium | EEC | 5.53e-06 | -2.81e-01 | -0.249 |
| 51566 | ARMCX3 | GSM5276934 | Human | Endometrium | EEC | 1.19e-06 | -1.55e-01 | -0.0913 |
| 51566 | ARMCX3 | GSM6177620_NYU_UCEC1_lib1_lib1 | Human | Endometrium | EEC | 2.79e-21 | -2.32e-01 | -0.1869 |
| 51566 | ARMCX3 | GSM6177620_NYU_UCEC1_lib2_lib2 | Human | Endometrium | EEC | 1.23e-25 | -3.23e-01 | -0.1875 |
| 51566 | ARMCX3 | GSM6177620_NYU_UCEC1_lib3_lib3 | Human | Endometrium | EEC | 1.10e-24 | -3.53e-01 | -0.1883 |
| 51566 | ARMCX3 | GSM6177621_NYU_UCEC2_lib1_lib1 | Human | Endometrium | EEC | 5.42e-29 | -3.19e-01 | -0.1934 |
| 51566 | ARMCX3 | GSM6177622_NYU_UCEC3_lib1_lib1 | Human | Endometrium | EEC | 3.15e-36 | -3.92e-01 | -0.1917 |
| 51566 | ARMCX3 | GSM6177622_NYU_UCEC3_lib2_lib2 | Human | Endometrium | EEC | 2.01e-35 | -4.05e-01 | -0.1916 |
| 51566 | ARMCX3 | GSM6177623_NYU_UCEC3_Vis | Human | Endometrium | EEC | 7.28e-09 | -3.05e-01 | -0.1269 |
| 51566 | ARMCX3 | LZE4T | Human | Esophagus | ESCC | 4.19e-14 | 6.50e-01 | 0.0811 |
| 51566 | ARMCX3 | LZE7T | Human | Esophagus | ESCC | 1.17e-07 | 7.03e-01 | 0.0667 |
| Page: 1 2 3 4 5 6 |
| Tissue | Expression Dynamics | Abbreviation |
| Endometrium | 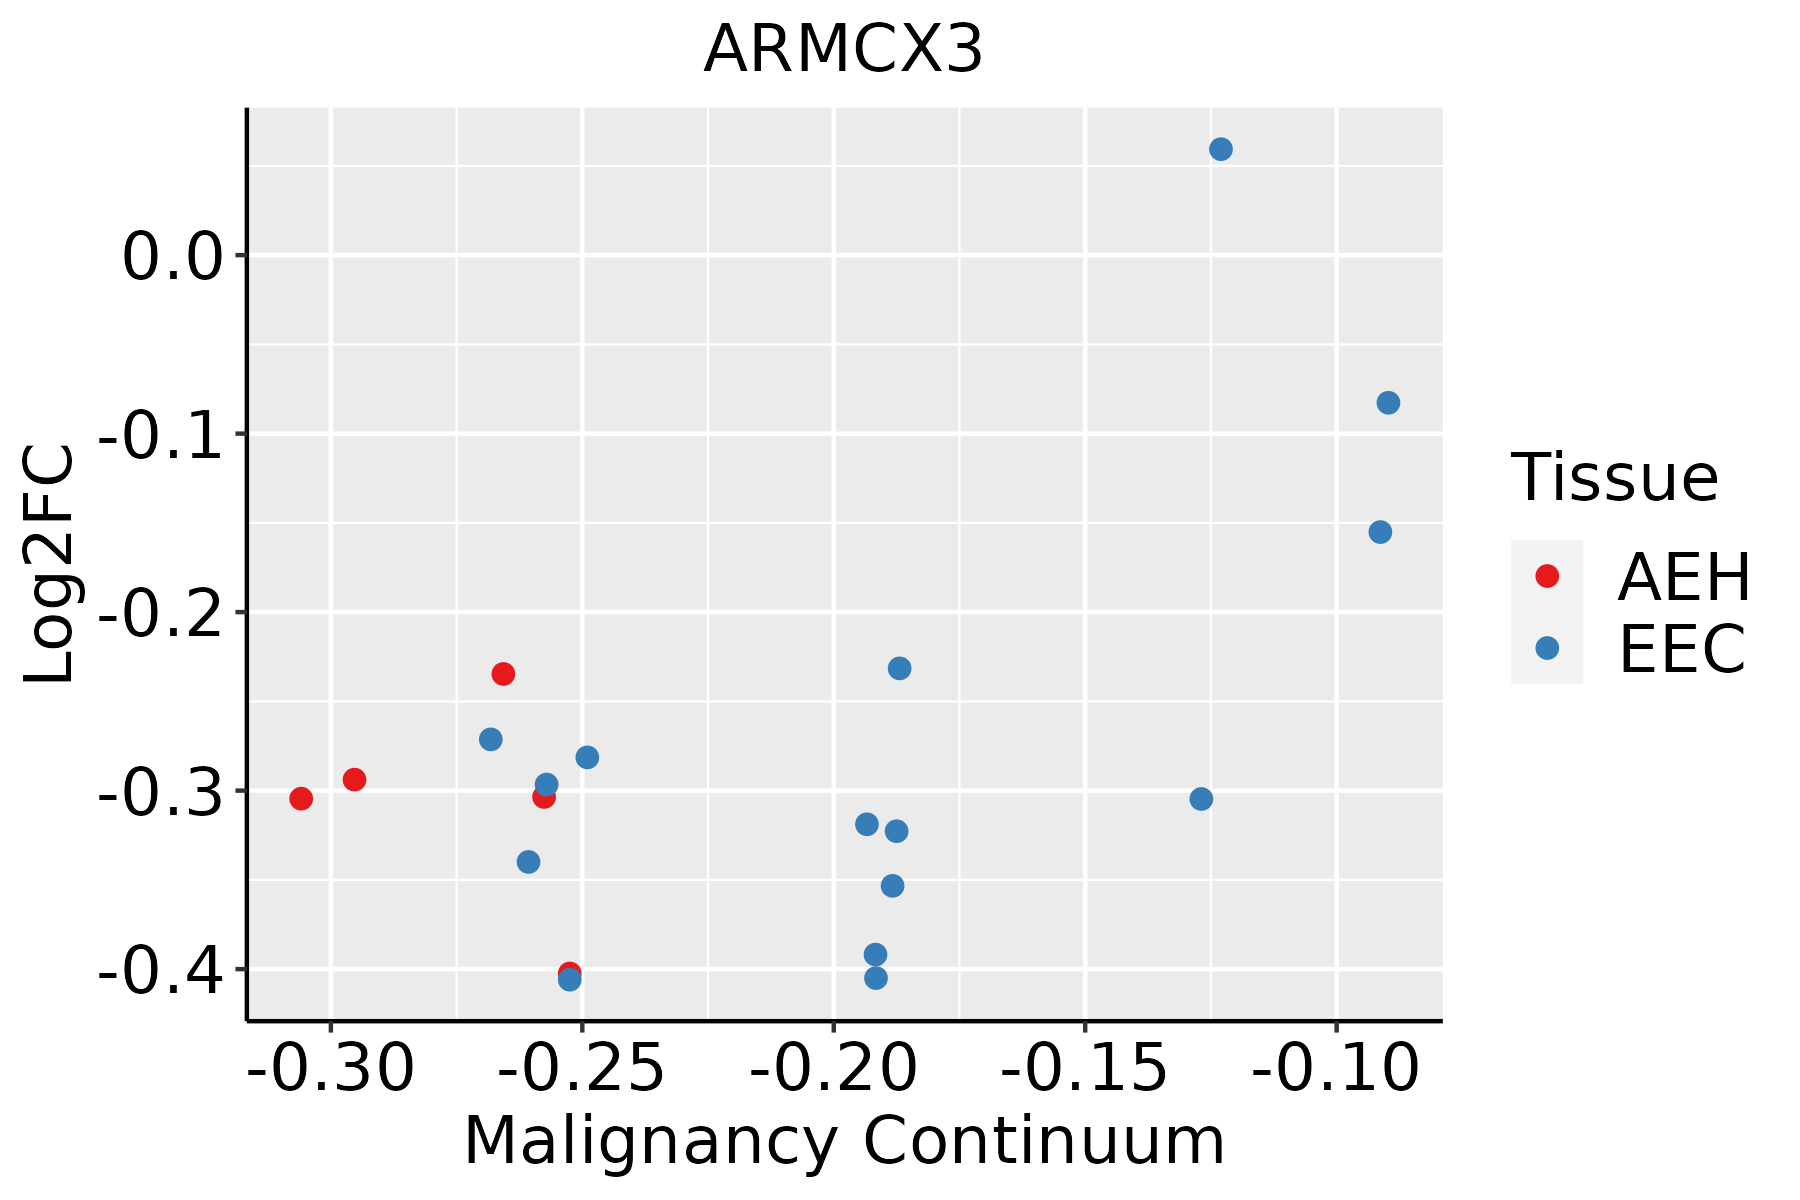 | AEH: Atypical endometrial hyperplasia |
| EEC: Endometrioid Cancer | ||
| Esophagus | 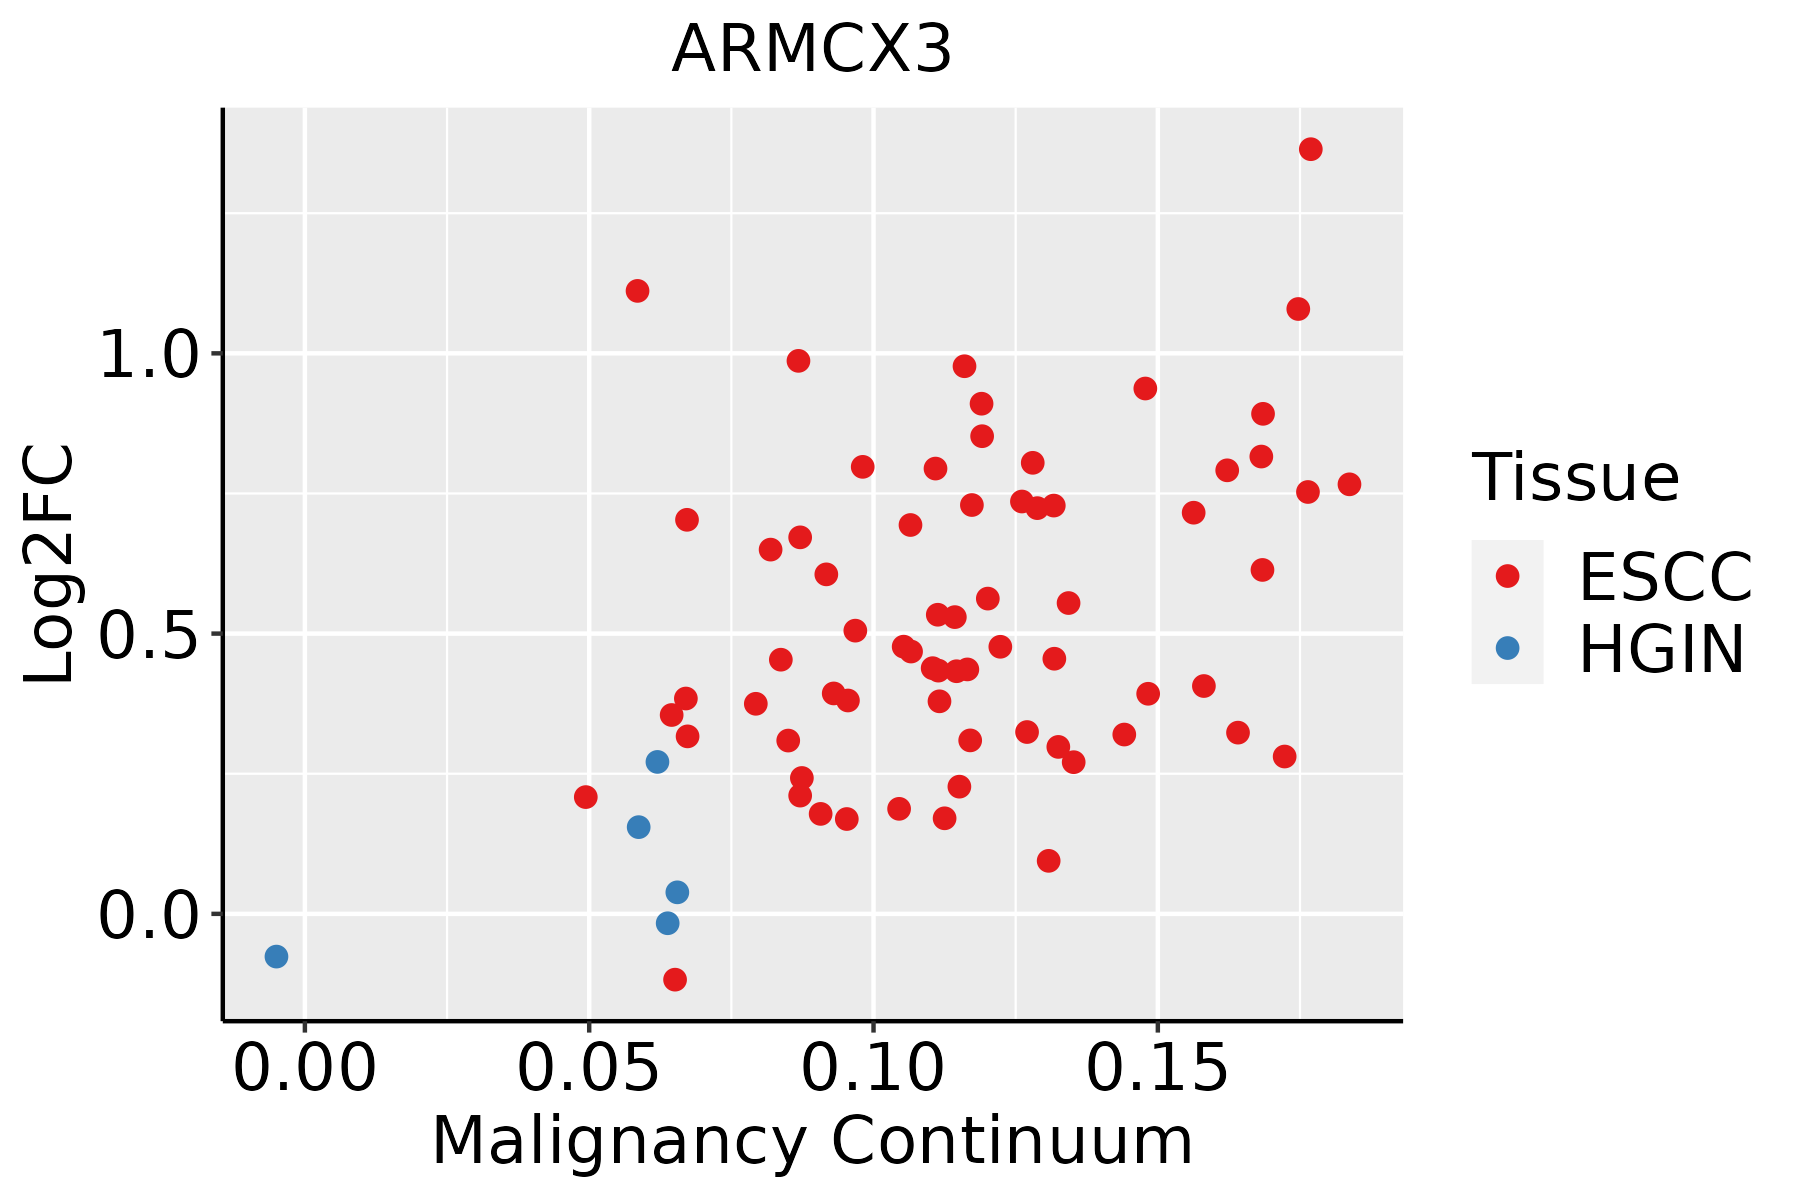 | ESCC: Esophageal squamous cell carcinoma |
| HGIN: High-grade intraepithelial neoplasias | ||
| LGIN: Low-grade intraepithelial neoplasias | ||
| Oral Cavity | 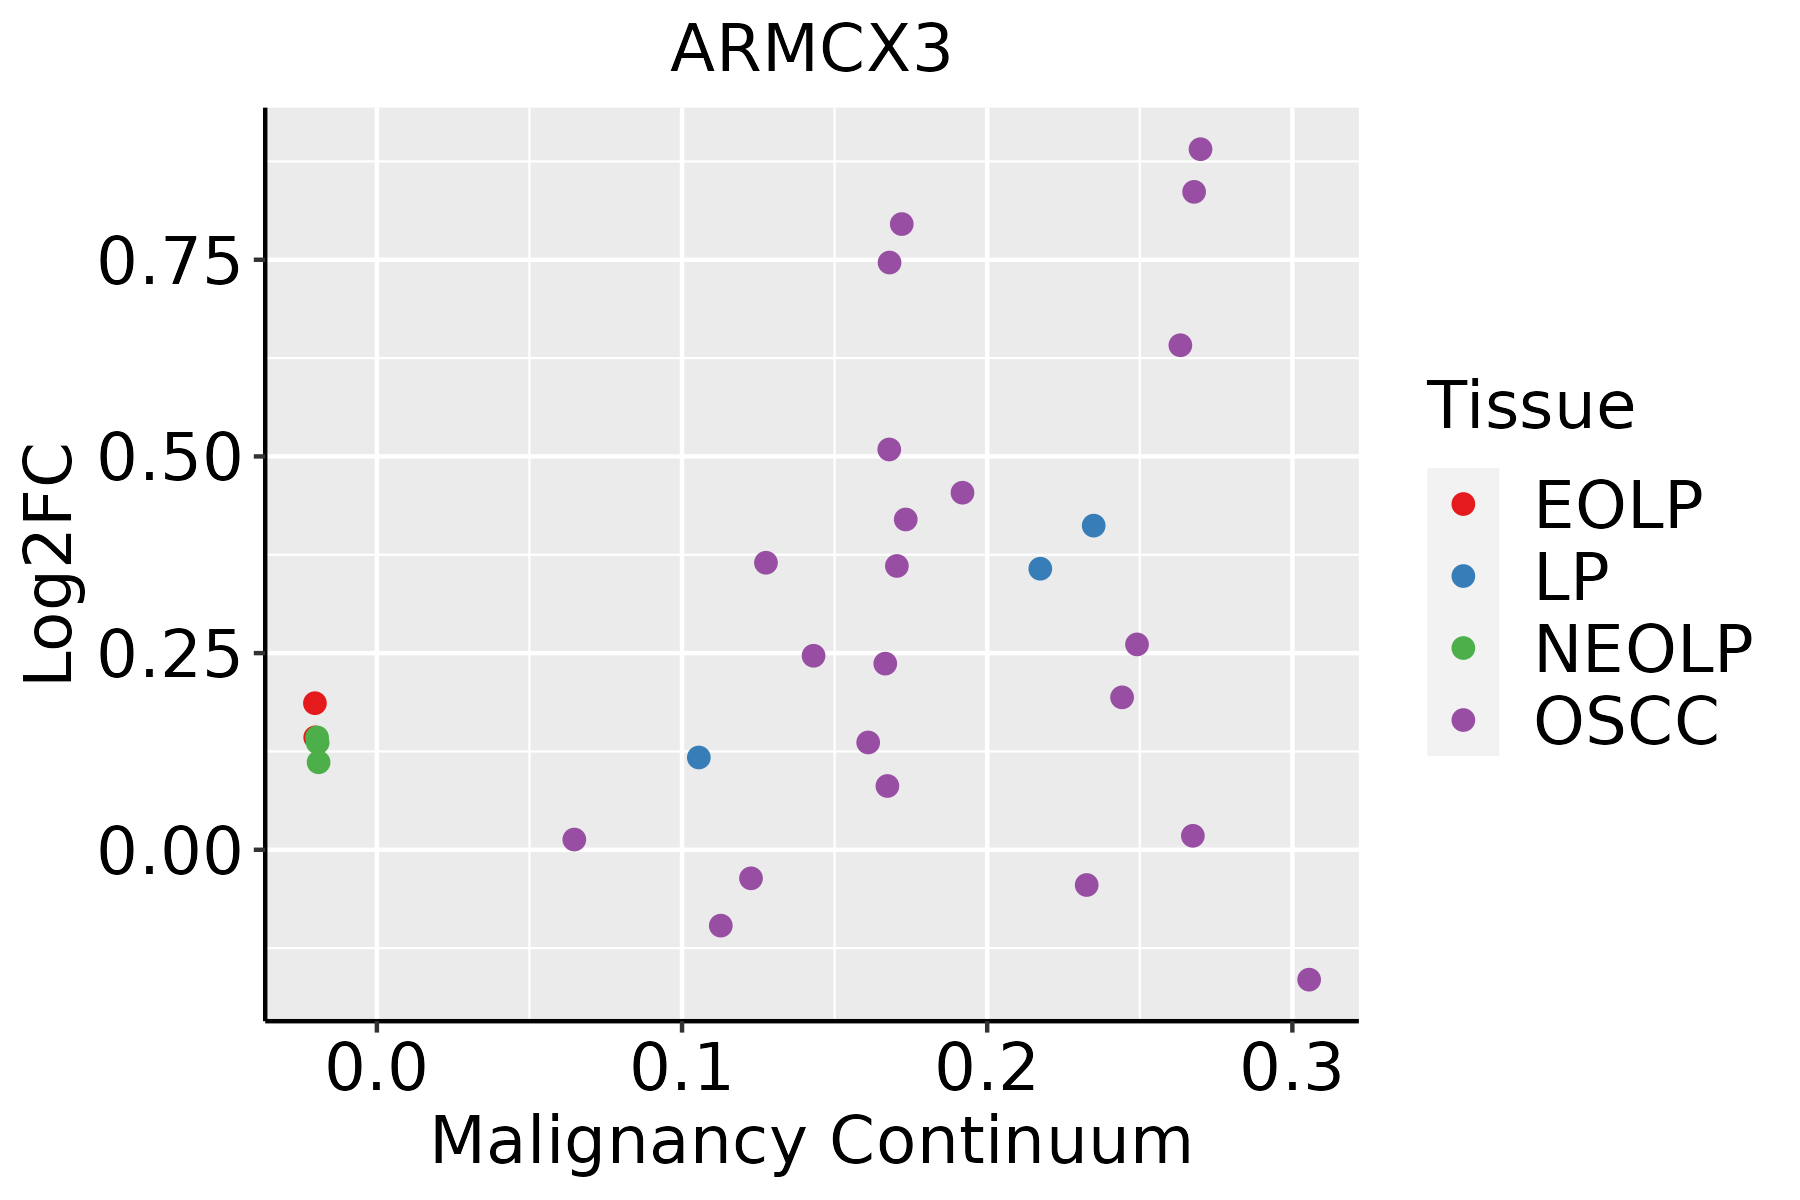 | EOLP: Erosive Oral lichen planus |
| LP: leukoplakia | ||
| NEOLP: Non-erosive oral lichen planus | ||
| OSCC: Oral squamous cell carcinoma | ||
| Prostate | 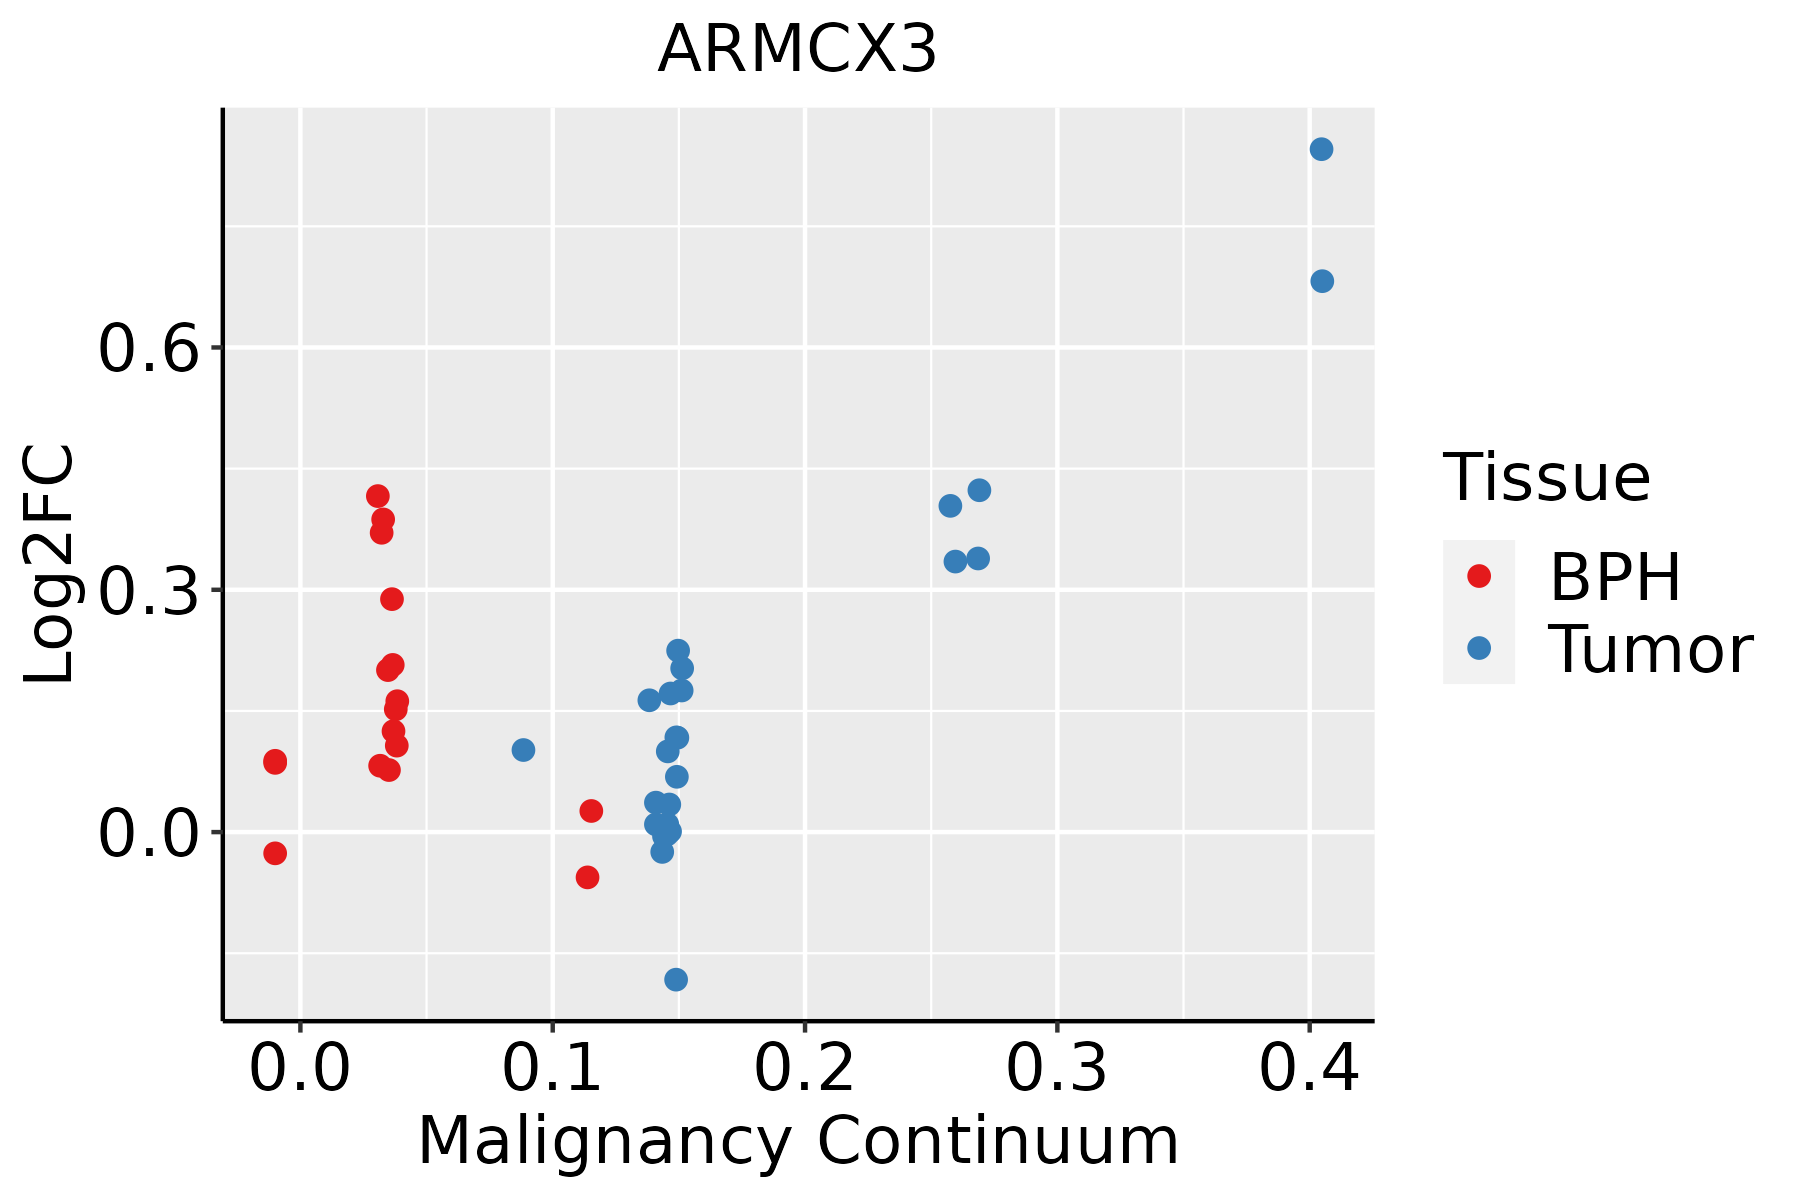 | BPH: Benign Prostatic Hyperplasia |
| Thyroid | 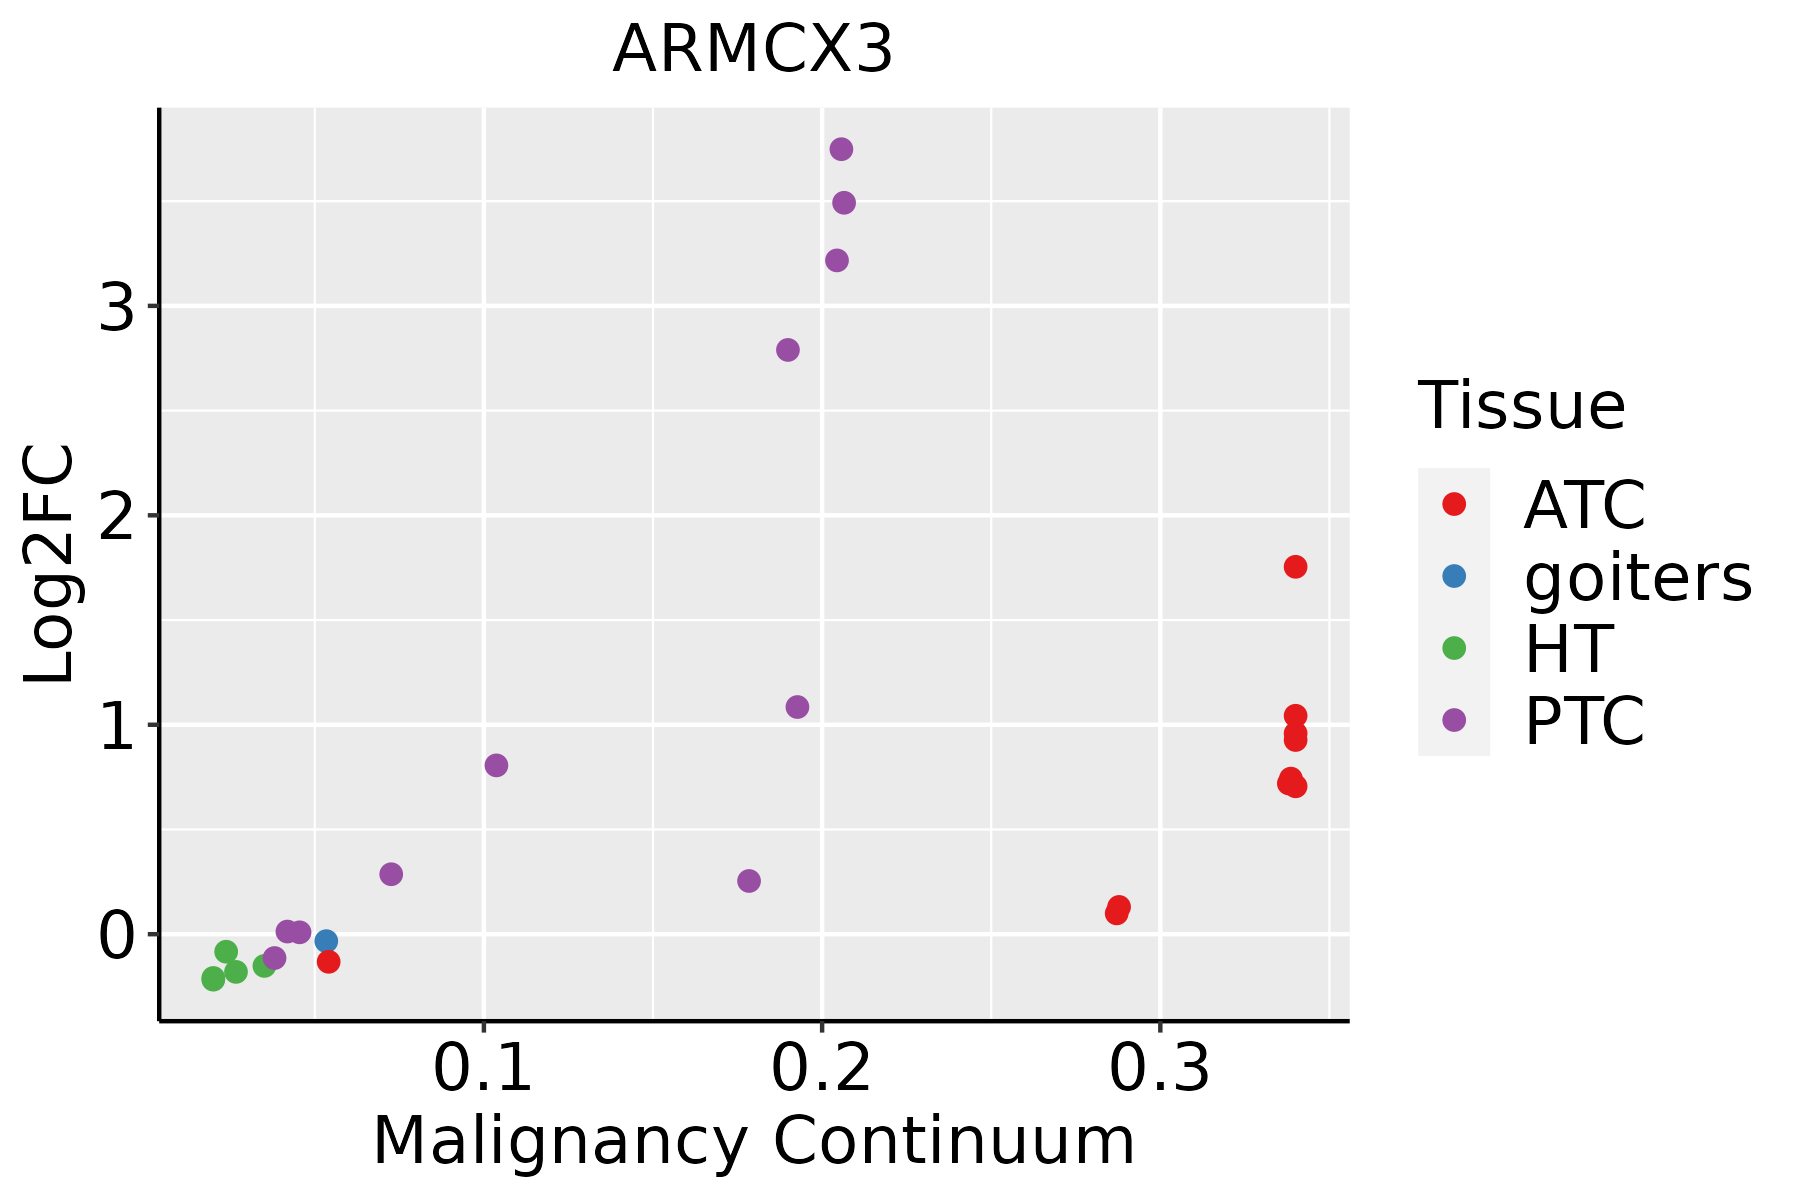 | ATC: Anaplastic thyroid cancer |
| HT: Hashimoto's thyroiditis | ||
| PTC: Papillary thyroid cancer |
| ∗log2FC in expression of this searched gene in stem-like cells from each diseased tissue sample relative to stem-like cells in normal samples in each tissue plotted against the malignancy continuum. Samples are colored based on if they are from different disease stage. |
Top |
Malignant transformation related pathway analysis |
| Find out the enriched GO biological processes and KEGG pathways involved in transition from healthy to precancer to cancer |
| Tissue | Disease Stage | Enriched GO biological Processes |
| Colorectum | AD |  |
| Colorectum | SER |  |
| Colorectum | MSS |  |
| Colorectum | MSI-H |  |
| Colorectum | FAP |  |
| ∗Top 15 enriched GO BP terms are showed in the bar plot of each disease state in each tissue. Each row represents a significant GO biological process which is colored according to the -log10(p.adjust). |
| Page: 1 2 3 4 5 6 7 8 9 |
| GO ID | Tissue | Disease Stage | Description | Gene Ratio | Bg Ratio | pvalue | p.adjust | Count |
| GO:00516568 | Endometrium | AEH | establishment of organelle localization | 77/2100 | 390/18723 | 4.89e-07 | 1.94e-05 | 77 |
| GO:00307058 | Endometrium | AEH | cytoskeleton-dependent intracellular transport | 38/2100 | 195/18723 | 4.72e-04 | 4.91e-03 | 38 |
| GO:00080887 | Endometrium | AEH | axo-dendritic transport | 16/2100 | 75/18723 | 8.13e-03 | 4.49e-02 | 16 |
| GO:005165613 | Endometrium | EEC | establishment of organelle localization | 75/2168 | 390/18723 | 6.23e-06 | 1.49e-04 | 75 |
| GO:003070514 | Endometrium | EEC | cytoskeleton-dependent intracellular transport | 39/2168 | 195/18723 | 4.40e-04 | 4.58e-03 | 39 |
| GO:000808813 | Endometrium | EEC | axo-dendritic transport | 17/2168 | 75/18723 | 4.71e-03 | 2.99e-02 | 17 |
| GO:005165617 | Esophagus | ESCC | establishment of organelle localization | 273/8552 | 390/18723 | 9.13e-23 | 1.81e-20 | 273 |
| GO:003070518 | Esophagus | ESCC | cytoskeleton-dependent intracellular transport | 133/8552 | 195/18723 | 1.48e-10 | 4.27e-09 | 133 |
| GO:001097013 | Esophagus | ESCC | transport along microtubule | 107/8552 | 155/18723 | 3.17e-09 | 6.80e-08 | 107 |
| GO:00723846 | Esophagus | ESCC | organelle transport along microtubule | 65/8552 | 85/18723 | 6.61e-09 | 1.35e-07 | 65 |
| GO:000808810 | Esophagus | ESCC | axo-dendritic transport | 58/8552 | 75/18723 | 2.09e-08 | 4.02e-07 | 58 |
| GO:00989304 | Esophagus | ESCC | axonal transport | 49/8552 | 64/18723 | 4.54e-07 | 6.15e-06 | 49 |
| GO:00991114 | Esophagus | ESCC | microtubule-based transport | 115/8552 | 190/18723 | 2.54e-05 | 2.15e-04 | 115 |
| GO:005165411 | Esophagus | ESCC | establishment of mitochondrion localization | 24/8552 | 29/18723 | 4.50e-05 | 3.55e-04 | 24 |
| GO:00346431 | Esophagus | ESCC | establishment of mitochondrion localization, microtubule-mediated | 21/8552 | 26/18723 | 2.69e-04 | 1.63e-03 | 21 |
| GO:00474971 | Esophagus | ESCC | mitochondrion transport along microtubule | 21/8552 | 26/18723 | 2.69e-04 | 1.63e-03 | 21 |
| GO:00516463 | Esophagus | ESCC | mitochondrion localization | 35/8552 | 50/18723 | 4.33e-04 | 2.44e-03 | 35 |
| GO:005165610 | Oral cavity | OSCC | establishment of organelle localization | 239/7305 | 390/18723 | 2.46e-19 | 3.31e-17 | 239 |
| GO:003070510 | Oral cavity | OSCC | cytoskeleton-dependent intracellular transport | 113/7305 | 195/18723 | 6.03e-08 | 1.09e-06 | 113 |
| GO:00109706 | Oral cavity | OSCC | transport along microtubule | 88/7305 | 155/18723 | 5.35e-06 | 6.02e-05 | 88 |
| Page: 1 2 3 4 |
| Pathway ID | Tissue | Disease Stage | Description | Gene Ratio | Bg Ratio | pvalue | p.adjust | qvalue | Count |
| Page: 1 |
Top |
Cell-cell communication analysis |
| Identification of potential cell-cell interactions between two cell types and their ligand-receptor pairs for different disease states |
| Ligand | Receptor | LRpair | Pathway | Tissue | Disease Stage |
| Page: 1 |
Top |
Single-cell gene regulatory network inference analysis |
| Find out the significant the regulons (TFs) and the target genes of each regulon across cell types for different disease states |
| TF | Cell Type | Tissue | Disease Stage | Target Gene | RSS | Regulon Activity |
| ∗The dot plots of a searched regulon are shown for all cell subpopulations in each disease state of each tissue based on the regulon specific score inferred using pySCENIC and by calculating the average expression. |
| Page: 1 |
Top |
Somatic mutation of malignant transformation related genes |
| Annotation of somatic variants for genes involved in malignant transformation |
| Hugo Symbol | Variant Class | Variant Classification | dbSNP RS | HGVSc | HGVSp | HGVSp Short | SWISSPROT | BIOTYPE | SIFT | PolyPhen | Tumor Sample Barcode | Tissue | Histology | Sex | Age | Stage | Therapy Types | Drugs | Outcome |
| ARMCX3 | SNV | Missense_Mutation | c.604G>T | p.Val202Leu | p.V202L | Q9UH62 | protein_coding | deleterious(0.02) | benign(0.101) | TCGA-AN-A046-01 | Breast | breast invasive carcinoma | Female | >=65 | I/II | Unknown | Unknown | SD | |
| ARMCX3 | SNV | Missense_Mutation | novel | c.120N>T | p.Glu40Asp | p.E40D | Q9UH62 | protein_coding | tolerated(0.37) | benign(0.177) | TCGA-E2-A15K-06 | Breast | breast invasive carcinoma | Female | <65 | I/II | Chemotherapy | adriamycin | SD |
| ARMCX3 | deletion | Frame_Shift_Del | novel | c.597delG | p.Arg199SerfsTer6 | p.R199Sfs*6 | Q9UH62 | protein_coding | TCGA-D8-A27V-01 | Breast | breast invasive carcinoma | Female | <65 | I/II | Hormone Therapy | tamoxiphen | SD | ||
| ARMCX3 | SNV | Missense_Mutation | novel | c.644N>A | p.Arg215His | p.R215H | Q9UH62 | protein_coding | tolerated(0.08) | probably_damaging(0.93) | TCGA-VS-A9UZ-01 | Cervix | cervical & endocervical cancer | Female | <65 | I/II | Unknown | Unknown | SD |
| ARMCX3 | deletion | Frame_Shift_Del | c.107delN | p.Met38TrpfsTer36 | p.M38Wfs*36 | Q9UH62 | protein_coding | TCGA-2W-A8YY-01 | Cervix | cervical & endocervical cancer | Female | <65 | I/II | Chemotherapy | cisplatin | CR | |||
| ARMCX3 | insertion | In_Frame_Ins | novel | c.357_358insTTGTTCTGTTTTCTT | p.Ser119_Pro120insLeuPheCysPheLeu | p.S119_P120insLFCFL | Q9UH62 | protein_coding | TCGA-DS-A1OB-01 | Cervix | cervical & endocervical cancer | Female | <65 | I/II | Chemotherapy | carboplatin | PD | ||
| ARMCX3 | SNV | Missense_Mutation | c.715N>T | p.His239Tyr | p.H239Y | Q9UH62 | protein_coding | deleterious(0.04) | possibly_damaging(0.53) | TCGA-DM-A1HB-01 | Colorectum | colon adenocarcinoma | Male | >=65 | III/IV | Unknown | Unknown | SD | |
| ARMCX3 | insertion | Frame_Shift_Ins | novel | c.379_380insT | p.Cys128LeufsTer4 | p.C128Lfs*4 | Q9UH62 | protein_coding | TCGA-A6-6781-01 | Colorectum | colon adenocarcinoma | Male | <65 | III/IV | Chemotherapy | oxaliplatin | SD | ||
| ARMCX3 | deletion | Frame_Shift_Del | c.107delN | p.Met38TrpfsTer36 | p.M38Wfs*36 | Q9UH62 | protein_coding | TCGA-AA-3877-01 | Colorectum | colon adenocarcinoma | Female | >=65 | I/II | Unknown | Unknown | SD | |||
| ARMCX3 | insertion | Nonsense_Mutation | novel | c.108_109insTAGAGT | p.Glu36_Lys37insTer | p.E36_K37ins* | Q9UH62 | protein_coding | TCGA-AM-5820-01 | Colorectum | colon adenocarcinoma | Female | <65 | I/II | Unknown | Unknown | SD |
| Page: 1 2 3 4 5 |
Top |
Related drugs of malignant transformation related genes |
| Identification of chemicals and drugs interact with genes involved in malignant transfromation |
| (DGIdb 4.0) |
| Entrez ID | Symbol | Category | Interaction Types | Drug Claim Name | Drug Name | PMIDs |
| Page: 1 |

Copyright 2023-Present -The University of Texas Health Science Center at Houston |