
|
|||||
|
 | |
| |
| |
| |
| |
| |
|
Gene: ARMC9 |
Gene summary for ARMC9 |
| Gene information | Species | Human | Gene symbol | ARMC9 | Gene ID | 80210 |
| Gene name | armadillo repeat containing 9 | |
| Gene Alias | ARM | |
| Cytomap | 2q37.1 | |
| Gene Type | protein-coding | GO ID | GO:0006996 | UniProtAcc | A0A024R486 |
Top |
Malignant transformation analysis |
| Identification of the aberrant gene expression in precancerous and cancerous lesions by comparing the gene expression of stem-like cells in diseased tissues with normal stem cells |
| Entrez ID | Symbol | Replicates | Species | Organ | Tissue | Adj P-value | Log2FC | Malignancy |
| 80210 | ARMC9 | CCI_2 | Human | Cervix | CC | 2.08e-02 | 2.69e-01 | 0.5249 |
| 80210 | ARMC9 | CCI_3 | Human | Cervix | CC | 1.49e-02 | 2.56e-01 | 0.516 |
| 80210 | ARMC9 | HTA11_3410_2000001011 | Human | Colorectum | AD | 1.59e-08 | 5.01e-01 | 0.0155 |
| 80210 | ARMC9 | HTA11_2487_2000001011 | Human | Colorectum | SER | 3.12e-04 | 5.85e-01 | -0.1808 |
| 80210 | ARMC9 | HTA11_2951_2000001011 | Human | Colorectum | AD | 1.52e-05 | 9.08e-01 | 0.0216 |
| 80210 | ARMC9 | HTA11_1938_2000001011 | Human | Colorectum | AD | 1.75e-07 | 7.50e-01 | -0.0811 |
| 80210 | ARMC9 | HTA11_347_2000001011 | Human | Colorectum | AD | 1.54e-25 | 9.60e-01 | -0.1954 |
| 80210 | ARMC9 | HTA11_411_2000001011 | Human | Colorectum | SER | 2.29e-07 | 1.16e+00 | -0.2602 |
| 80210 | ARMC9 | HTA11_2112_2000001011 | Human | Colorectum | SER | 3.18e-04 | 8.70e-01 | -0.2196 |
| 80210 | ARMC9 | HTA11_3361_2000001011 | Human | Colorectum | AD | 2.70e-06 | 7.46e-01 | -0.1207 |
| 80210 | ARMC9 | HTA11_83_2000001011 | Human | Colorectum | SER | 3.84e-08 | 7.84e-01 | -0.1526 |
| 80210 | ARMC9 | HTA11_696_2000001011 | Human | Colorectum | AD | 8.64e-42 | 1.19e+00 | -0.1464 |
| 80210 | ARMC9 | HTA11_866_2000001011 | Human | Colorectum | AD | 5.63e-31 | 9.26e-01 | -0.1001 |
| 80210 | ARMC9 | HTA11_1391_2000001011 | Human | Colorectum | AD | 6.23e-30 | 1.21e+00 | -0.059 |
| 80210 | ARMC9 | HTA11_2992_2000001011 | Human | Colorectum | SER | 4.02e-09 | 1.16e+00 | -0.1706 |
| 80210 | ARMC9 | HTA11_5216_2000001011 | Human | Colorectum | SER | 4.94e-03 | 6.76e-01 | -0.1462 |
| 80210 | ARMC9 | HTA11_546_2000001011 | Human | Colorectum | AD | 3.39e-16 | 1.11e+00 | -0.0842 |
| 80210 | ARMC9 | HTA11_9341_2000001011 | Human | Colorectum | SER | 1.84e-12 | 1.39e+00 | -0.00410000000000005 |
| 80210 | ARMC9 | HTA11_7862_2000001011 | Human | Colorectum | AD | 5.86e-08 | 7.64e-01 | -0.0179 |
| 80210 | ARMC9 | HTA11_866_3004761011 | Human | Colorectum | AD | 3.05e-46 | 1.41e+00 | 0.096 |
| Page: 1 2 3 4 |
| Tissue | Expression Dynamics | Abbreviation |
| Cervix | 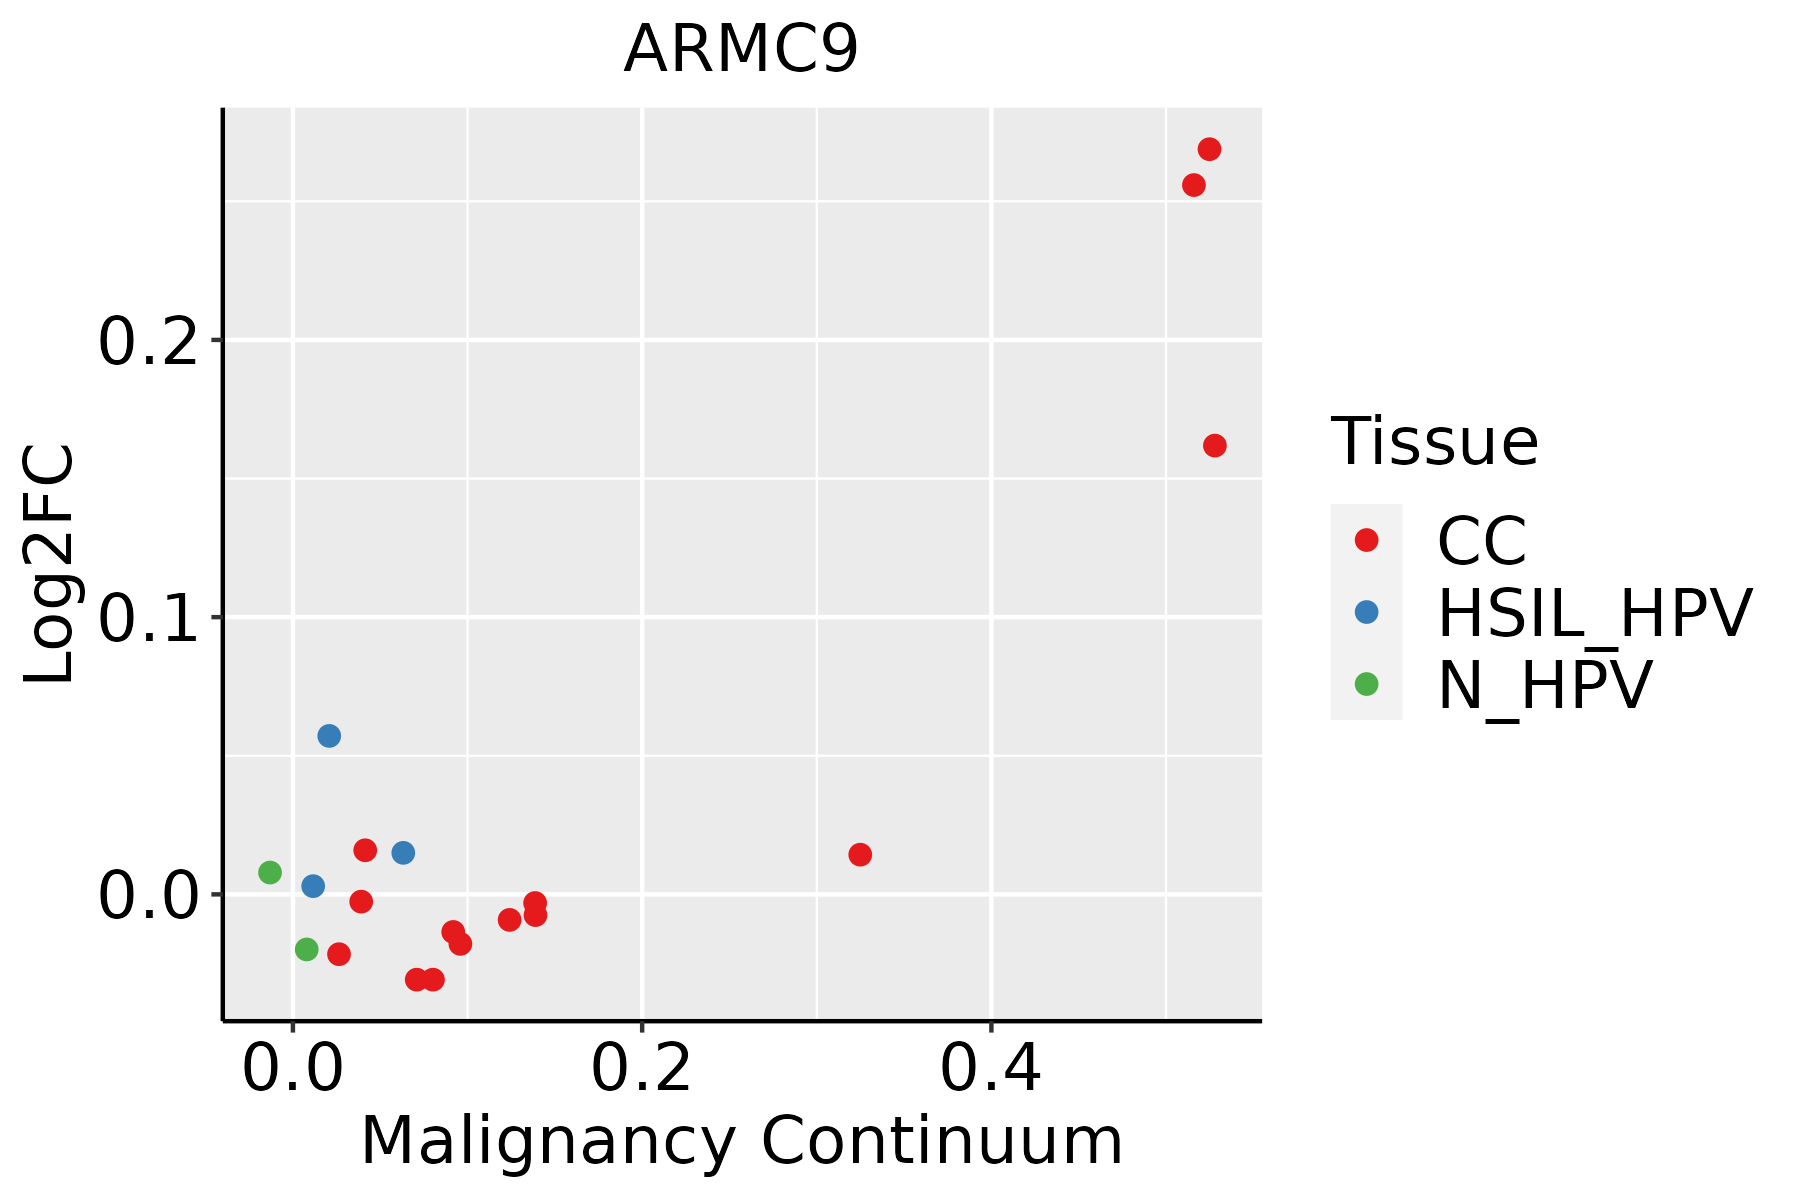 | CC: Cervix cancer |
| HSIL_HPV: HPV-infected high-grade squamous intraepithelial lesions | ||
| N_HPV: HPV-infected normal cervix | ||
| Colorectum (GSE201348) |  | FAP: Familial adenomatous polyposis |
| CRC: Colorectal cancer | ||
| Colorectum (HTA11) |  | AD: Adenomas |
| SER: Sessile serrated lesions | ||
| MSI-H: Microsatellite-high colorectal cancer | ||
| MSS: Microsatellite stable colorectal cancer | ||
| Liver |  | HCC: Hepatocellular carcinoma |
| NAFLD: Non-alcoholic fatty liver disease | ||
| Lung |  | AAH: Atypical adenomatous hyperplasia |
| AIS: Adenocarcinoma in situ | ||
| IAC: Invasive lung adenocarcinoma | ||
| MIA: Minimally invasive adenocarcinoma |
| ∗log2FC in expression of this searched gene in stem-like cells from each diseased tissue sample relative to stem-like cells in normal samples in each tissue plotted against the malignancy continuum. Samples are colored based on if they are from different disease stage. |
Top |
Malignant transformation related pathway analysis |
| Find out the enriched GO biological processes and KEGG pathways involved in transition from healthy to precancer to cancer |
| Tissue | Disease Stage | Enriched GO biological Processes |
| Colorectum | AD |  |
| Colorectum | SER |  |
| Colorectum | MSS |  |
| Colorectum | MSI-H |  |
| Colorectum | FAP |  |
| ∗Top 15 enriched GO BP terms are showed in the bar plot of each disease state in each tissue. Each row represents a significant GO biological process which is colored according to the -log10(p.adjust). |
| Page: 1 2 3 4 5 6 7 8 9 |
| GO ID | Tissue | Disease Stage | Description | Gene Ratio | Bg Ratio | pvalue | p.adjust | Count |
| GO:0060271 | Lung | IAC | cilium assembly | 55/2061 | 337/18723 | 1.84e-03 | 1.88e-02 | 55 |
| GO:0044782 | Lung | IAC | cilium organization | 58/2061 | 368/18723 | 3.15e-03 | 2.75e-02 | 58 |
| Page: 1 |
| Pathway ID | Tissue | Disease Stage | Description | Gene Ratio | Bg Ratio | pvalue | p.adjust | qvalue | Count |
| Page: 1 |
Top |
Cell-cell communication analysis |
| Identification of potential cell-cell interactions between two cell types and their ligand-receptor pairs for different disease states |
| Ligand | Receptor | LRpair | Pathway | Tissue | Disease Stage |
| Page: 1 |
Top |
Single-cell gene regulatory network inference analysis |
| Find out the significant the regulons (TFs) and the target genes of each regulon across cell types for different disease states |
| TF | Cell Type | Tissue | Disease Stage | Target Gene | RSS | Regulon Activity |
| ∗The dot plots of a searched regulon are shown for all cell subpopulations in each disease state of each tissue based on the regulon specific score inferred using pySCENIC and by calculating the average expression. |
| Page: 1 |
Top |
Somatic mutation of malignant transformation related genes |
| Annotation of somatic variants for genes involved in malignant transformation |
| Hugo Symbol | Variant Class | Variant Classification | dbSNP RS | HGVSc | HGVSp | HGVSp Short | SWISSPROT | BIOTYPE | SIFT | PolyPhen | Tumor Sample Barcode | Tissue | Histology | Sex | Age | Stage | Therapy Types | Drugs | Outcome |
| ARMC9 | SNV | Missense_Mutation | c.180N>T | p.Lys60Asn | p.K60N | protein_coding | tolerated(0.1) | benign(0.005) | TCGA-AN-A0AK-01 | Breast | breast invasive carcinoma | Female | >=65 | I/II | Unknown | Unknown | SD | ||
| ARMC9 | SNV | Missense_Mutation | novel | c.1649N>A | p.Cys550Tyr | p.C550Y | protein_coding | deleterious(0) | benign(0.295) | TCGA-B6-A0I8-01 | Breast | breast invasive carcinoma | Female | <65 | I/II | Unknown | Unknown | PD | |
| ARMC9 | SNV | Missense_Mutation | novel | c.2329N>A | p.Pro777Thr | p.P777T | protein_coding | tolerated_low_confidence(0.1) | benign(0.011) | TCGA-E9-A3HO-01 | Breast | breast invasive carcinoma | Female | <65 | I/II | Chemotherapy | cyclophosphamide | CR | |
| ARMC9 | SNV | Missense_Mutation | novel | c.2330N>A | p.Pro777Gln | p.P777Q | protein_coding | tolerated_low_confidence(0.08) | possibly_damaging(0.723) | TCGA-E9-A3HO-01 | Breast | breast invasive carcinoma | Female | <65 | I/II | Chemotherapy | cyclophosphamide | CR | |
| ARMC9 | SNV | Missense_Mutation | novel | c.2165N>G | p.Pro722Arg | p.P722R | protein_coding | tolerated(0.07) | possibly_damaging(0.578) | TCGA-S3-AA10-01 | Breast | breast invasive carcinoma | Female | >=65 | I/II | Chemotherapy | cytoxan | CR | |
| ARMC9 | insertion | Nonsense_Mutation | novel | c.442_443insAA | p.Phe148Ter | p.F148* | protein_coding | TCGA-A7-A26I-01 | Breast | breast invasive carcinoma | Female | >=65 | I/II | Chemotherapy | cytoxan | SD | |||
| ARMC9 | insertion | Frame_Shift_Ins | novel | c.443_444insGAGA | p.Phe148LeufsTer18 | p.F148Lfs*18 | protein_coding | TCGA-A7-A26I-01 | Breast | breast invasive carcinoma | Female | >=65 | I/II | Chemotherapy | cytoxan | SD | |||
| ARMC9 | insertion | Frame_Shift_Ins | novel | c.1175_1176insAA | p.Arg393ThrfsTer31 | p.R393Tfs*31 | protein_coding | TCGA-AR-A0U0-01 | Breast | breast invasive carcinoma | Female | >=65 | I/II | Unknown | Unknown | SD | |||
| ARMC9 | insertion | In_Frame_Ins | novel | c.1440_1441insAAACCAAAAGCTACAAATAAATATTTATTA | p.Val480_Ala481insLysProLysAlaThrAsnLysTyrLeuLeu | p.V480_A481insKPKATNKYLL | protein_coding | TCGA-B6-A0I5-01 | Breast | breast invasive carcinoma | Female | <65 | I/II | Unknown | Unknown | SD | |||
| ARMC9 | insertion | Frame_Shift_Ins | novel | c.1651_1652insTTCCAGAGTTCTTCCTCCCTTCCAGATTG | p.Ile552ProfsTer18 | p.I552Pfs*18 | protein_coding | TCGA-B6-A0I8-01 | Breast | breast invasive carcinoma | Female | <65 | I/II | Unknown | Unknown | PD |
| Page: 1 2 3 4 5 6 7 |
Top |
Related drugs of malignant transformation related genes |
| Identification of chemicals and drugs interact with genes involved in malignant transfromation |
| (DGIdb 4.0) |
| Entrez ID | Symbol | Category | Interaction Types | Drug Claim Name | Drug Name | PMIDs |
| Page: 1 |

Copyright 2023-Present -The University of Texas Health Science Center at Houston |