
|
|||||
|
 | |
| |
| |
| |
| |
| |
|
Gene: ARMC8 |
Gene summary for ARMC8 |
| Gene information | Species | Human | Gene symbol | ARMC8 | Gene ID | 25852 |
| Gene name | armadillo repeat containing 8 | |
| Gene Alias | GID5 | |
| Cytomap | 3q22.3 | |
| Gene Type | protein-coding | GO ID | GO:0006508 | UniProtAcc | B7Z637 |
Top |
Malignant transformation analysis |
| Identification of the aberrant gene expression in precancerous and cancerous lesions by comparing the gene expression of stem-like cells in diseased tissues with normal stem cells |
| Entrez ID | Symbol | Replicates | Species | Organ | Tissue | Adj P-value | Log2FC | Malignancy |
| 25852 | ARMC8 | CCI_1 | Human | Cervix | CC | 3.14e-04 | 5.11e-01 | 0.528 |
| 25852 | ARMC8 | CCI_2 | Human | Cervix | CC | 7.06e-21 | 1.40e+00 | 0.5249 |
| 25852 | ARMC8 | CCI_3 | Human | Cervix | CC | 1.82e-08 | 6.18e-01 | 0.516 |
| 25852 | ARMC8 | HTA11_3410_2000001011 | Human | Colorectum | AD | 3.77e-12 | -5.00e-01 | 0.0155 |
| 25852 | ARMC8 | HTA11_3361_2000001011 | Human | Colorectum | AD | 2.64e-03 | -4.82e-01 | -0.1207 |
| 25852 | ARMC8 | HTA11_696_2000001011 | Human | Colorectum | AD | 4.87e-04 | -3.70e-01 | -0.1464 |
| 25852 | ARMC8 | HTA11_866_3004761011 | Human | Colorectum | AD | 2.62e-06 | -4.45e-01 | 0.096 |
| 25852 | ARMC8 | HTA11_9408_2000001011 | Human | Colorectum | AD | 2.99e-02 | -6.28e-01 | 0.0451 |
| 25852 | ARMC8 | HTA11_7696_3000711011 | Human | Colorectum | AD | 1.86e-10 | -4.36e-01 | 0.0674 |
| 25852 | ARMC8 | HTA11_99999970781_79442 | Human | Colorectum | MSS | 1.02e-02 | -3.07e-01 | 0.294 |
| 25852 | ARMC8 | HTA11_99999971662_82457 | Human | Colorectum | MSS | 4.24e-06 | -4.04e-01 | 0.3859 |
| 25852 | ARMC8 | HTA11_99999974143_84620 | Human | Colorectum | MSS | 1.59e-16 | -5.11e-01 | 0.3005 |
| 25852 | ARMC8 | F007 | Human | Colorectum | FAP | 2.24e-02 | -2.87e-01 | 0.1176 |
| 25852 | ARMC8 | A001-C-207 | Human | Colorectum | FAP | 2.18e-04 | -2.82e-01 | 0.1278 |
| 25852 | ARMC8 | A015-C-203 | Human | Colorectum | FAP | 1.09e-24 | -4.76e-01 | -0.1294 |
| 25852 | ARMC8 | A015-C-204 | Human | Colorectum | FAP | 5.57e-06 | -3.07e-01 | -0.0228 |
| 25852 | ARMC8 | A014-C-040 | Human | Colorectum | FAP | 1.71e-05 | -5.24e-01 | -0.1184 |
| 25852 | ARMC8 | A002-C-201 | Human | Colorectum | FAP | 9.40e-14 | -3.44e-01 | 0.0324 |
| 25852 | ARMC8 | A002-C-203 | Human | Colorectum | FAP | 1.40e-03 | -2.21e-01 | 0.2786 |
| 25852 | ARMC8 | A001-C-119 | Human | Colorectum | FAP | 6.97e-10 | -4.27e-01 | -0.1557 |
| Page: 1 2 3 4 5 6 7 |
| Tissue | Expression Dynamics | Abbreviation |
| Cervix | 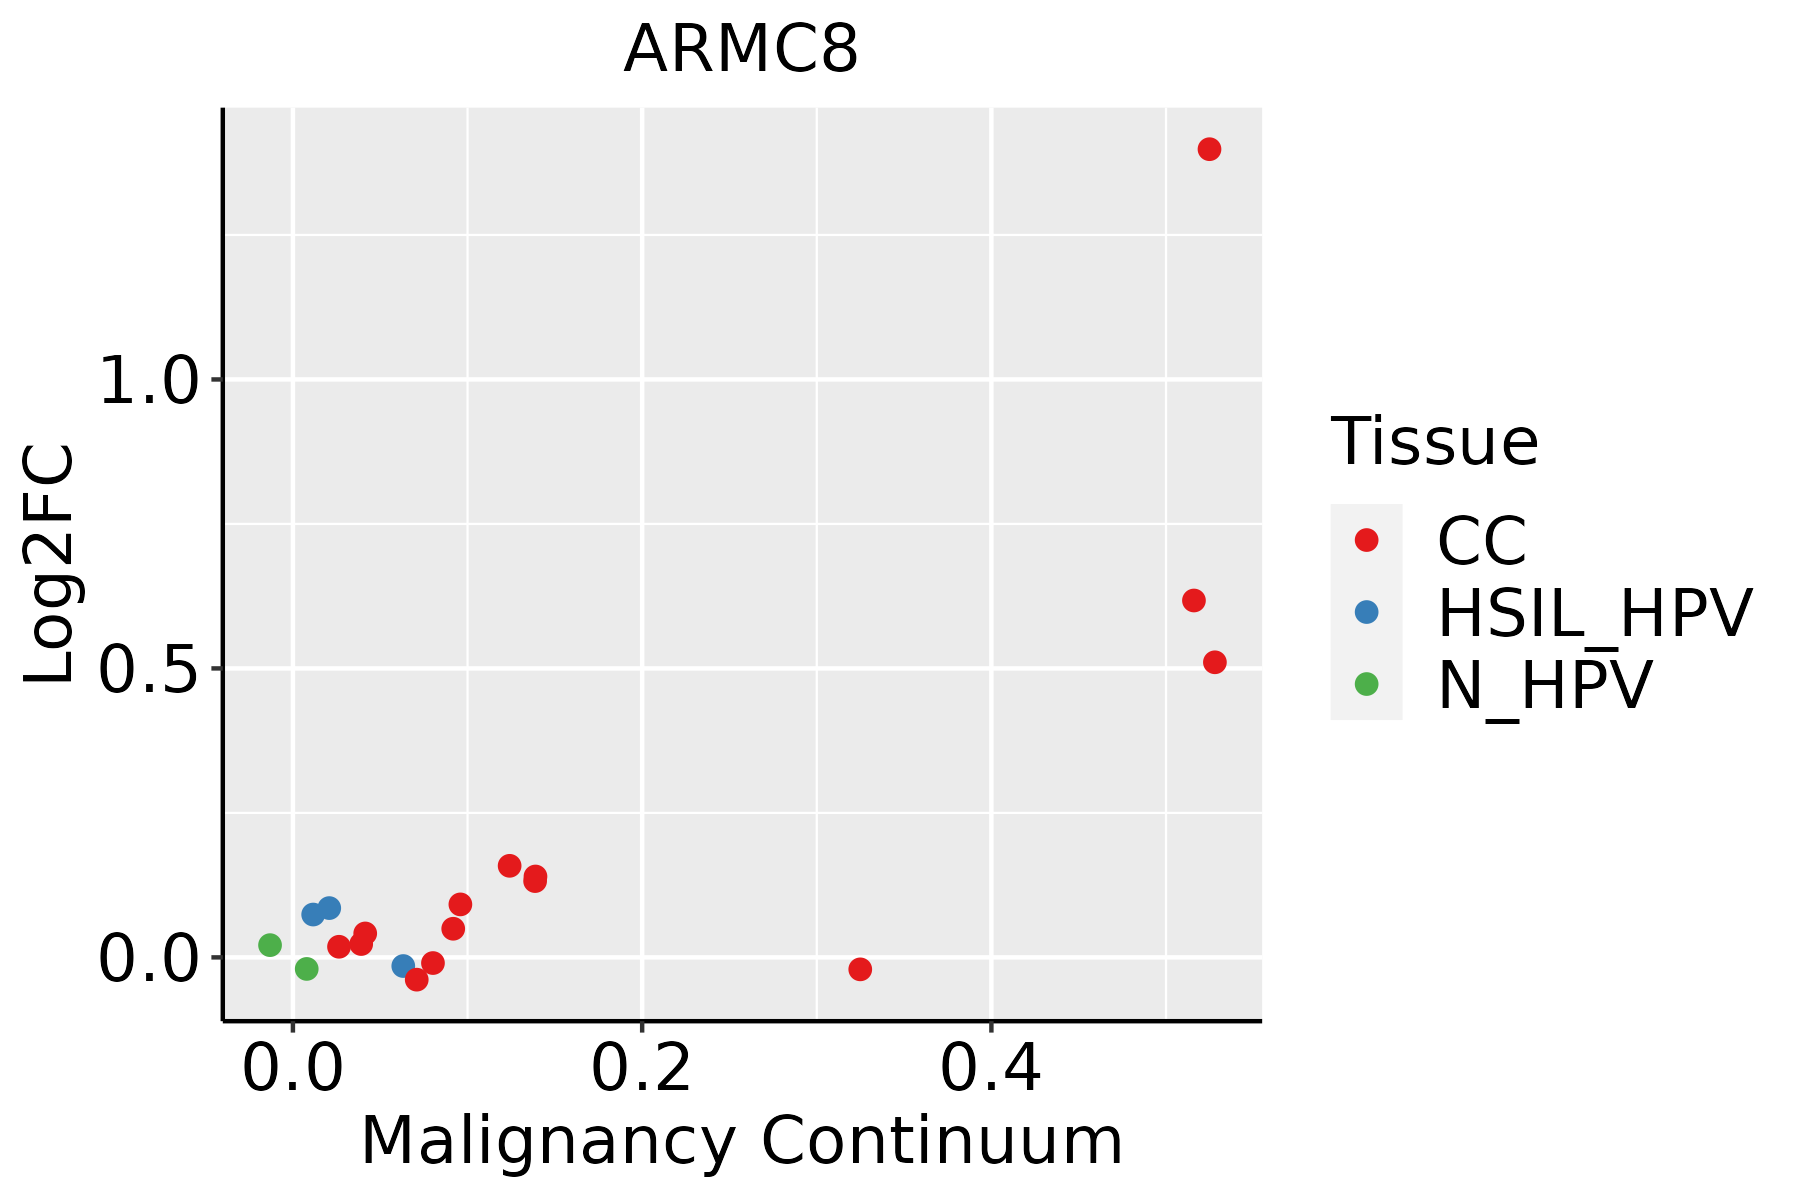 | CC: Cervix cancer |
| HSIL_HPV: HPV-infected high-grade squamous intraepithelial lesions | ||
| N_HPV: HPV-infected normal cervix | ||
| Colorectum (GSE201348) |  | FAP: Familial adenomatous polyposis |
| CRC: Colorectal cancer | ||
| Colorectum (HTA11) |  | AD: Adenomas |
| SER: Sessile serrated lesions | ||
| MSI-H: Microsatellite-high colorectal cancer | ||
| MSS: Microsatellite stable colorectal cancer | ||
| Esophagus | 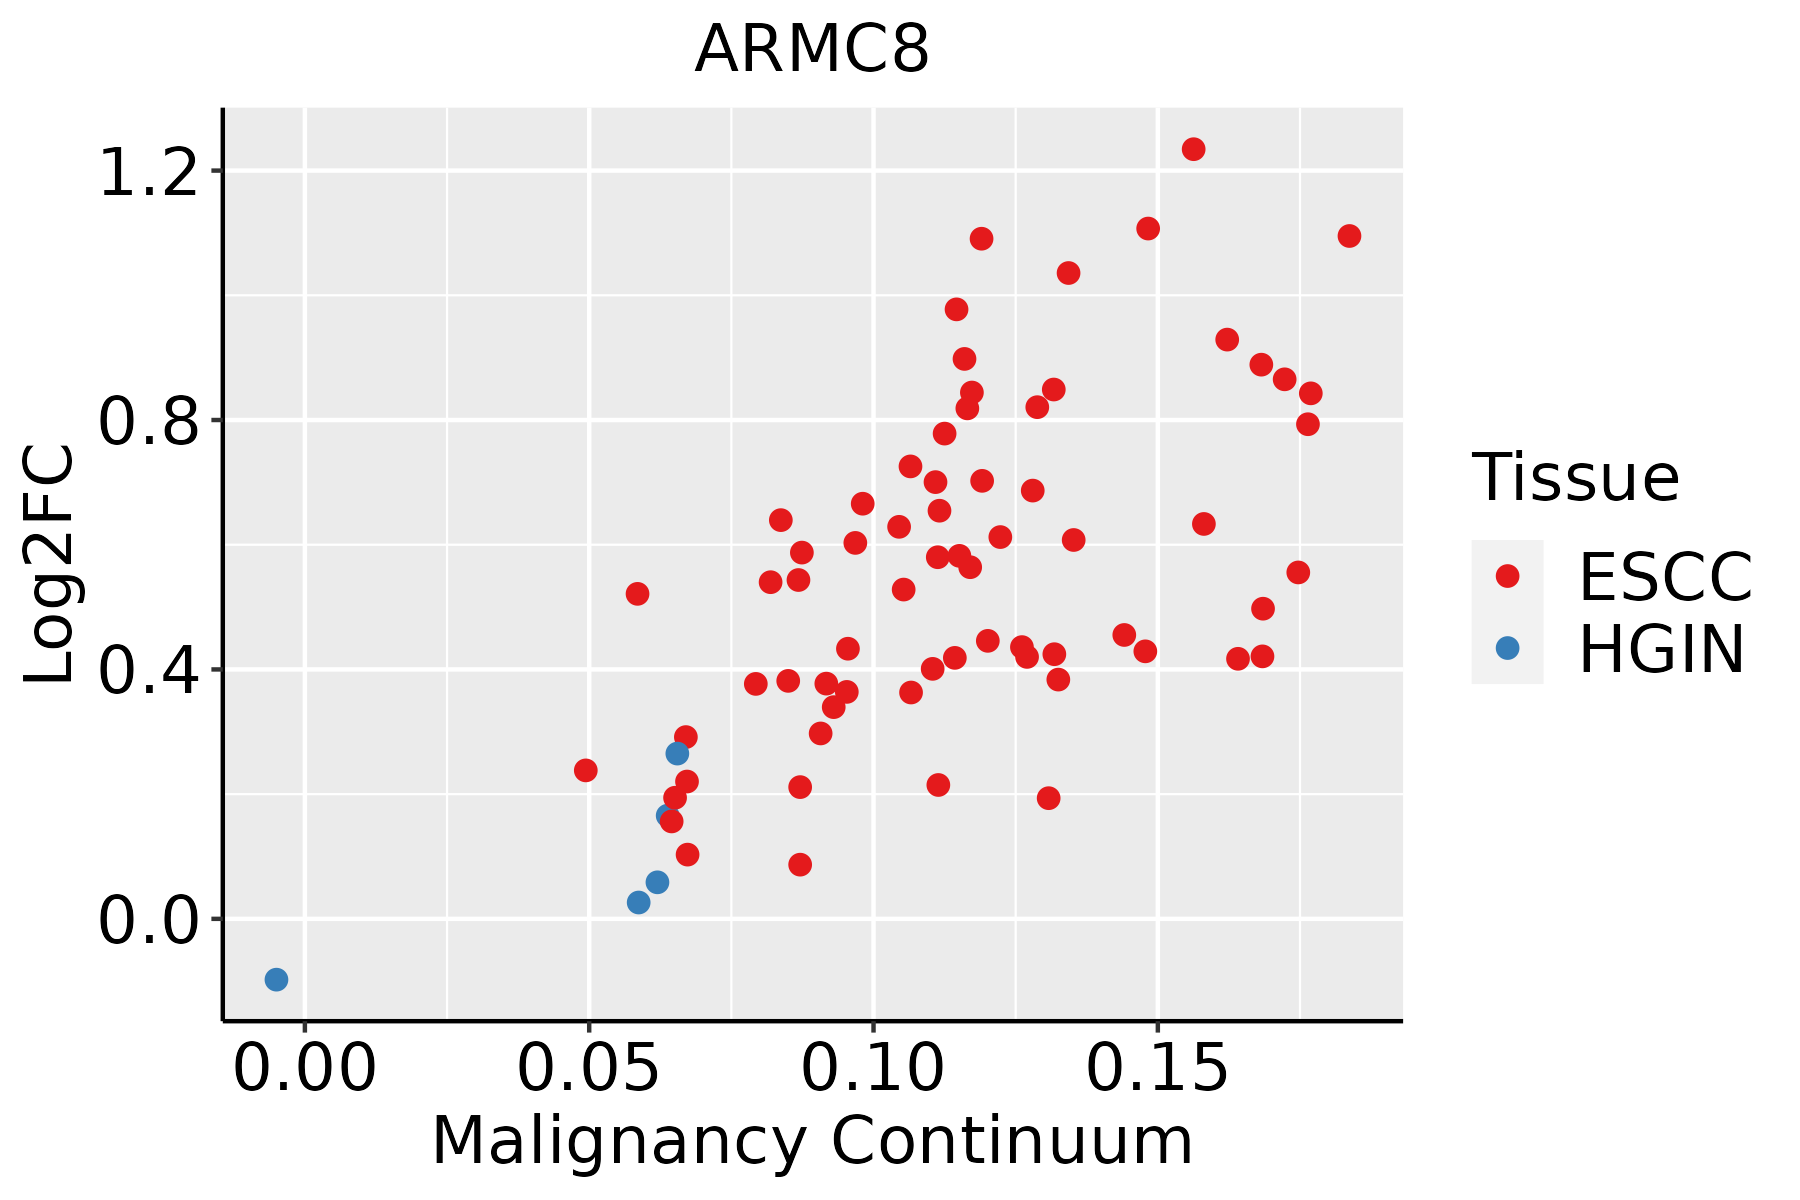 | ESCC: Esophageal squamous cell carcinoma |
| HGIN: High-grade intraepithelial neoplasias | ||
| LGIN: Low-grade intraepithelial neoplasias | ||
| Liver | 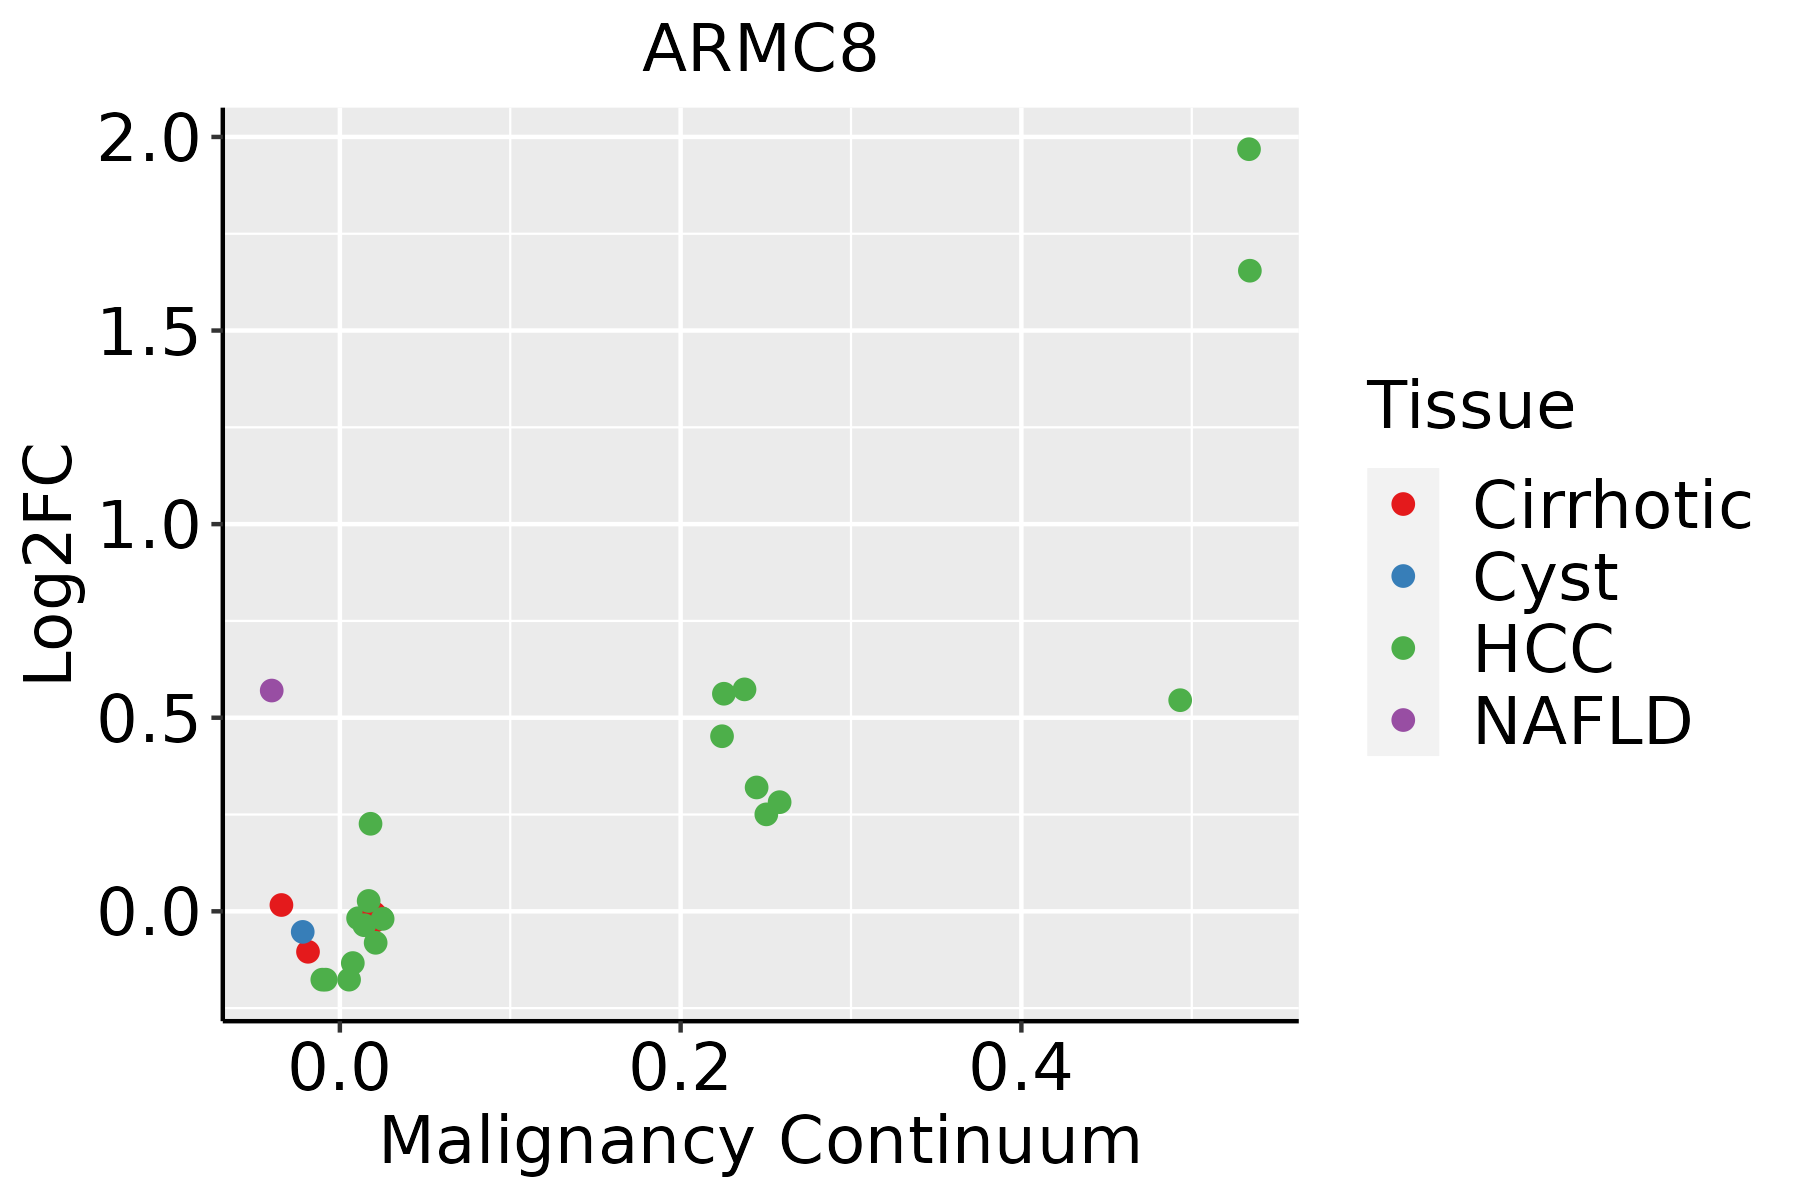 | HCC: Hepatocellular carcinoma |
| NAFLD: Non-alcoholic fatty liver disease | ||
| Oral Cavity |  | EOLP: Erosive Oral lichen planus |
| LP: leukoplakia | ||
| NEOLP: Non-erosive oral lichen planus | ||
| OSCC: Oral squamous cell carcinoma |
| ∗log2FC in expression of this searched gene in stem-like cells from each diseased tissue sample relative to stem-like cells in normal samples in each tissue plotted against the malignancy continuum. Samples are colored based on if they are from different disease stage. |
Top |
Malignant transformation related pathway analysis |
| Find out the enriched GO biological processes and KEGG pathways involved in transition from healthy to precancer to cancer |
| Tissue | Disease Stage | Enriched GO biological Processes |
| Colorectum | AD |  |
| Colorectum | SER |  |
| Colorectum | MSS |  |
| Colorectum | MSI-H |  |
| Colorectum | FAP |  |
| ∗Top 15 enriched GO BP terms are showed in the bar plot of each disease state in each tissue. Each row represents a significant GO biological process which is colored according to the -log10(p.adjust). |
| Page: 1 2 3 4 5 6 7 8 9 |
| GO ID | Tissue | Disease Stage | Description | Gene Ratio | Bg Ratio | pvalue | p.adjust | Count |
| GO:001049810 | Cervix | CC | proteasomal protein catabolic process | 111/2311 | 490/18723 | 8.98e-11 | 1.58e-08 | 111 |
| GO:004316110 | Cervix | CC | proteasome-mediated ubiquitin-dependent protein catabolic process | 91/2311 | 412/18723 | 1.65e-08 | 1.25e-06 | 91 |
| GO:0010498 | Colorectum | AD | proteasomal protein catabolic process | 174/3918 | 490/18723 | 3.18e-14 | 7.66e-12 | 174 |
| GO:0043161 | Colorectum | AD | proteasome-mediated ubiquitin-dependent protein catabolic process | 141/3918 | 412/18723 | 1.77e-10 | 1.68e-08 | 141 |
| GO:00104982 | Colorectum | MSS | proteasomal protein catabolic process | 157/3467 | 490/18723 | 2.39e-13 | 5.25e-11 | 157 |
| GO:00431612 | Colorectum | MSS | proteasome-mediated ubiquitin-dependent protein catabolic process | 127/3467 | 412/18723 | 7.70e-10 | 6.32e-08 | 127 |
| GO:00431614 | Colorectum | FAP | proteasome-mediated ubiquitin-dependent protein catabolic process | 98/2622 | 412/18723 | 5.41e-08 | 4.20e-06 | 98 |
| GO:00104984 | Colorectum | FAP | proteasomal protein catabolic process | 110/2622 | 490/18723 | 2.12e-07 | 1.26e-05 | 110 |
| GO:00431615 | Colorectum | CRC | proteasome-mediated ubiquitin-dependent protein catabolic process | 69/2078 | 412/18723 | 3.16e-04 | 4.90e-03 | 69 |
| GO:00104985 | Colorectum | CRC | proteasomal protein catabolic process | 77/2078 | 490/18723 | 1.03e-03 | 1.21e-02 | 77 |
| GO:0010498111 | Esophagus | ESCC | proteasomal protein catabolic process | 369/8552 | 490/18723 | 1.13e-41 | 1.80e-38 | 369 |
| GO:0043161111 | Esophagus | ESCC | proteasome-mediated ubiquitin-dependent protein catabolic process | 312/8552 | 412/18723 | 3.53e-36 | 4.48e-33 | 312 |
| GO:00431617 | Liver | NAFLD | proteasome-mediated ubiquitin-dependent protein catabolic process | 91/1882 | 412/18723 | 3.00e-13 | 1.75e-10 | 91 |
| GO:00104987 | Liver | NAFLD | proteasomal protein catabolic process | 101/1882 | 490/18723 | 1.35e-12 | 6.09e-10 | 101 |
| GO:001049822 | Liver | HCC | proteasomal protein catabolic process | 351/7958 | 490/18723 | 6.92e-40 | 1.46e-36 | 351 |
| GO:004316122 | Liver | HCC | proteasome-mediated ubiquitin-dependent protein catabolic process | 299/7958 | 412/18723 | 7.82e-36 | 8.27e-33 | 299 |
| GO:001049820 | Oral cavity | OSCC | proteasomal protein catabolic process | 336/7305 | 490/18723 | 5.45e-41 | 8.63e-38 | 336 |
| GO:004316120 | Oral cavity | OSCC | proteasome-mediated ubiquitin-dependent protein catabolic process | 285/7305 | 412/18723 | 5.68e-36 | 5.99e-33 | 285 |
| GO:0010498110 | Oral cavity | LP | proteasomal protein catabolic process | 224/4623 | 490/18723 | 9.57e-25 | 4.00e-22 | 224 |
| GO:0043161110 | Oral cavity | LP | proteasome-mediated ubiquitin-dependent protein catabolic process | 190/4623 | 412/18723 | 1.08e-21 | 2.93e-19 | 190 |
| Page: 1 |
| Pathway ID | Tissue | Disease Stage | Description | Gene Ratio | Bg Ratio | pvalue | p.adjust | qvalue | Count |
| Page: 1 |
Top |
Cell-cell communication analysis |
| Identification of potential cell-cell interactions between two cell types and their ligand-receptor pairs for different disease states |
| Ligand | Receptor | LRpair | Pathway | Tissue | Disease Stage |
| Page: 1 |
Top |
Single-cell gene regulatory network inference analysis |
| Find out the significant the regulons (TFs) and the target genes of each regulon across cell types for different disease states |
| TF | Cell Type | Tissue | Disease Stage | Target Gene | RSS | Regulon Activity |
| ∗The dot plots of a searched regulon are shown for all cell subpopulations in each disease state of each tissue based on the regulon specific score inferred using pySCENIC and by calculating the average expression. |
| Page: 1 |
Top |
Somatic mutation of malignant transformation related genes |
| Annotation of somatic variants for genes involved in malignant transformation |
| Hugo Symbol | Variant Class | Variant Classification | dbSNP RS | HGVSc | HGVSp | HGVSp Short | SWISSPROT | BIOTYPE | SIFT | PolyPhen | Tumor Sample Barcode | Tissue | Histology | Sex | Age | Stage | Therapy Types | Drugs | Outcome |
| ARMC8 | SNV | Missense_Mutation | c.1237N>C | p.Val413Leu | p.V413L | Q8IUR7 | protein_coding | tolerated(0.05) | possibly_damaging(0.813) | TCGA-A2-A0T0-01 | Breast | breast invasive carcinoma | Female | <65 | I/II | Chemotherapy | taxotere | SD | |
| ARMC8 | SNV | Missense_Mutation | rs758427027 | c.439N>T | p.Arg147Cys | p.R147C | Q8IUR7 | protein_coding | tolerated(0.18) | benign(0.172) | TCGA-AN-A0AK-01 | Breast | breast invasive carcinoma | Female | >=65 | I/II | Unknown | Unknown | SD |
| ARMC8 | SNV | Missense_Mutation | c.1210N>G | p.Leu404Val | p.L404V | Q8IUR7 | protein_coding | deleterious(0.02) | probably_damaging(0.911) | TCGA-AR-A0U0-01 | Breast | breast invasive carcinoma | Female | >=65 | I/II | Unknown | Unknown | SD | |
| ARMC8 | SNV | Missense_Mutation | novel | c.1837T>A | p.Trp613Arg | p.W613R | Q8IUR7 | protein_coding | tolerated(0.17) | benign(0.037) | TCGA-BH-A18U-01 | Breast | breast invasive carcinoma | Female | >=65 | III/IV | Unknown | Unknown | SD |
| ARMC8 | insertion | Frame_Shift_Ins | novel | c.1211_1212insTAAATATA | p.Arg405LysfsTer16 | p.R405Kfs*16 | Q8IUR7 | protein_coding | TCGA-AR-A0U0-01 | Breast | breast invasive carcinoma | Female | >=65 | I/II | Unknown | Unknown | SD | ||
| ARMC8 | SNV | Missense_Mutation | c.1214N>A | p.Arg405Gln | p.R405Q | Q8IUR7 | protein_coding | deleterious(0.03) | probably_damaging(0.979) | TCGA-LP-A4AV-01 | Cervix | cervical & endocervical cancer | Female | <65 | I/II | Unknown | Unknown | SD | |
| ARMC8 | SNV | Missense_Mutation | c.1498N>A | p.Glu500Lys | p.E500K | Q8IUR7 | protein_coding | tolerated(0.2) | possibly_damaging(0.497) | TCGA-LP-A4AV-01 | Cervix | cervical & endocervical cancer | Female | <65 | I/II | Unknown | Unknown | SD | |
| ARMC8 | SNV | Missense_Mutation | novel | c.1099N>C | p.Glu367Gln | p.E367Q | Q8IUR7 | protein_coding | tolerated(0.05) | possibly_damaging(0.837) | TCGA-UC-A7PG-06 | Cervix | cervical & endocervical cancer | Female | <65 | III/IV | Chemotherapy | cisplatin | PD |
| ARMC8 | SNV | Missense_Mutation | novel | c.346N>T | p.Arg116Cys | p.R116C | Q8IUR7 | protein_coding | deleterious(0.05) | benign(0.347) | TCGA-AA-3947-01 | Colorectum | colon adenocarcinoma | Female | <65 | I/II | Unknown | Unknown | SD |
| ARMC8 | SNV | Missense_Mutation | c.23N>A | p.Arg8His | p.R8H | Q8IUR7 | protein_coding | deleterious(0) | probably_damaging(0.951) | TCGA-AA-3984-01 | Colorectum | colon adenocarcinoma | Female | <65 | I/II | Unknown | Unknown | SD |
| Page: 1 2 3 4 5 6 7 |
Top |
Related drugs of malignant transformation related genes |
| Identification of chemicals and drugs interact with genes involved in malignant transfromation |
| (DGIdb 4.0) |
| Entrez ID | Symbol | Category | Interaction Types | Drug Claim Name | Drug Name | PMIDs |
| Page: 1 |

Copyright 2023-Present -The University of Texas Health Science Center at Houston |