
|
|||||
|
 | |
| |
| |
| |
| |
| |
|
Gene: ARMC1 |
Gene summary for ARMC1 |
| Gene information | Species | Human | Gene symbol | ARMC1 | Gene ID | 55156 |
| Gene name | armadillo repeat containing 1 | |
| Gene Alias | Arcp | |
| Cytomap | 8q13.1 | |
| Gene Type | protein-coding | GO ID | GO:0006996 | UniProtAcc | Q9NVT9 |
Top |
Malignant transformation analysis |
| Identification of the aberrant gene expression in precancerous and cancerous lesions by comparing the gene expression of stem-like cells in diseased tissues with normal stem cells |
| Entrez ID | Symbol | Replicates | Species | Organ | Tissue | Adj P-value | Log2FC | Malignancy |
| 55156 | ARMC1 | LZE4T | Human | Esophagus | ESCC | 3.98e-09 | 3.88e-01 | 0.0811 |
| 55156 | ARMC1 | LZE8T | Human | Esophagus | ESCC | 5.79e-03 | 1.94e-01 | 0.067 |
| 55156 | ARMC1 | LZE20T | Human | Esophagus | ESCC | 1.82e-02 | 2.19e-01 | 0.0662 |
| 55156 | ARMC1 | LZE24T | Human | Esophagus | ESCC | 1.59e-24 | 5.36e-01 | 0.0596 |
| 55156 | ARMC1 | LZE21T | Human | Esophagus | ESCC | 6.57e-04 | 3.05e-01 | 0.0655 |
| 55156 | ARMC1 | LZE6T | Human | Esophagus | ESCC | 6.26e-06 | 3.08e-01 | 0.0845 |
| 55156 | ARMC1 | P2T-E | Human | Esophagus | ESCC | 4.04e-32 | 6.72e-01 | 0.1177 |
| 55156 | ARMC1 | P4T-E | Human | Esophagus | ESCC | 2.24e-33 | 8.20e-01 | 0.1323 |
| 55156 | ARMC1 | P5T-E | Human | Esophagus | ESCC | 5.37e-13 | 2.51e-01 | 0.1327 |
| 55156 | ARMC1 | P8T-E | Human | Esophagus | ESCC | 4.10e-13 | 3.38e-01 | 0.0889 |
| 55156 | ARMC1 | P9T-E | Human | Esophagus | ESCC | 2.13e-10 | 1.63e-01 | 0.1131 |
| 55156 | ARMC1 | P10T-E | Human | Esophagus | ESCC | 4.98e-19 | 4.41e-01 | 0.116 |
| 55156 | ARMC1 | P11T-E | Human | Esophagus | ESCC | 4.29e-09 | 4.71e-01 | 0.1426 |
| 55156 | ARMC1 | P12T-E | Human | Esophagus | ESCC | 2.22e-26 | 6.16e-01 | 0.1122 |
| 55156 | ARMC1 | P15T-E | Human | Esophagus | ESCC | 1.31e-18 | 4.28e-01 | 0.1149 |
| 55156 | ARMC1 | P16T-E | Human | Esophagus | ESCC | 1.18e-47 | 1.00e+00 | 0.1153 |
| 55156 | ARMC1 | P17T-E | Human | Esophagus | ESCC | 6.18e-08 | 4.82e-01 | 0.1278 |
| 55156 | ARMC1 | P19T-E | Human | Esophagus | ESCC | 1.25e-05 | 3.88e-01 | 0.1662 |
| 55156 | ARMC1 | P20T-E | Human | Esophagus | ESCC | 4.90e-22 | 4.05e-01 | 0.1124 |
| 55156 | ARMC1 | P21T-E | Human | Esophagus | ESCC | 2.84e-29 | 7.38e-01 | 0.1617 |
| Page: 1 2 3 4 5 6 |
| Tissue | Expression Dynamics | Abbreviation |
| Esophagus | 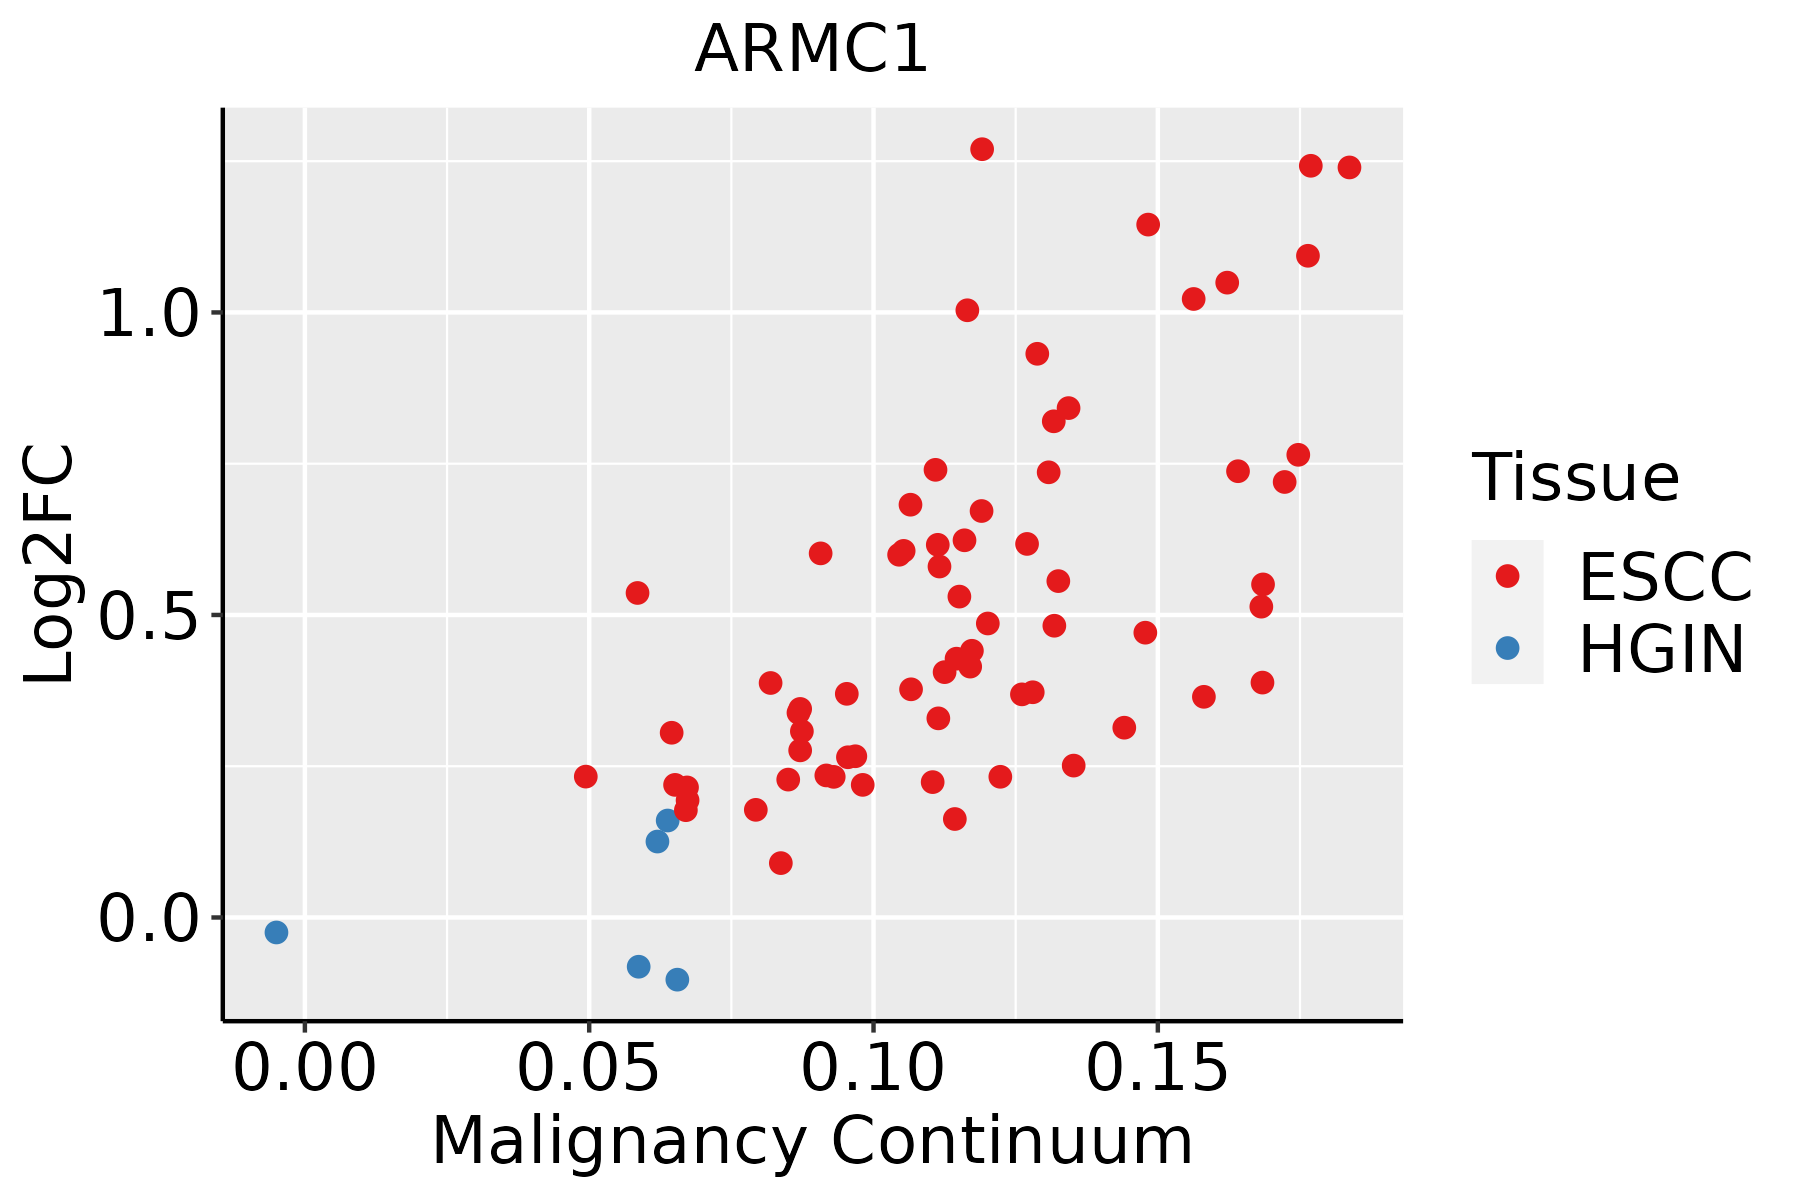 | ESCC: Esophageal squamous cell carcinoma |
| HGIN: High-grade intraepithelial neoplasias | ||
| LGIN: Low-grade intraepithelial neoplasias | ||
| Liver | 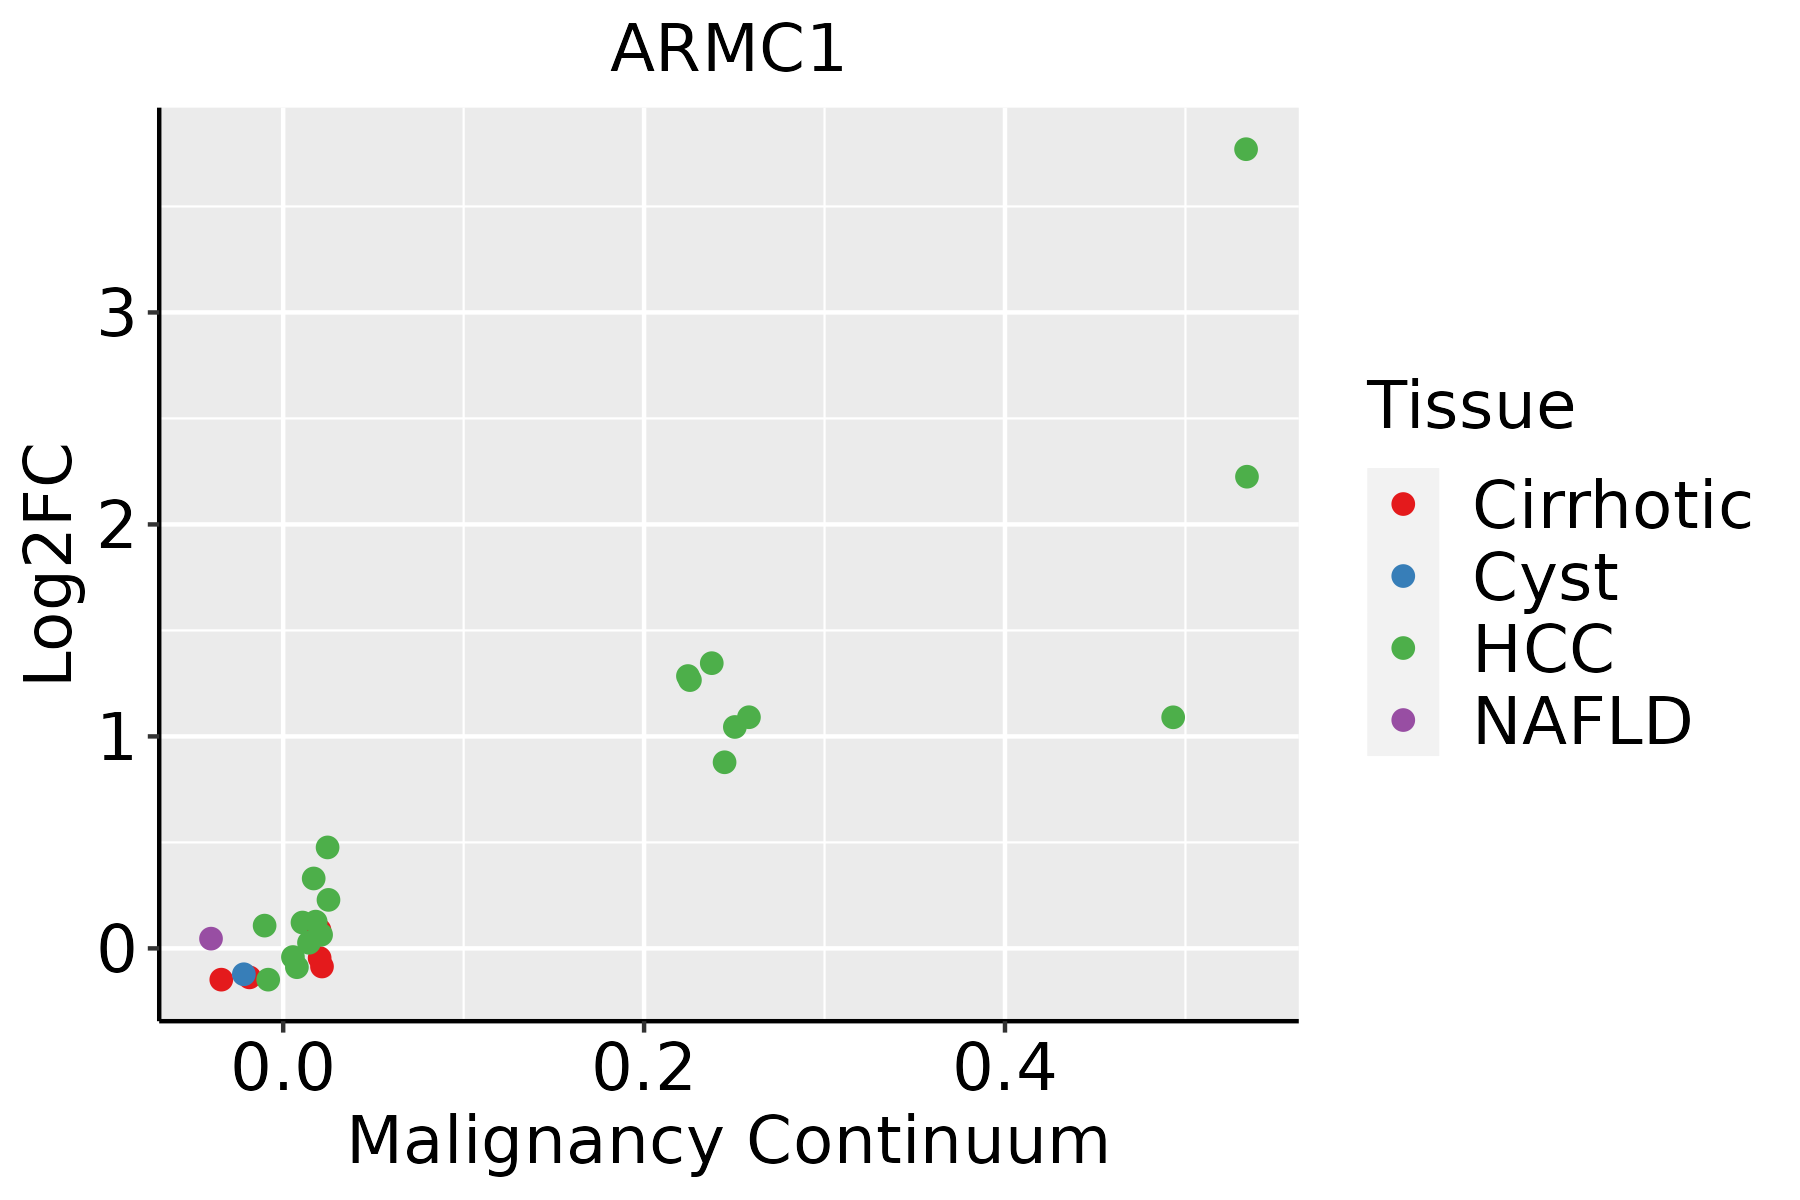 | HCC: Hepatocellular carcinoma |
| NAFLD: Non-alcoholic fatty liver disease | ||
| Oral Cavity | 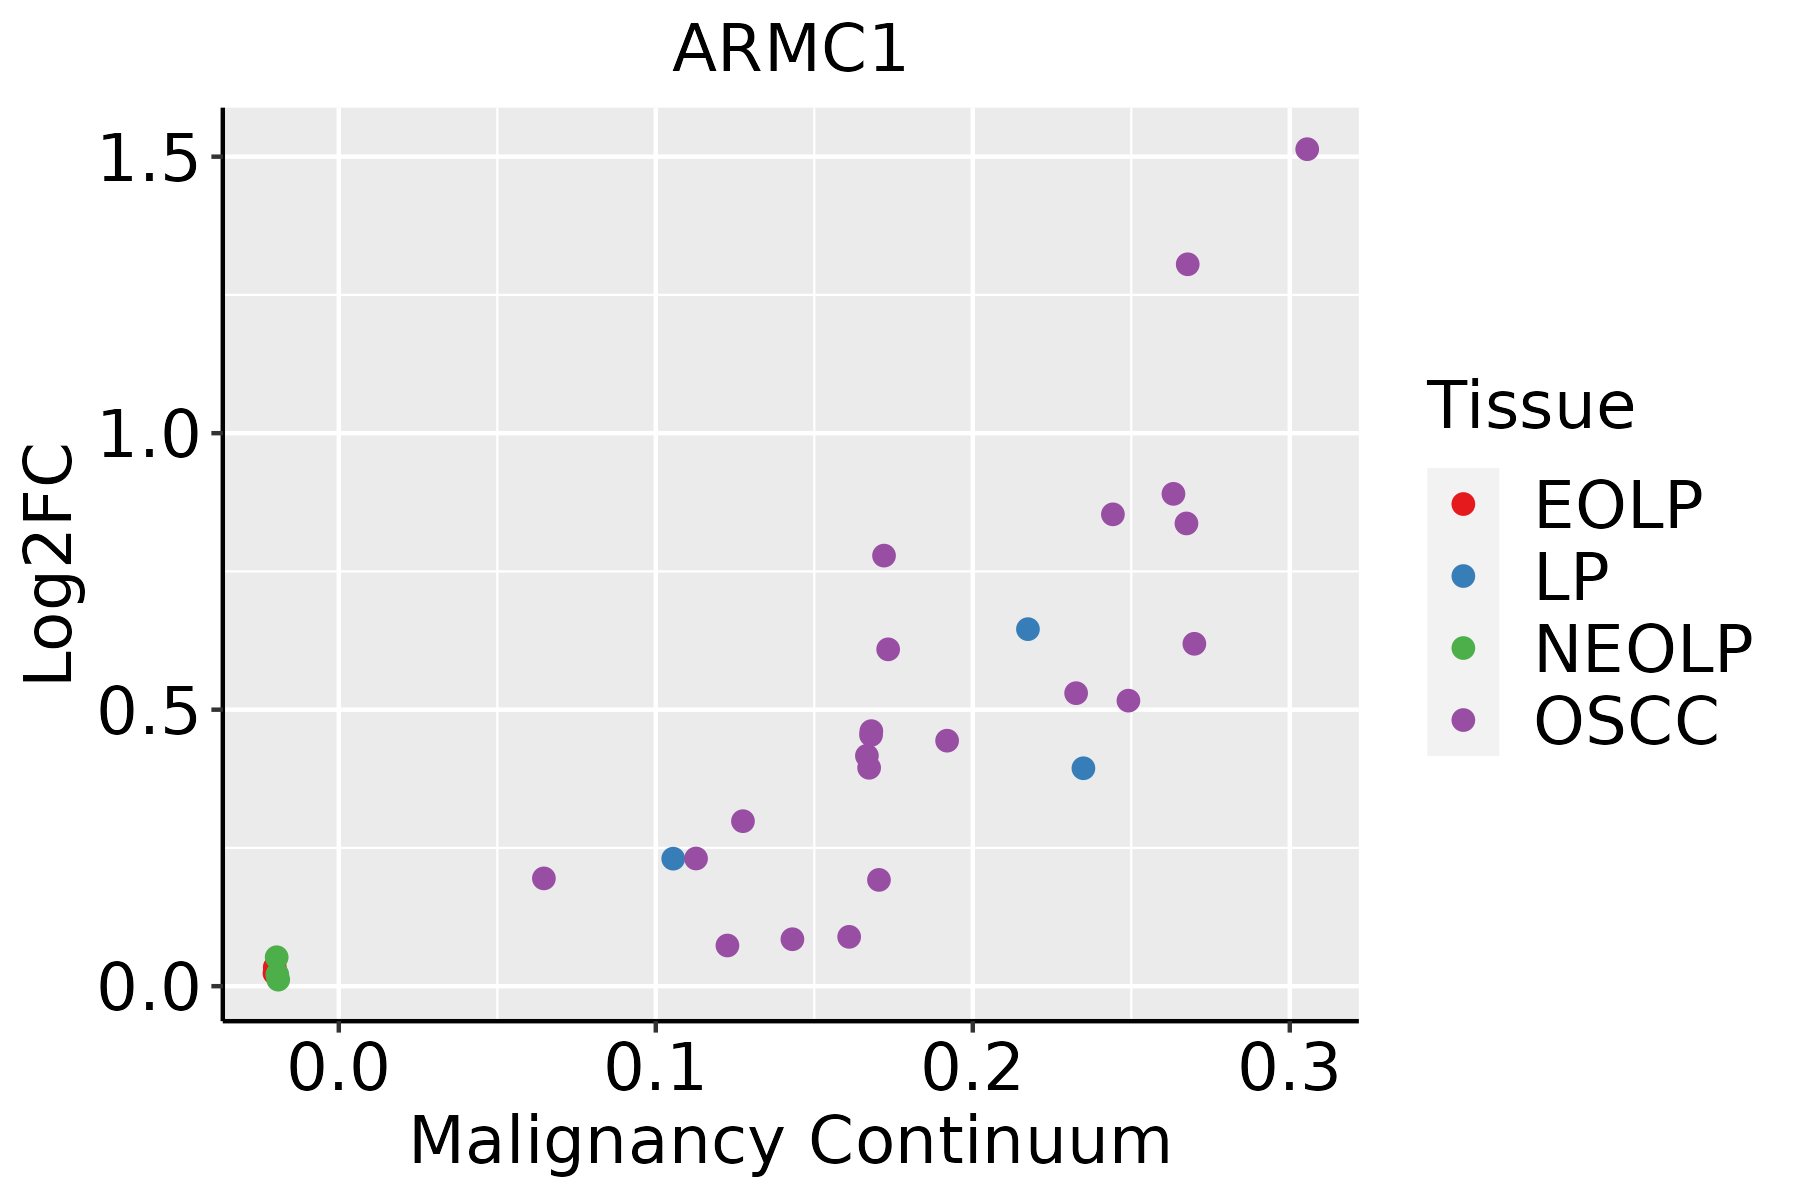 | EOLP: Erosive Oral lichen planus |
| LP: leukoplakia | ||
| NEOLP: Non-erosive oral lichen planus | ||
| OSCC: Oral squamous cell carcinoma | ||
| Skin | 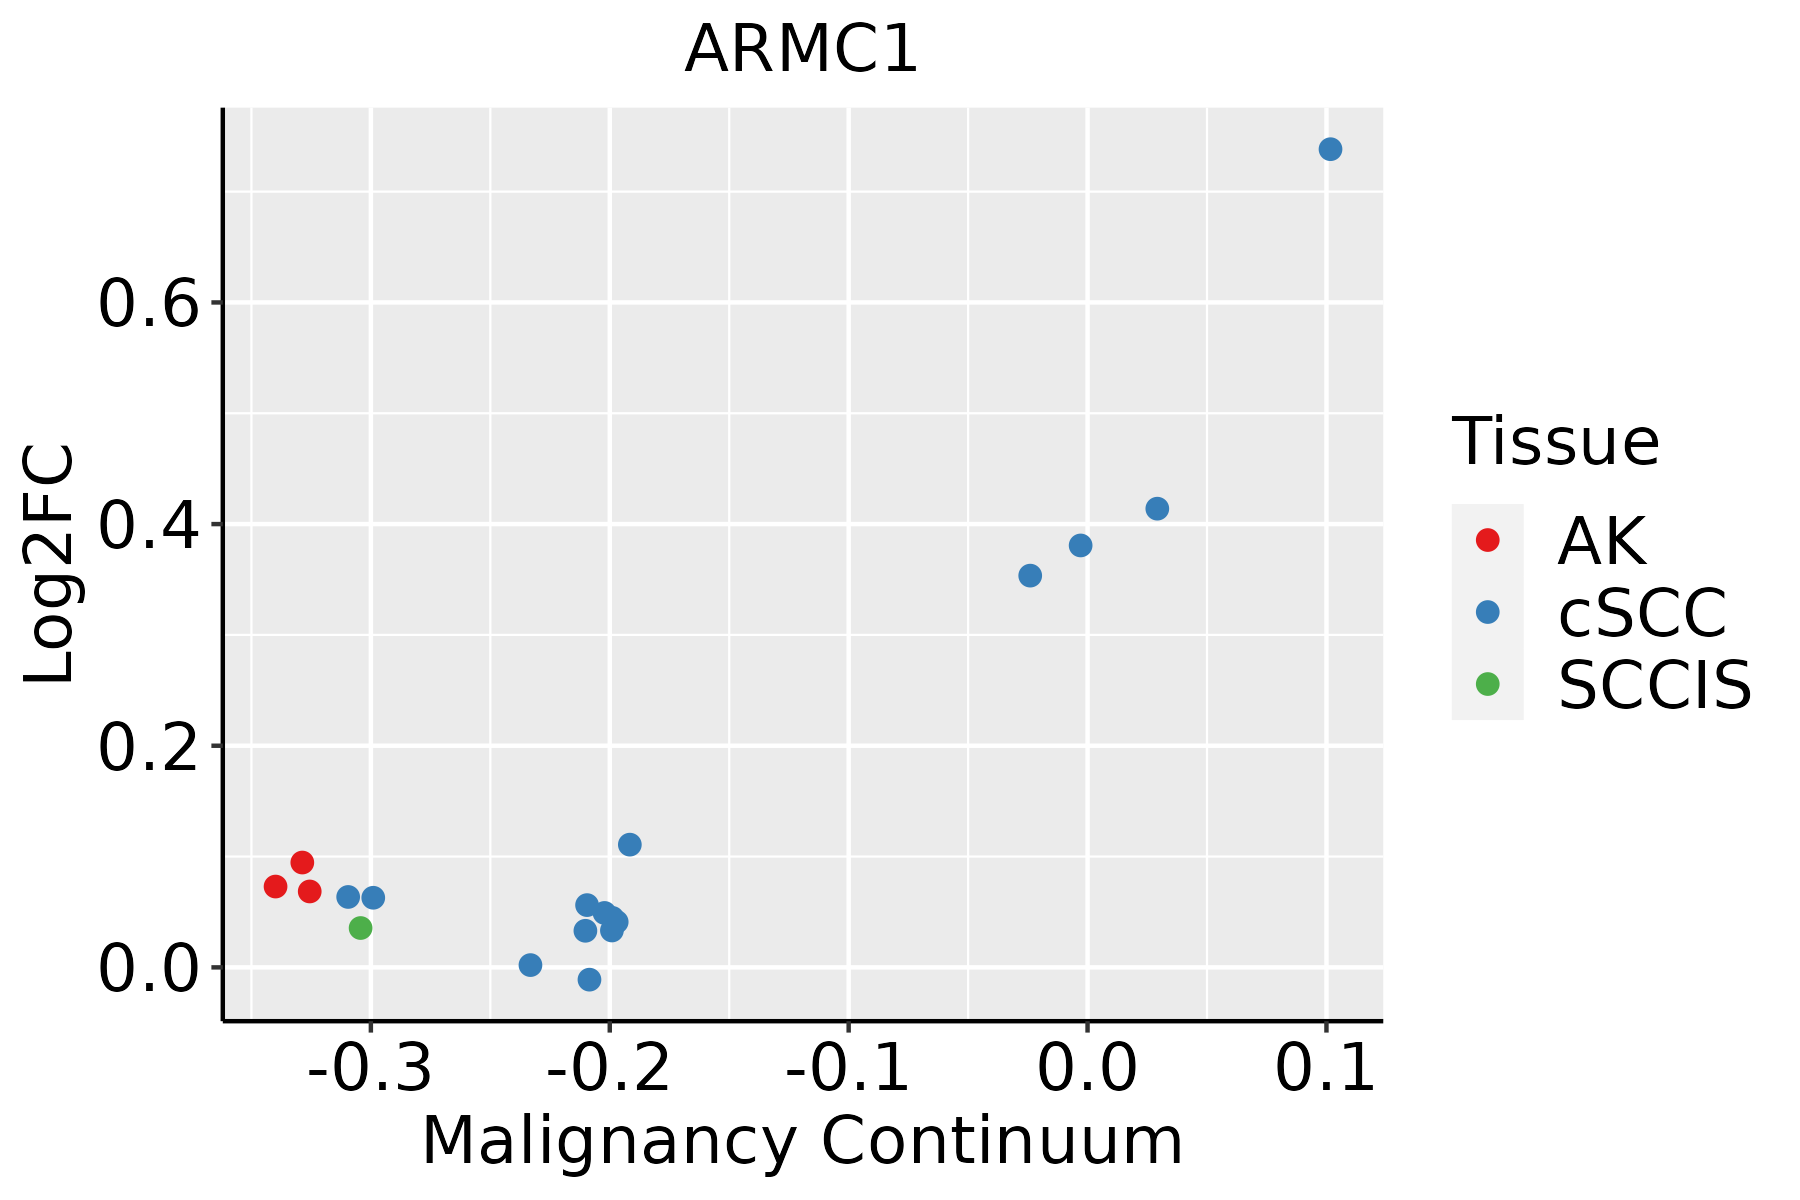 | AK: Actinic keratosis |
| cSCC: Cutaneous squamous cell carcinoma | ||
| SCCIS:squamous cell carcinoma in situ | ||
| Thyroid | 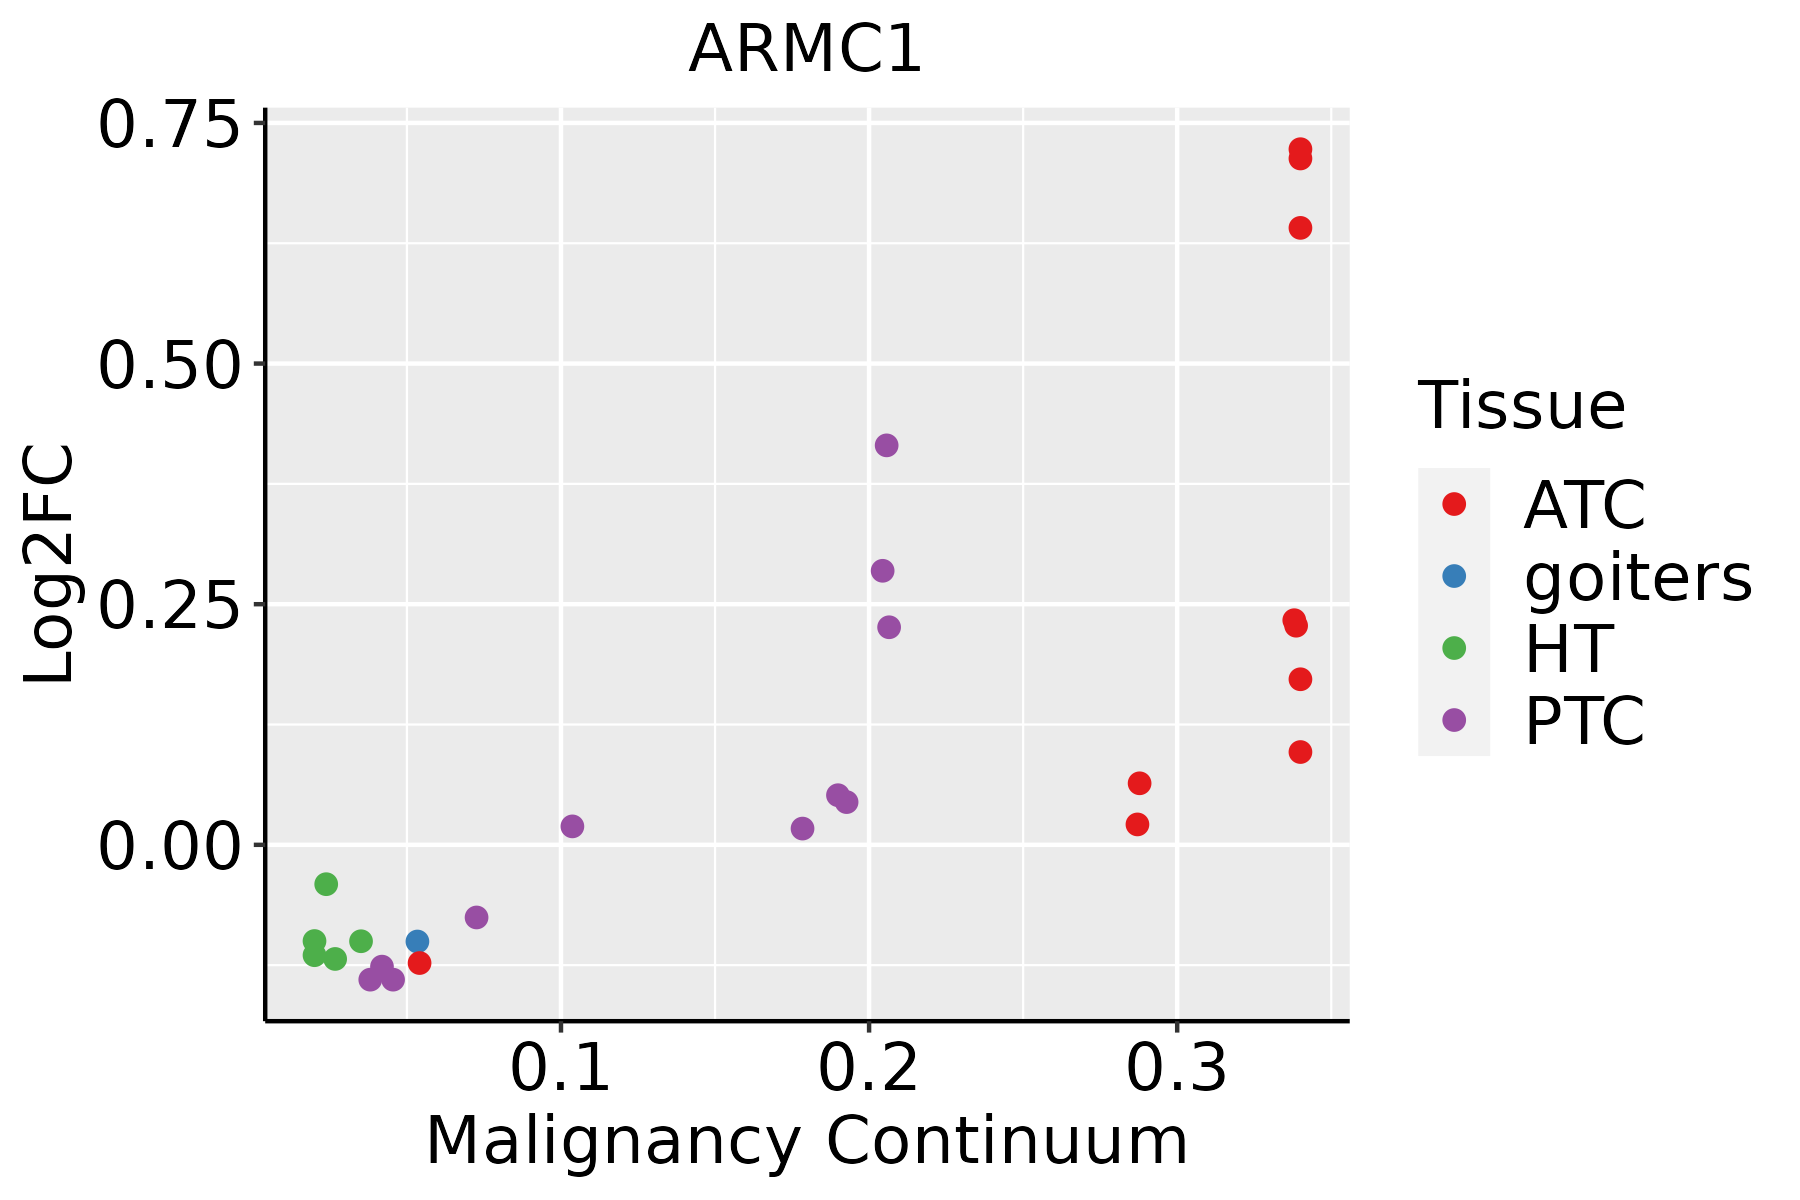 | ATC: Anaplastic thyroid cancer |
| HT: Hashimoto's thyroiditis | ||
| PTC: Papillary thyroid cancer |
| ∗log2FC in expression of this searched gene in stem-like cells from each diseased tissue sample relative to stem-like cells in normal samples in each tissue plotted against the malignancy continuum. Samples are colored based on if they are from different disease stage. |
Top |
Malignant transformation related pathway analysis |
| Find out the enriched GO biological processes and KEGG pathways involved in transition from healthy to precancer to cancer |
| Tissue | Disease Stage | Enriched GO biological Processes |
| Colorectum | AD |  |
| Colorectum | SER |  |
| Colorectum | MSS |  |
| Colorectum | MSI-H |  |
| Colorectum | FAP |  |
| ∗Top 15 enriched GO BP terms are showed in the bar plot of each disease state in each tissue. Each row represents a significant GO biological process which is colored according to the -log10(p.adjust). |
| Page: 1 2 3 4 5 6 7 8 9 |
| GO ID | Tissue | Disease Stage | Description | Gene Ratio | Bg Ratio | pvalue | p.adjust | Count |
| GO:0097193111 | Esophagus | ESCC | intrinsic apoptotic signaling pathway | 222/8552 | 288/18723 | 5.87e-28 | 2.02e-25 | 222 |
| GO:2001233111 | Esophagus | ESCC | regulation of apoptotic signaling pathway | 256/8552 | 356/18723 | 4.11e-24 | 1.04e-21 | 256 |
| GO:2001242111 | Esophagus | ESCC | regulation of intrinsic apoptotic signaling pathway | 128/8552 | 164/18723 | 1.75e-17 | 1.50e-15 | 128 |
| GO:2001234111 | Esophagus | ESCC | negative regulation of apoptotic signaling pathway | 161/8552 | 224/18723 | 1.24e-15 | 8.09e-14 | 161 |
| GO:0072331111 | Esophagus | ESCC | signal transduction by p53 class mediator | 121/8552 | 163/18723 | 9.61e-14 | 4.69e-12 | 121 |
| GO:2001243111 | Esophagus | ESCC | negative regulation of intrinsic apoptotic signaling pathway | 78/8552 | 98/18723 | 5.50e-12 | 2.10e-10 | 78 |
| GO:1901796111 | Esophagus | ESCC | regulation of signal transduction by p53 class mediator | 70/8552 | 93/18723 | 5.69e-09 | 1.18e-07 | 70 |
| GO:0072332111 | Esophagus | ESCC | intrinsic apoptotic signaling pathway by p53 class mediator | 59/8552 | 76/18723 | 1.22e-08 | 2.42e-07 | 59 |
| GO:1902253110 | Esophagus | ESCC | regulation of intrinsic apoptotic signaling pathway by p53 class mediator | 23/8552 | 29/18723 | 2.25e-04 | 1.40e-03 | 23 |
| GO:00516463 | Esophagus | ESCC | mitochondrion localization | 35/8552 | 50/18723 | 4.33e-04 | 2.44e-03 | 35 |
| GO:19017975 | Esophagus | ESCC | negative regulation of signal transduction by p53 class mediator | 22/8552 | 31/18723 | 3.90e-03 | 1.58e-02 | 22 |
| GO:19022544 | Esophagus | ESCC | negative regulation of intrinsic apoptotic signaling pathway by p53 class mediator | 16/8552 | 21/18723 | 4.47e-03 | 1.76e-02 | 16 |
| GO:200123312 | Liver | Cirrhotic | regulation of apoptotic signaling pathway | 163/4634 | 356/18723 | 2.62e-18 | 4.43e-16 | 163 |
| GO:009719312 | Liver | Cirrhotic | intrinsic apoptotic signaling pathway | 130/4634 | 288/18723 | 2.69e-14 | 2.45e-12 | 130 |
| GO:20012427 | Liver | Cirrhotic | regulation of intrinsic apoptotic signaling pathway | 82/4634 | 164/18723 | 2.35e-12 | 1.71e-10 | 82 |
| GO:20012347 | Liver | Cirrhotic | negative regulation of apoptotic signaling pathway | 102/4634 | 224/18723 | 8.40e-12 | 5.60e-10 | 102 |
| GO:20012437 | Liver | Cirrhotic | negative regulation of intrinsic apoptotic signaling pathway | 47/4634 | 98/18723 | 5.26e-07 | 1.17e-05 | 47 |
| GO:007233112 | Liver | Cirrhotic | signal transduction by p53 class mediator | 69/4634 | 163/18723 | 5.97e-07 | 1.30e-05 | 69 |
| GO:00723326 | Liver | Cirrhotic | intrinsic apoptotic signaling pathway by p53 class mediator | 38/4634 | 76/18723 | 1.75e-06 | 3.32e-05 | 38 |
| GO:190179612 | Liver | Cirrhotic | regulation of signal transduction by p53 class mediator | 37/4634 | 93/18723 | 9.58e-04 | 6.78e-03 | 37 |
| Page: 1 2 3 4 5 |
| Pathway ID | Tissue | Disease Stage | Description | Gene Ratio | Bg Ratio | pvalue | p.adjust | qvalue | Count |
| Page: 1 |
Top |
Cell-cell communication analysis |
| Identification of potential cell-cell interactions between two cell types and their ligand-receptor pairs for different disease states |
| Ligand | Receptor | LRpair | Pathway | Tissue | Disease Stage |
| Page: 1 |
Top |
Single-cell gene regulatory network inference analysis |
| Find out the significant the regulons (TFs) and the target genes of each regulon across cell types for different disease states |
| TF | Cell Type | Tissue | Disease Stage | Target Gene | RSS | Regulon Activity |
| ∗The dot plots of a searched regulon are shown for all cell subpopulations in each disease state of each tissue based on the regulon specific score inferred using pySCENIC and by calculating the average expression. |
| Page: 1 |
Top |
Somatic mutation of malignant transformation related genes |
| Annotation of somatic variants for genes involved in malignant transformation |
| Hugo Symbol | Variant Class | Variant Classification | dbSNP RS | HGVSc | HGVSp | HGVSp Short | SWISSPROT | BIOTYPE | SIFT | PolyPhen | Tumor Sample Barcode | Tissue | Histology | Sex | Age | Stage | Therapy Types | Drugs | Outcome |
| ARMC1 | deletion | Frame_Shift_Del | c.324_325delCA | p.Ile109SerfsTer10 | p.I109Sfs*10 | Q9NVT9 | protein_coding | TCGA-D8-A1JK-01 | Breast | breast invasive carcinoma | Female | >=65 | I/II | Unknown | Unknown | SD | |||
| ARMC1 | SNV | Missense_Mutation | rs781730514 | c.383N>A | p.Arg128Gln | p.R128Q | Q9NVT9 | protein_coding | tolerated(0.32) | benign(0.03) | TCGA-2W-A8YY-01 | Cervix | cervical & endocervical cancer | Female | <65 | I/II | Chemotherapy | cisplatin | CR |
| ARMC1 | SNV | Missense_Mutation | c.372G>A | p.Met124Ile | p.M124I | Q9NVT9 | protein_coding | tolerated(0.2) | benign(0.021) | TCGA-C5-A1BK-01 | Cervix | cervical & endocervical cancer | Female | <65 | I/II | Unknown | Unknown | SD | |
| ARMC1 | SNV | Missense_Mutation | c.563G>A | p.Arg188His | p.R188H | Q9NVT9 | protein_coding | deleterious(0.04) | benign(0.103) | TCGA-AA-3864-01 | Colorectum | colon adenocarcinoma | Male | >=65 | I/II | Unknown | Unknown | SD | |
| ARMC1 | SNV | Missense_Mutation | c.557N>A | p.Arg186Gln | p.R186Q | Q9NVT9 | protein_coding | deleterious(0) | probably_damaging(0.998) | TCGA-CA-6717-01 | Colorectum | colon adenocarcinoma | Male | <65 | I/II | Chemotherapy | oxaliplatin | CR | |
| ARMC1 | SNV | Missense_Mutation | c.97G>A | p.Ala33Thr | p.A33T | Q9NVT9 | protein_coding | tolerated(0.55) | benign(0.015) | TCGA-D5-6540-01 | Colorectum | colon adenocarcinoma | Male | >=65 | I/II | Unknown | Unknown | SD | |
| ARMC1 | SNV | Missense_Mutation | c.545N>T | p.Arg182Met | p.R182M | Q9NVT9 | protein_coding | deleterious(0) | probably_damaging(0.962) | TCGA-AG-A01J-01 | Colorectum | rectum adenocarcinoma | Female | <65 | I/II | Unknown | Unknown | SD | |
| ARMC1 | SNV | Missense_Mutation | rs763773660 | c.175G>A | p.Ala59Thr | p.A59T | Q9NVT9 | protein_coding | tolerated(0.19) | probably_damaging(0.916) | TCGA-A5-A0G2-01 | Endometrium | uterine corpus endometrioid carcinoma | Female | <65 | III/IV | Unknown | Unknown | SD |
| ARMC1 | SNV | Missense_Mutation | c.359N>A | p.Ser120Asn | p.S120N | Q9NVT9 | protein_coding | tolerated(0.47) | benign(0) | TCGA-AP-A051-01 | Endometrium | uterine corpus endometrioid carcinoma | Female | >=65 | I/II | Unknown | Unknown | SD | |
| ARMC1 | SNV | Missense_Mutation | rs763773660 | c.175G>A | p.Ala59Thr | p.A59T | Q9NVT9 | protein_coding | tolerated(0.19) | probably_damaging(0.916) | TCGA-AP-A1DV-01 | Endometrium | uterine corpus endometrioid carcinoma | Female | <65 | I/II | Unknown | Unknown | SD |
| Page: 1 2 3 |
Top |
Related drugs of malignant transformation related genes |
| Identification of chemicals and drugs interact with genes involved in malignant transfromation |
| (DGIdb 4.0) |
| Entrez ID | Symbol | Category | Interaction Types | Drug Claim Name | Drug Name | PMIDs |
| Page: 1 |

Copyright 2023-Present -The University of Texas Health Science Center at Houston |