
|
|||||
|
 | |
| |
| |
| |
| |
| |
|
Gene: ARL8A |
Gene summary for ARL8A |
| Gene information | Species | Human | Gene symbol | ARL8A | Gene ID | 127829 |
| Gene name | ADP ribosylation factor like GTPase 8A | |
| Gene Alias | ARL10B | |
| Cytomap | 1q32.1 | |
| Gene Type | protein-coding | GO ID | GO:0006810 | UniProtAcc | A0A087X2J2 |
Top |
Malignant transformation analysis |
| Identification of the aberrant gene expression in precancerous and cancerous lesions by comparing the gene expression of stem-like cells in diseased tissues with normal stem cells |
| Entrez ID | Symbol | Replicates | Species | Organ | Tissue | Adj P-value | Log2FC | Malignancy |
| 127829 | ARL8A | LZE24T | Human | Esophagus | ESCC | 5.59e-11 | 2.23e-01 | 0.0596 |
| 127829 | ARL8A | LZE21T | Human | Esophagus | ESCC | 4.47e-05 | 2.09e-01 | 0.0655 |
| 127829 | ARL8A | P1T-E | Human | Esophagus | ESCC | 4.78e-03 | 2.18e-01 | 0.0875 |
| 127829 | ARL8A | P2T-E | Human | Esophagus | ESCC | 3.51e-09 | 1.77e-01 | 0.1177 |
| 127829 | ARL8A | P4T-E | Human | Esophagus | ESCC | 1.42e-23 | 4.87e-01 | 0.1323 |
| 127829 | ARL8A | P5T-E | Human | Esophagus | ESCC | 3.42e-22 | 4.37e-01 | 0.1327 |
| 127829 | ARL8A | P8T-E | Human | Esophagus | ESCC | 2.30e-17 | 8.34e-02 | 0.0889 |
| 127829 | ARL8A | P9T-E | Human | Esophagus | ESCC | 1.28e-10 | 2.66e-01 | 0.1131 |
| 127829 | ARL8A | P10T-E | Human | Esophagus | ESCC | 1.29e-10 | 2.50e-01 | 0.116 |
| 127829 | ARL8A | P11T-E | Human | Esophagus | ESCC | 4.28e-07 | 3.02e-01 | 0.1426 |
| 127829 | ARL8A | P12T-E | Human | Esophagus | ESCC | 3.95e-19 | 1.72e-01 | 0.1122 |
| 127829 | ARL8A | P15T-E | Human | Esophagus | ESCC | 8.29e-21 | 2.53e-01 | 0.1149 |
| 127829 | ARL8A | P16T-E | Human | Esophagus | ESCC | 2.15e-06 | 1.34e-01 | 0.1153 |
| 127829 | ARL8A | P17T-E | Human | Esophagus | ESCC | 2.66e-04 | 1.25e-01 | 0.1278 |
| 127829 | ARL8A | P20T-E | Human | Esophagus | ESCC | 1.61e-11 | 1.55e-01 | 0.1124 |
| 127829 | ARL8A | P21T-E | Human | Esophagus | ESCC | 1.70e-18 | 2.45e-01 | 0.1617 |
| 127829 | ARL8A | P22T-E | Human | Esophagus | ESCC | 2.63e-16 | 1.97e-01 | 0.1236 |
| 127829 | ARL8A | P23T-E | Human | Esophagus | ESCC | 6.52e-11 | 3.18e-01 | 0.108 |
| 127829 | ARL8A | P24T-E | Human | Esophagus | ESCC | 1.01e-11 | 1.48e-01 | 0.1287 |
| 127829 | ARL8A | P26T-E | Human | Esophagus | ESCC | 1.17e-22 | 2.82e-01 | 0.1276 |
| Page: 1 2 3 4 5 |
| Tissue | Expression Dynamics | Abbreviation |
| Esophagus |  | ESCC: Esophageal squamous cell carcinoma |
| HGIN: High-grade intraepithelial neoplasias | ||
| LGIN: Low-grade intraepithelial neoplasias | ||
| Liver | 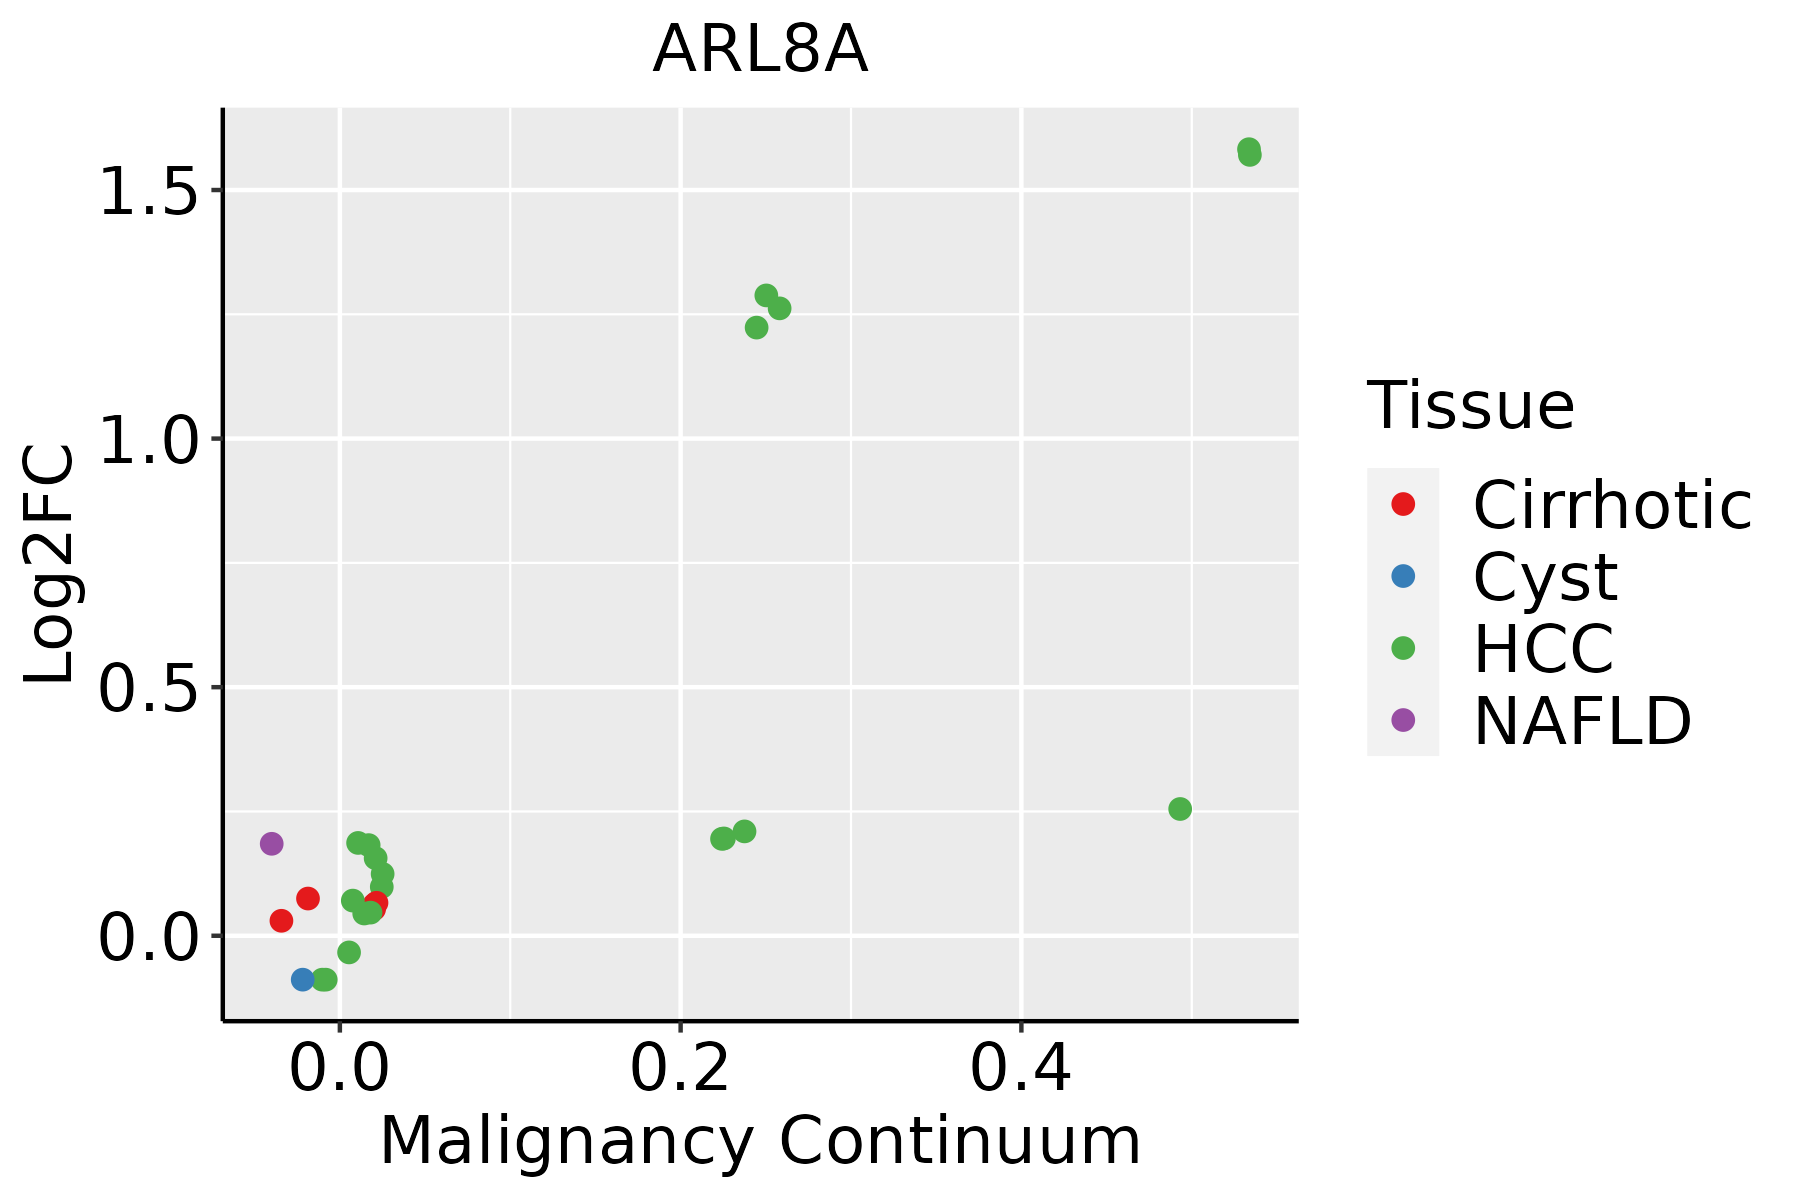 | HCC: Hepatocellular carcinoma |
| NAFLD: Non-alcoholic fatty liver disease | ||
| Oral Cavity |  | EOLP: Erosive Oral lichen planus |
| LP: leukoplakia | ||
| NEOLP: Non-erosive oral lichen planus | ||
| OSCC: Oral squamous cell carcinoma | ||
| Thyroid |  | ATC: Anaplastic thyroid cancer |
| HT: Hashimoto's thyroiditis | ||
| PTC: Papillary thyroid cancer |
| ∗log2FC in expression of this searched gene in stem-like cells from each diseased tissue sample relative to stem-like cells in normal samples in each tissue plotted against the malignancy continuum. Samples are colored based on if they are from different disease stage. |
Top |
Malignant transformation related pathway analysis |
| Find out the enriched GO biological processes and KEGG pathways involved in transition from healthy to precancer to cancer |
| Tissue | Disease Stage | Enriched GO biological Processes |
| Colorectum | AD |  |
| Colorectum | SER |  |
| Colorectum | MSS |  |
| Colorectum | MSI-H |  |
| Colorectum | FAP |  |
| ∗Top 15 enriched GO BP terms are showed in the bar plot of each disease state in each tissue. Each row represents a significant GO biological process which is colored according to the -log10(p.adjust). |
| Page: 1 2 3 4 5 6 7 8 9 |
| GO ID | Tissue | Disease Stage | Description | Gene Ratio | Bg Ratio | pvalue | p.adjust | Count |
| GO:000705911 | Esophagus | ESCC | chromosome segregation | 238/8552 | 346/18723 | 1.72e-18 | 1.82e-16 | 238 |
| GO:003070518 | Esophagus | ESCC | cytoskeleton-dependent intracellular transport | 133/8552 | 195/18723 | 1.48e-10 | 4.27e-09 | 133 |
| GO:001097013 | Esophagus | ESCC | transport along microtubule | 107/8552 | 155/18723 | 3.17e-09 | 6.80e-08 | 107 |
| GO:000808810 | Esophagus | ESCC | axo-dendritic transport | 58/8552 | 75/18723 | 2.09e-08 | 4.02e-07 | 58 |
| GO:00989304 | Esophagus | ESCC | axonal transport | 49/8552 | 64/18723 | 4.54e-07 | 6.15e-06 | 49 |
| GO:00991114 | Esophagus | ESCC | microtubule-based transport | 115/8552 | 190/18723 | 2.54e-05 | 2.15e-04 | 115 |
| GO:00080892 | Esophagus | ESCC | anterograde axonal transport | 37/8552 | 50/18723 | 4.42e-05 | 3.51e-04 | 37 |
| GO:003070511 | Liver | Cirrhotic | cytoskeleton-dependent intracellular transport | 68/4634 | 195/18723 | 9.54e-04 | 6.77e-03 | 68 |
| GO:000808811 | Liver | Cirrhotic | axo-dendritic transport | 29/4634 | 75/18723 | 5.24e-03 | 2.69e-02 | 29 |
| GO:00109701 | Liver | Cirrhotic | transport along microtubule | 52/4634 | 155/18723 | 8.42e-03 | 3.91e-02 | 52 |
| GO:0007059 | Liver | HCC | chromosome segregation | 197/7958 | 346/18723 | 3.57e-08 | 7.87e-07 | 197 |
| GO:00080882 | Liver | HCC | axo-dendritic transport | 52/7958 | 75/18723 | 2.34e-06 | 3.14e-05 | 52 |
| GO:003070521 | Liver | HCC | cytoskeleton-dependent intracellular transport | 111/7958 | 195/18723 | 3.25e-05 | 3.28e-04 | 111 |
| GO:0098930 | Liver | HCC | axonal transport | 43/7958 | 64/18723 | 5.73e-05 | 5.31e-04 | 43 |
| GO:00109702 | Liver | HCC | transport along microtubule | 90/7958 | 155/18723 | 6.49e-05 | 5.92e-04 | 90 |
| GO:0008089 | Liver | HCC | anterograde axonal transport | 32/7958 | 50/18723 | 1.76e-03 | 9.12e-03 | 32 |
| GO:00070592 | Oral cavity | OSCC | chromosome segregation | 206/7305 | 346/18723 | 5.82e-15 | 3.76e-13 | 206 |
| GO:003070510 | Oral cavity | OSCC | cytoskeleton-dependent intracellular transport | 113/7305 | 195/18723 | 6.03e-08 | 1.09e-06 | 113 |
| GO:00109706 | Oral cavity | OSCC | transport along microtubule | 88/7305 | 155/18723 | 5.35e-06 | 6.02e-05 | 88 |
| GO:00080889 | Oral cavity | OSCC | axo-dendritic transport | 46/7305 | 75/18723 | 7.44e-05 | 5.81e-04 | 46 |
| Page: 1 2 |
| Pathway ID | Tissue | Disease Stage | Description | Gene Ratio | Bg Ratio | pvalue | p.adjust | qvalue | Count |
| hsa05132211 | Esophagus | ESCC | Salmonella infection | 191/4205 | 249/8465 | 6.51e-19 | 5.45e-17 | 2.79e-17 | 191 |
| hsa05132310 | Esophagus | ESCC | Salmonella infection | 191/4205 | 249/8465 | 6.51e-19 | 5.45e-17 | 2.79e-17 | 191 |
| hsa0513222 | Liver | Cirrhotic | Salmonella infection | 121/2530 | 249/8465 | 2.47e-10 | 5.13e-09 | 3.16e-09 | 121 |
| hsa0513232 | Liver | Cirrhotic | Salmonella infection | 121/2530 | 249/8465 | 2.47e-10 | 5.13e-09 | 3.16e-09 | 121 |
| hsa0513242 | Liver | HCC | Salmonella infection | 178/4020 | 249/8465 | 5.90e-15 | 1.98e-13 | 1.10e-13 | 178 |
| hsa0513252 | Liver | HCC | Salmonella infection | 178/4020 | 249/8465 | 5.90e-15 | 1.98e-13 | 1.10e-13 | 178 |
| hsa0513230 | Oral cavity | OSCC | Salmonella infection | 174/3704 | 249/8465 | 2.67e-17 | 1.49e-15 | 7.58e-16 | 174 |
| hsa05132114 | Oral cavity | OSCC | Salmonella infection | 174/3704 | 249/8465 | 2.67e-17 | 1.49e-15 | 7.58e-16 | 174 |
| Page: 1 |
Top |
Cell-cell communication analysis |
| Identification of potential cell-cell interactions between two cell types and their ligand-receptor pairs for different disease states |
| Ligand | Receptor | LRpair | Pathway | Tissue | Disease Stage |
| Page: 1 |
Top |
Single-cell gene regulatory network inference analysis |
| Find out the significant the regulons (TFs) and the target genes of each regulon across cell types for different disease states |
| TF | Cell Type | Tissue | Disease Stage | Target Gene | RSS | Regulon Activity |
| ∗The dot plots of a searched regulon are shown for all cell subpopulations in each disease state of each tissue based on the regulon specific score inferred using pySCENIC and by calculating the average expression. |
| Page: 1 |
Top |
Somatic mutation of malignant transformation related genes |
| Annotation of somatic variants for genes involved in malignant transformation |
| Hugo Symbol | Variant Class | Variant Classification | dbSNP RS | HGVSc | HGVSp | HGVSp Short | SWISSPROT | BIOTYPE | SIFT | PolyPhen | Tumor Sample Barcode | Tissue | Histology | Sex | Age | Stage | Therapy Types | Drugs | Outcome |
| ARL8A | insertion | In_Frame_Ins | novel | c.246_247insATA | p.Trp82_Glu83insIle | p.W82_E83insI | Q96BM9 | protein_coding | TCGA-A2-A0EQ-01 | Breast | breast invasive carcinoma | Female | <65 | I/II | Chemotherapy | adriamycin | SD | ||
| ARL8A | SNV | Missense_Mutation | novel | c.172N>T | p.Arg58Cys | p.R58C | Q96BM9 | protein_coding | deleterious(0) | probably_damaging(0.998) | TCGA-AA-3877-01 | Colorectum | colon adenocarcinoma | Female | >=65 | I/II | Unknown | Unknown | SD |
| ARL8A | SNV | Missense_Mutation | c.371N>T | p.Pro124Leu | p.P124L | Q96BM9 | protein_coding | deleterious(0) | probably_damaging(1) | TCGA-G4-6586-01 | Colorectum | colon adenocarcinoma | Female | >=65 | I/II | Unknown | Unknown | SD | |
| ARL8A | SNV | Missense_Mutation | novel | c.236N>A | p.Arg79His | p.R79H | Q96BM9 | protein_coding | deleterious(0) | possibly_damaging(0.895) | TCGA-A5-A2K3-01 | Endometrium | uterine corpus endometrioid carcinoma | Female | >=65 | I/II | Chemotherapy | carboplatin | SD |
| ARL8A | SNV | Missense_Mutation | c.540C>A | p.His180Gln | p.H180Q | Q96BM9 | protein_coding | deleterious(0.04) | benign(0.046) | TCGA-AP-A051-01 | Endometrium | uterine corpus endometrioid carcinoma | Female | >=65 | I/II | Unknown | Unknown | SD | |
| ARL8A | SNV | Missense_Mutation | novel | c.226N>T | p.Pro76Ser | p.P76S | Q96BM9 | protein_coding | deleterious(0.03) | possibly_damaging(0.643) | TCGA-AP-A1DK-01 | Endometrium | uterine corpus endometrioid carcinoma | Female | <65 | I/II | Unknown | Unknown | SD |
| ARL8A | SNV | Missense_Mutation | novel | c.139N>A | p.Glu47Lys | p.E47K | Q96BM9 | protein_coding | deleterious(0.02) | possibly_damaging(0.903) | TCGA-AX-A2H4-01 | Endometrium | uterine corpus endometrioid carcinoma | Female | >=65 | III/IV | Unknown | Unknown | PD |
| ARL8A | SNV | Missense_Mutation | c.385N>C | p.Gly129Arg | p.G129R | Q96BM9 | protein_coding | deleterious(0) | probably_damaging(1) | TCGA-DD-A113-01 | Liver | liver hepatocellular carcinoma | Female | <65 | I/II | Unknown | Unknown | PD | |
| ARL8A | SNV | Missense_Mutation | novel | c.305N>T | p.Glu102Val | p.E102V | Q96BM9 | protein_coding | deleterious(0.01) | benign(0.263) | TCGA-86-8673-01 | Lung | lung adenocarcinoma | Male | <65 | I/II | Unknown | Unknown | PD |
| ARL8A | SNV | Missense_Mutation | c.557N>A | p.Ser186Asn | p.S186N | Q96BM9 | protein_coding | tolerated_low_confidence(0.08) | benign(0.007) | TCGA-MP-A5C7-01 | Lung | lung adenocarcinoma | Female | >=65 | I/II | Unknown | Unknown | SD |
| Page: 1 2 |
Top |
Related drugs of malignant transformation related genes |
| Identification of chemicals and drugs interact with genes involved in malignant transfromation |
| (DGIdb 4.0) |
| Entrez ID | Symbol | Category | Interaction Types | Drug Claim Name | Drug Name | PMIDs |
| Page: 1 |

Copyright 2023-Present -The University of Texas Health Science Center at Houston |