
|
|||||
|
 | |
| |
| |
| |
| |
| |
|
Gene: ARL6IP4 |
Gene summary for ARL6IP4 |
| Gene information | Species | Human | Gene symbol | ARL6IP4 | Gene ID | 51329 |
| Gene name | ADP ribosylation factor like GTPase 6 interacting protein 4 | |
| Gene Alias | SFRS20 | |
| Cytomap | 12q24.31 | |
| Gene Type | protein-coding | GO ID | GO:0006139 | UniProtAcc | Q66PJ3 |
Top |
Malignant transformation analysis |
| Identification of the aberrant gene expression in precancerous and cancerous lesions by comparing the gene expression of stem-like cells in diseased tissues with normal stem cells |
| Entrez ID | Symbol | Replicates | Species | Organ | Tissue | Adj P-value | Log2FC | Malignancy |
| 51329 | ARL6IP4 | CA_HPV_1 | Human | Cervix | CC | 1.70e-17 | -2.99e-01 | 0.0264 |
| 51329 | ARL6IP4 | N_HPV_1 | Human | Cervix | N_HPV | 2.11e-02 | 3.83e-02 | 0.0079 |
| 51329 | ARL6IP4 | CCI_1 | Human | Cervix | CC | 1.55e-14 | -8.56e-01 | 0.528 |
| 51329 | ARL6IP4 | CCI_2 | Human | Cervix | CC | 5.33e-16 | -8.77e-01 | 0.5249 |
| 51329 | ARL6IP4 | CCI_3 | Human | Cervix | CC | 2.03e-22 | -8.77e-01 | 0.516 |
| 51329 | ARL6IP4 | CCII_1 | Human | Cervix | CC | 2.06e-23 | -8.32e-01 | 0.3249 |
| 51329 | ARL6IP4 | sample3 | Human | Cervix | CC | 4.40e-03 | -1.05e-01 | 0.1387 |
| 51329 | ARL6IP4 | L1 | Human | Cervix | CC | 1.44e-07 | -3.27e-01 | 0.0802 |
| 51329 | ARL6IP4 | AEH-subject1 | Human | Endometrium | AEH | 1.23e-02 | -6.08e-02 | -0.3059 |
| 51329 | ARL6IP4 | AEH-subject2 | Human | Endometrium | AEH | 6.11e-07 | -1.63e-01 | -0.2525 |
| 51329 | ARL6IP4 | AEH-subject3 | Human | Endometrium | AEH | 1.00e-09 | -1.15e-01 | -0.2576 |
| 51329 | ARL6IP4 | AEH-subject4 | Human | Endometrium | AEH | 8.70e-13 | -3.74e-01 | -0.2657 |
| 51329 | ARL6IP4 | AEH-subject5 | Human | Endometrium | AEH | 7.91e-22 | -6.24e-01 | -0.2953 |
| 51329 | ARL6IP4 | EEC-subject1 | Human | Endometrium | EEC | 2.85e-17 | -4.13e-01 | -0.2682 |
| 51329 | ARL6IP4 | EEC-subject2 | Human | Endometrium | EEC | 7.29e-06 | -3.39e-03 | -0.2607 |
| 51329 | ARL6IP4 | EEC-subject3 | Human | Endometrium | EEC | 7.14e-59 | -6.39e-01 | -0.2525 |
| 51329 | ARL6IP4 | EEC-subject4 | Human | Endometrium | EEC | 3.64e-09 | -3.83e-01 | -0.2571 |
| 51329 | ARL6IP4 | EEC-subject5 | Human | Endometrium | EEC | 3.51e-10 | -3.48e-01 | -0.249 |
| 51329 | ARL6IP4 | GSM5276937 | Human | Endometrium | EEC | 2.43e-06 | -3.16e-01 | -0.0897 |
| 51329 | ARL6IP4 | GSM6177620_NYU_UCEC1_lib1_lib1 | Human | Endometrium | EEC | 4.44e-44 | -6.99e-01 | -0.1869 |
| Page: 1 2 3 4 5 6 7 8 9 10 11 12 13 |
| Tissue | Expression Dynamics | Abbreviation |
| Cervix | 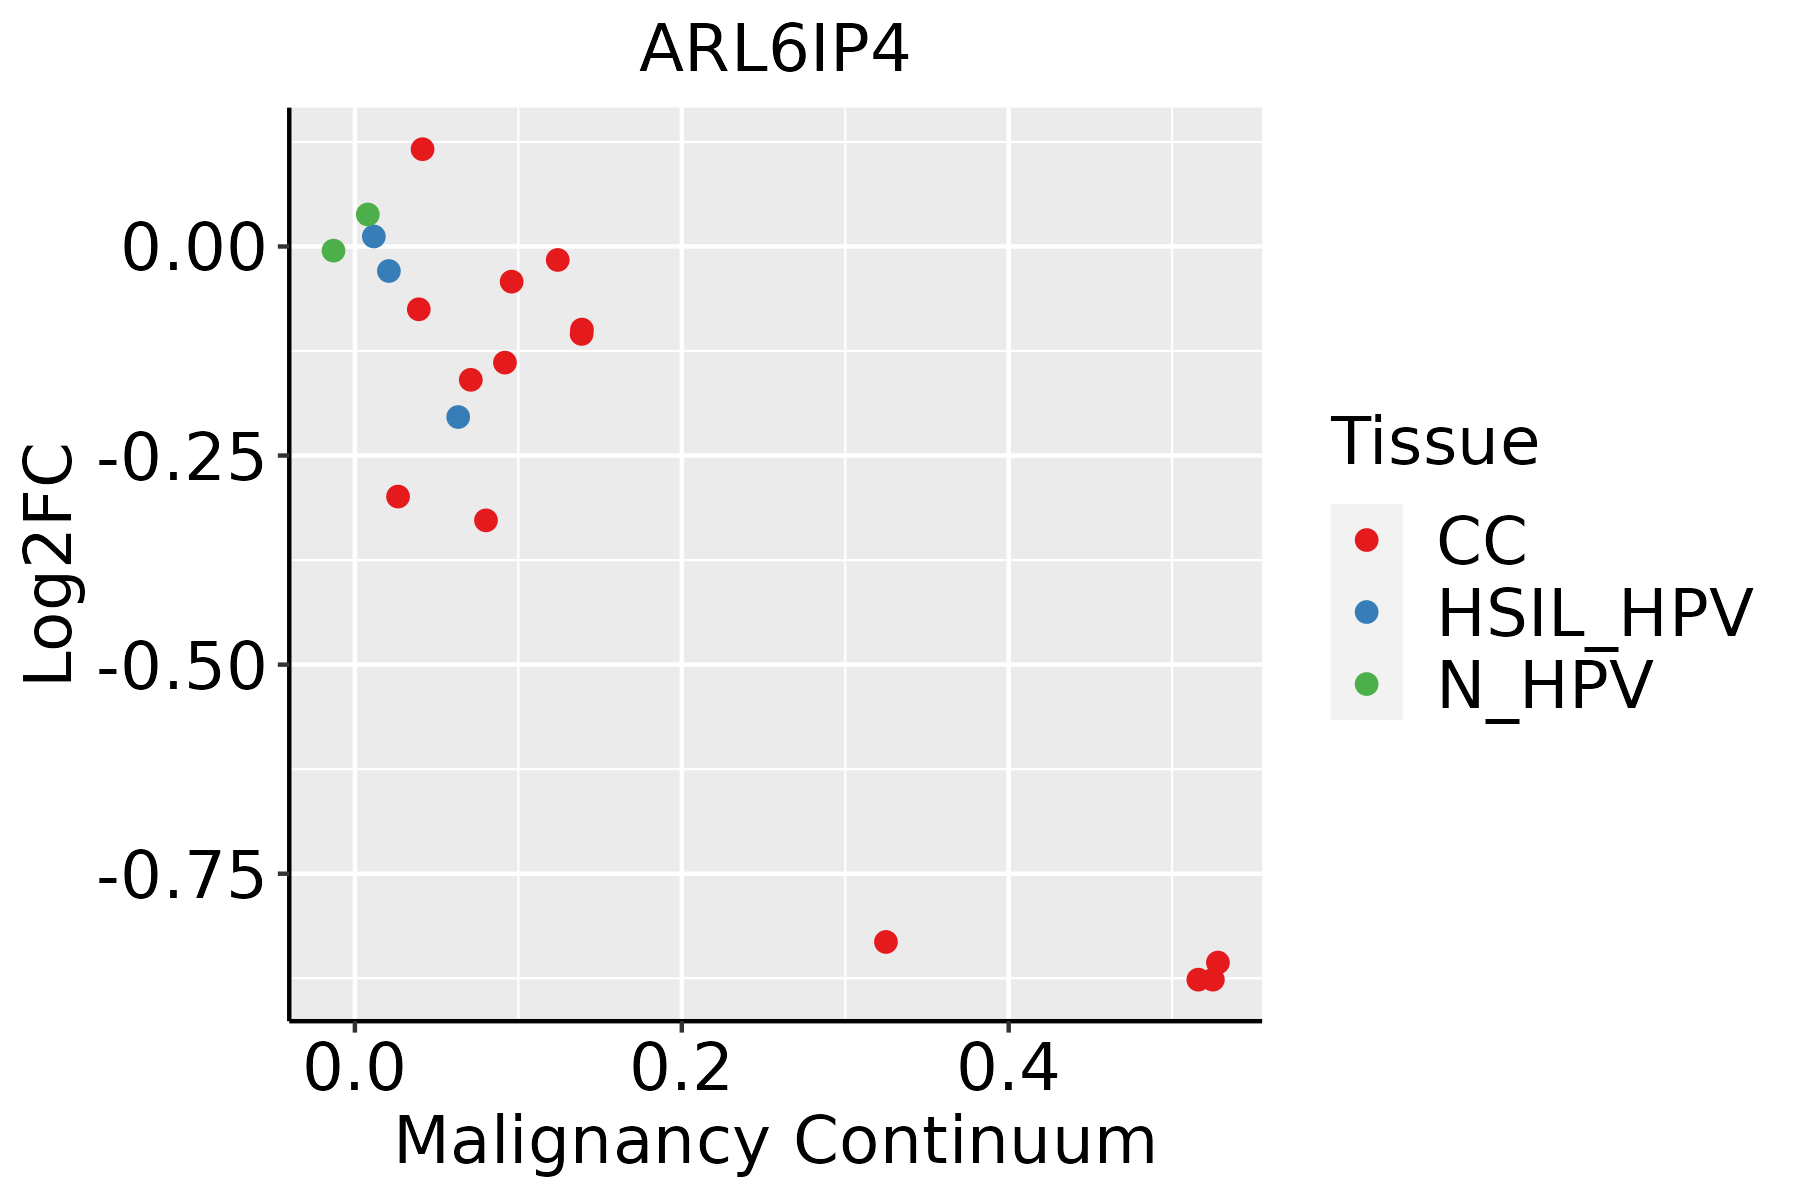 | CC: Cervix cancer |
| HSIL_HPV: HPV-infected high-grade squamous intraepithelial lesions | ||
| N_HPV: HPV-infected normal cervix | ||
| Endometrium | 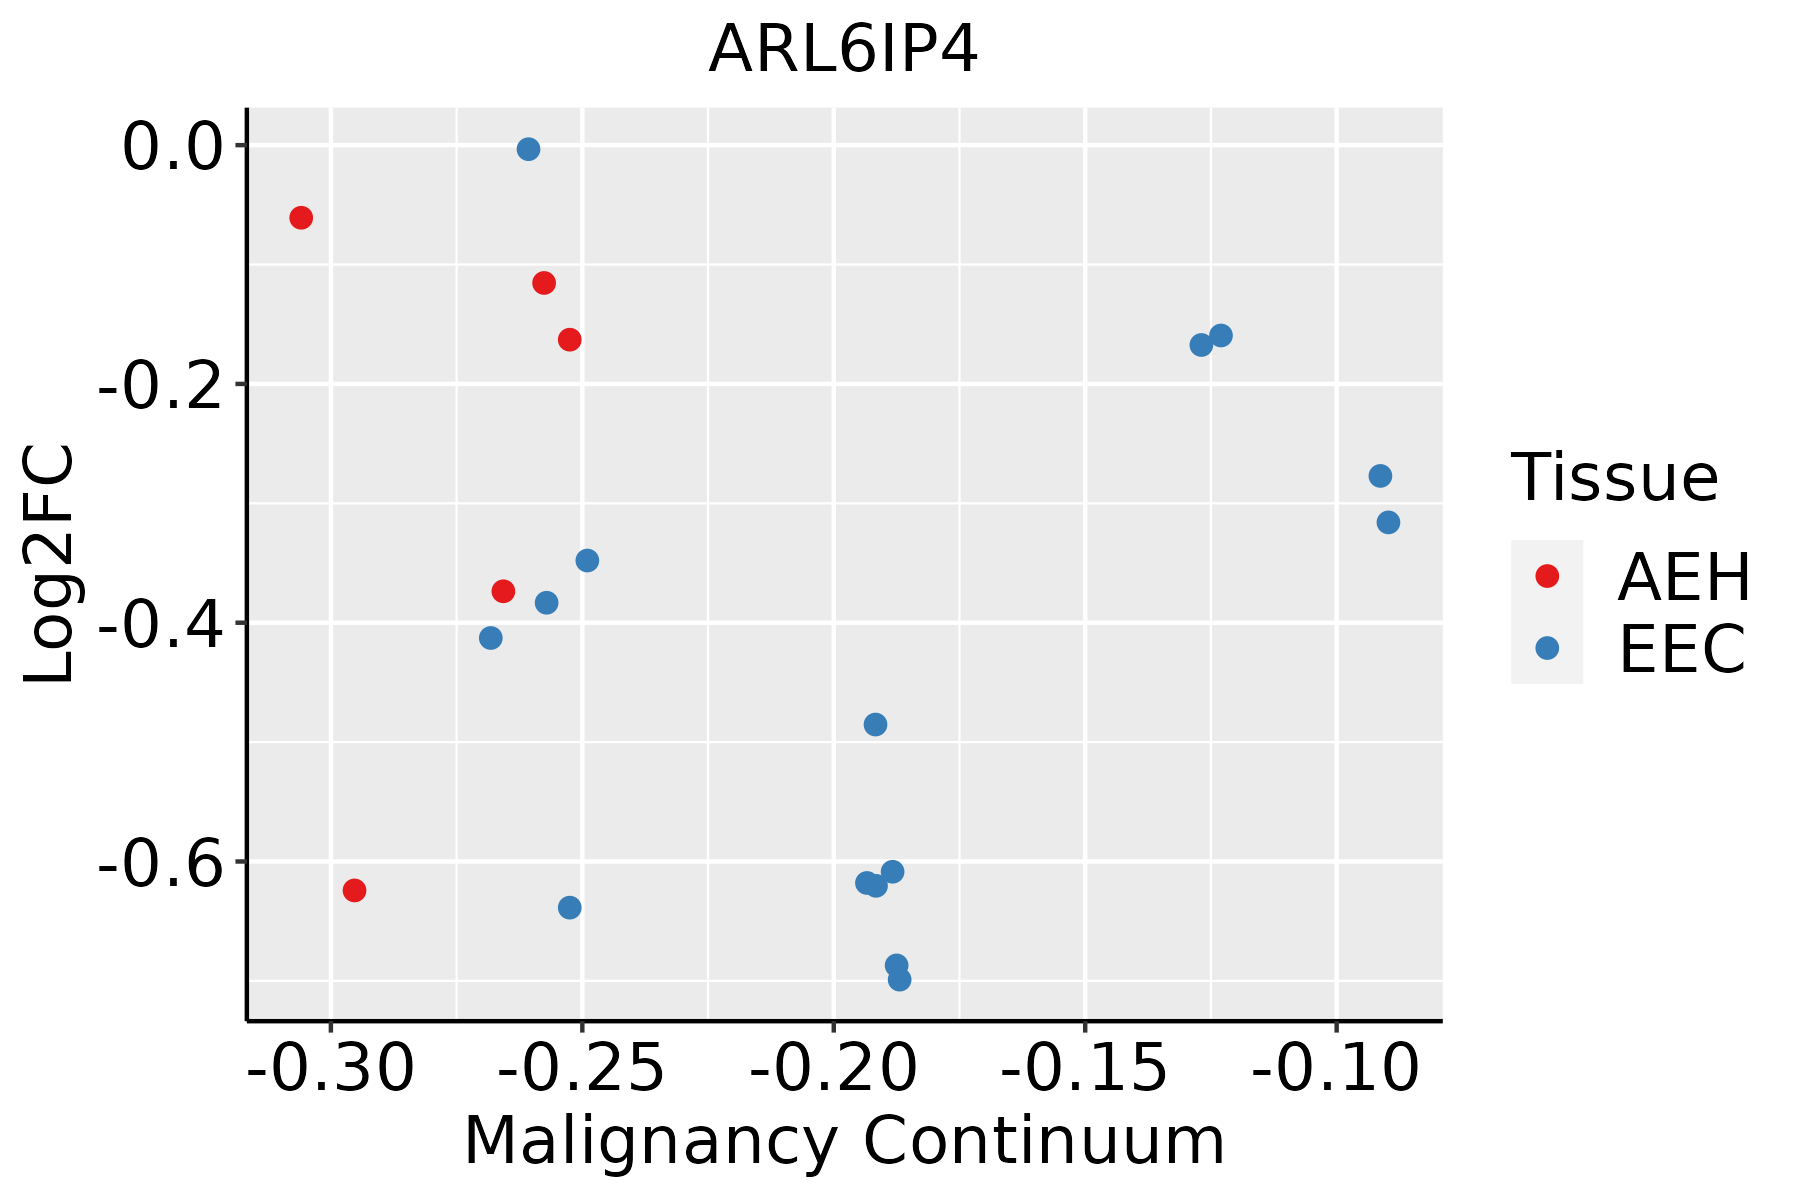 | AEH: Atypical endometrial hyperplasia |
| EEC: Endometrioid Cancer | ||
| Esophagus |  | ESCC: Esophageal squamous cell carcinoma |
| HGIN: High-grade intraepithelial neoplasias | ||
| LGIN: Low-grade intraepithelial neoplasias | ||
| GC | 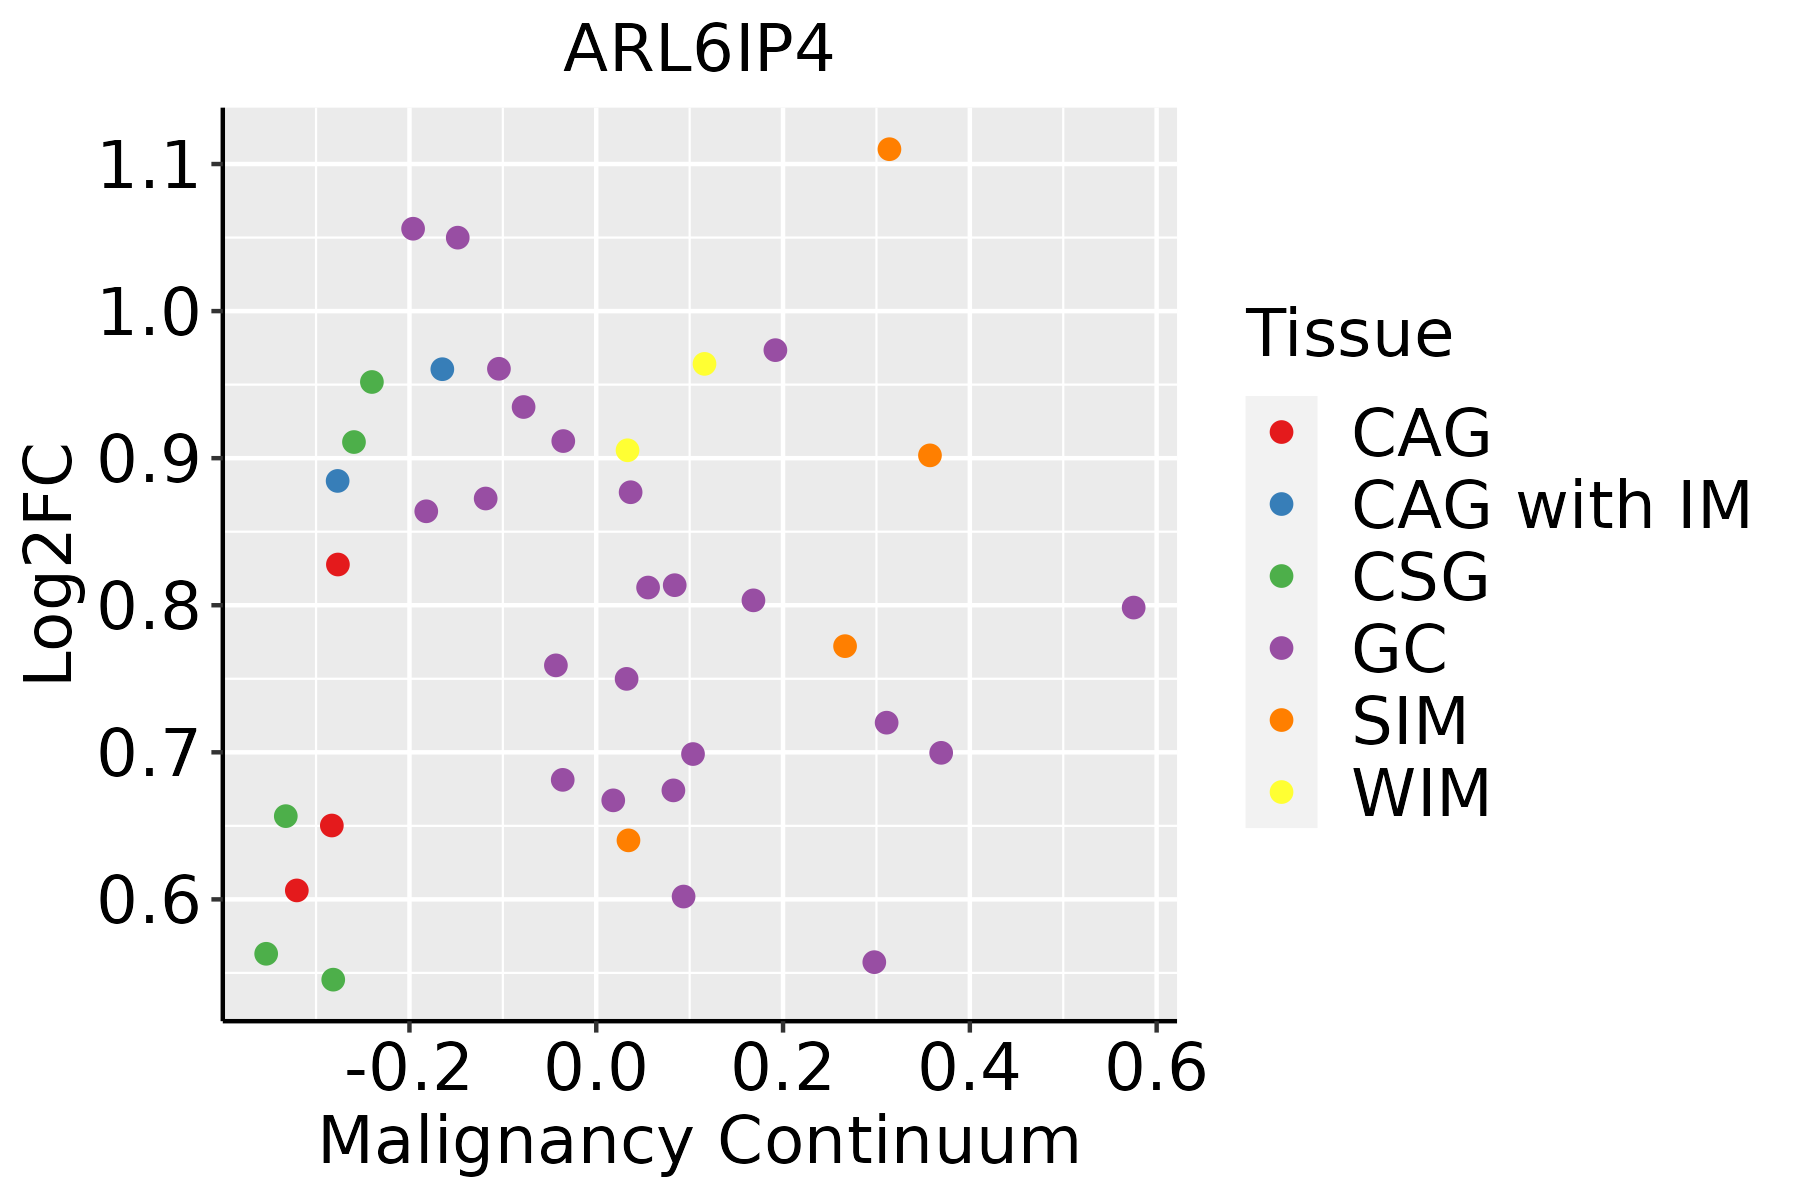 | CAG: Chronic atrophic gastritis |
| CAG with IM: Chronic atrophic gastritis with intestinal metaplasia | ||
| CSG: Chronic superficial gastritis | ||
| GC: Gastric cancer | ||
| SIM: Severe intestinal metaplasia | ||
| WIM: Wild intestinal metaplasia | ||
| Liver | 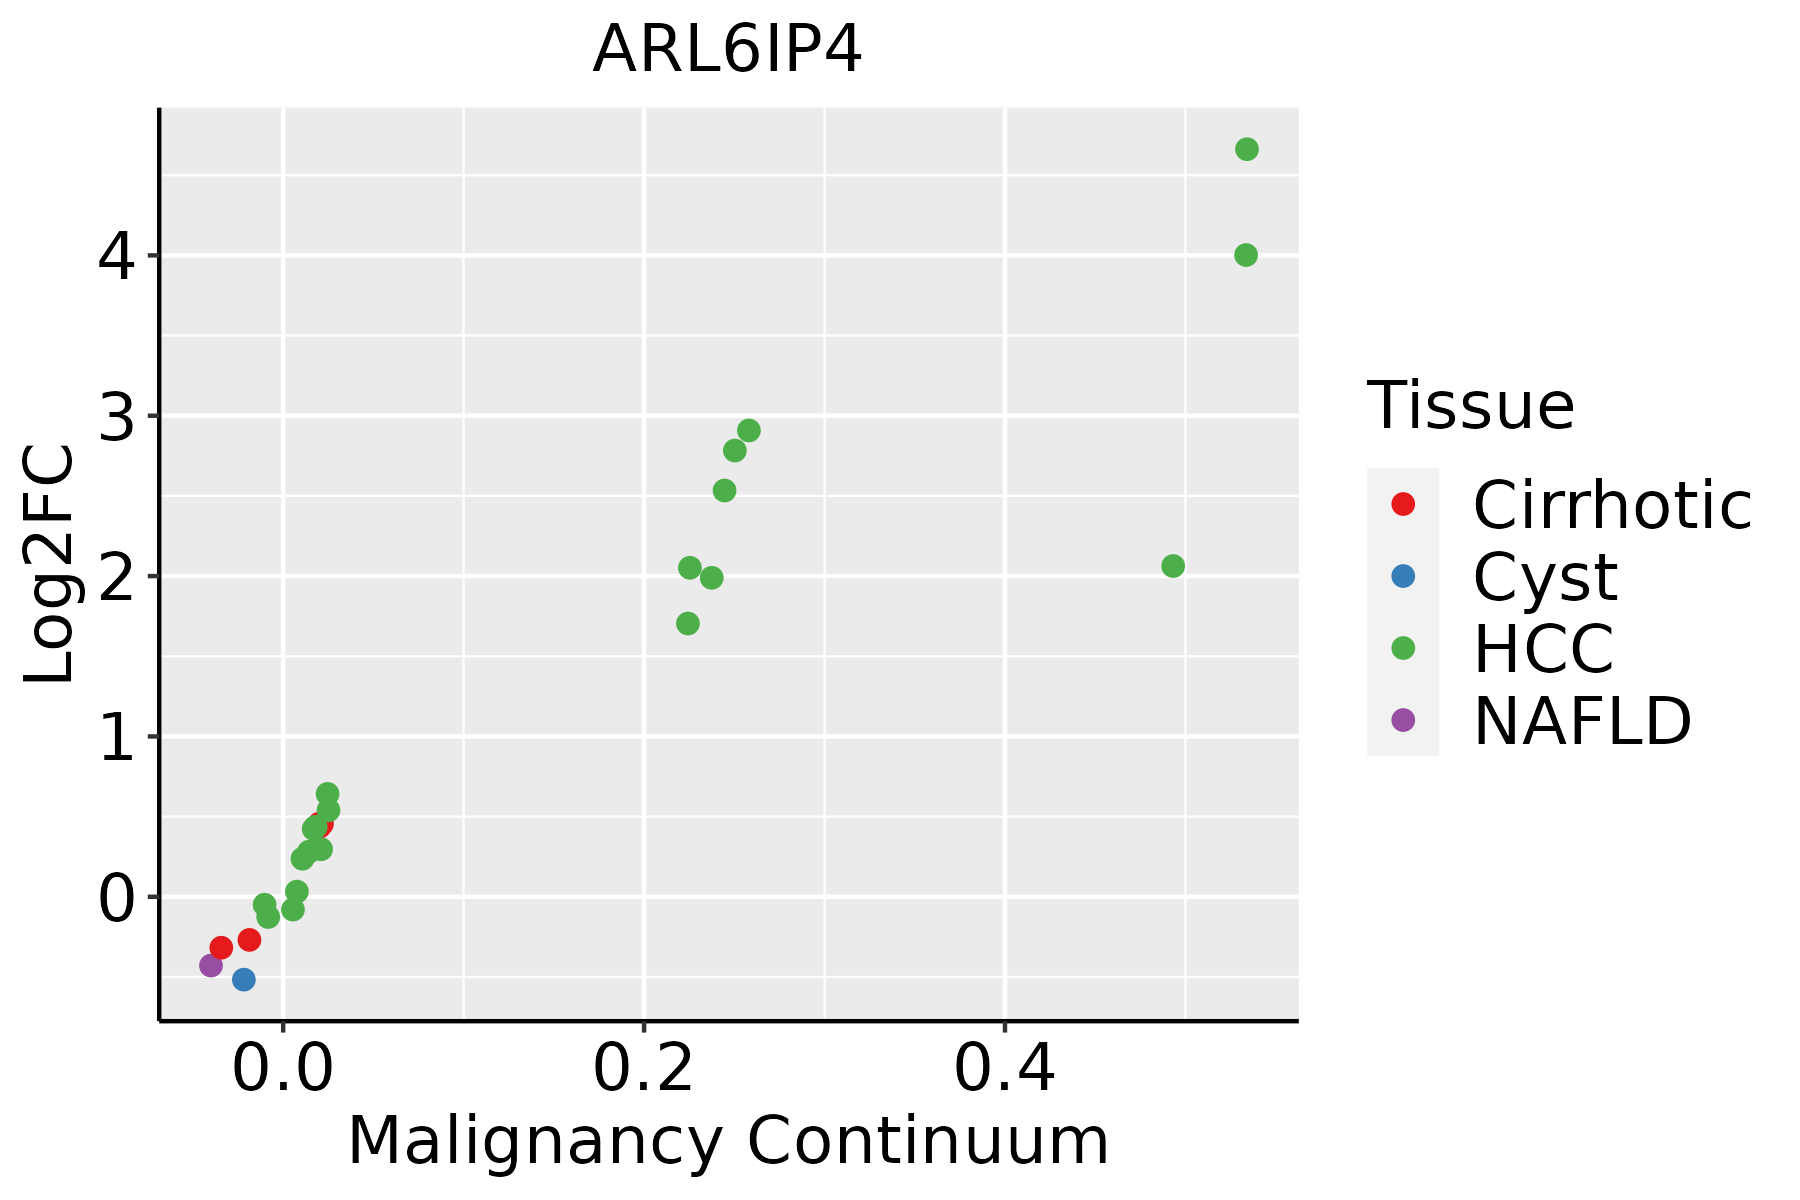 | HCC: Hepatocellular carcinoma |
| NAFLD: Non-alcoholic fatty liver disease | ||
| Lung | 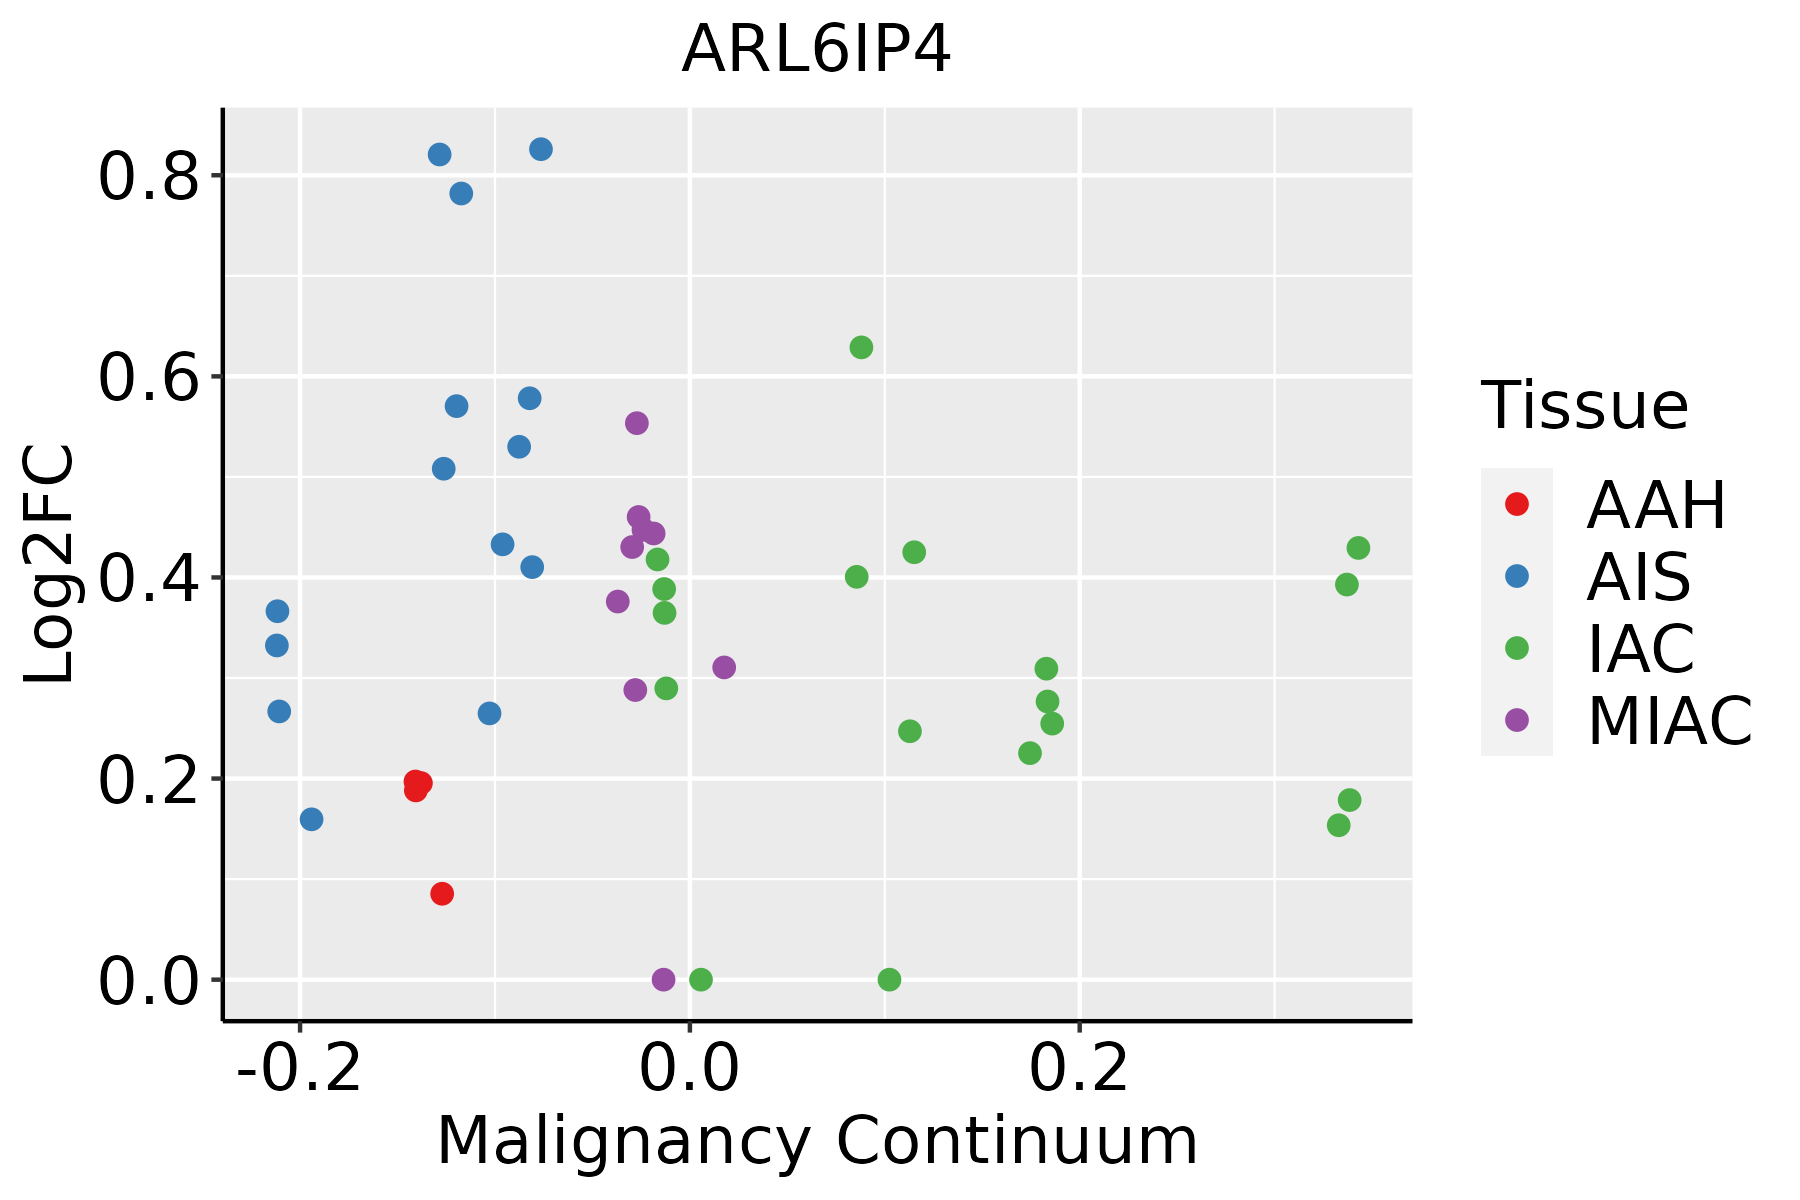 | AAH: Atypical adenomatous hyperplasia |
| AIS: Adenocarcinoma in situ | ||
| IAC: Invasive lung adenocarcinoma | ||
| MIA: Minimally invasive adenocarcinoma | ||
| Oral Cavity | 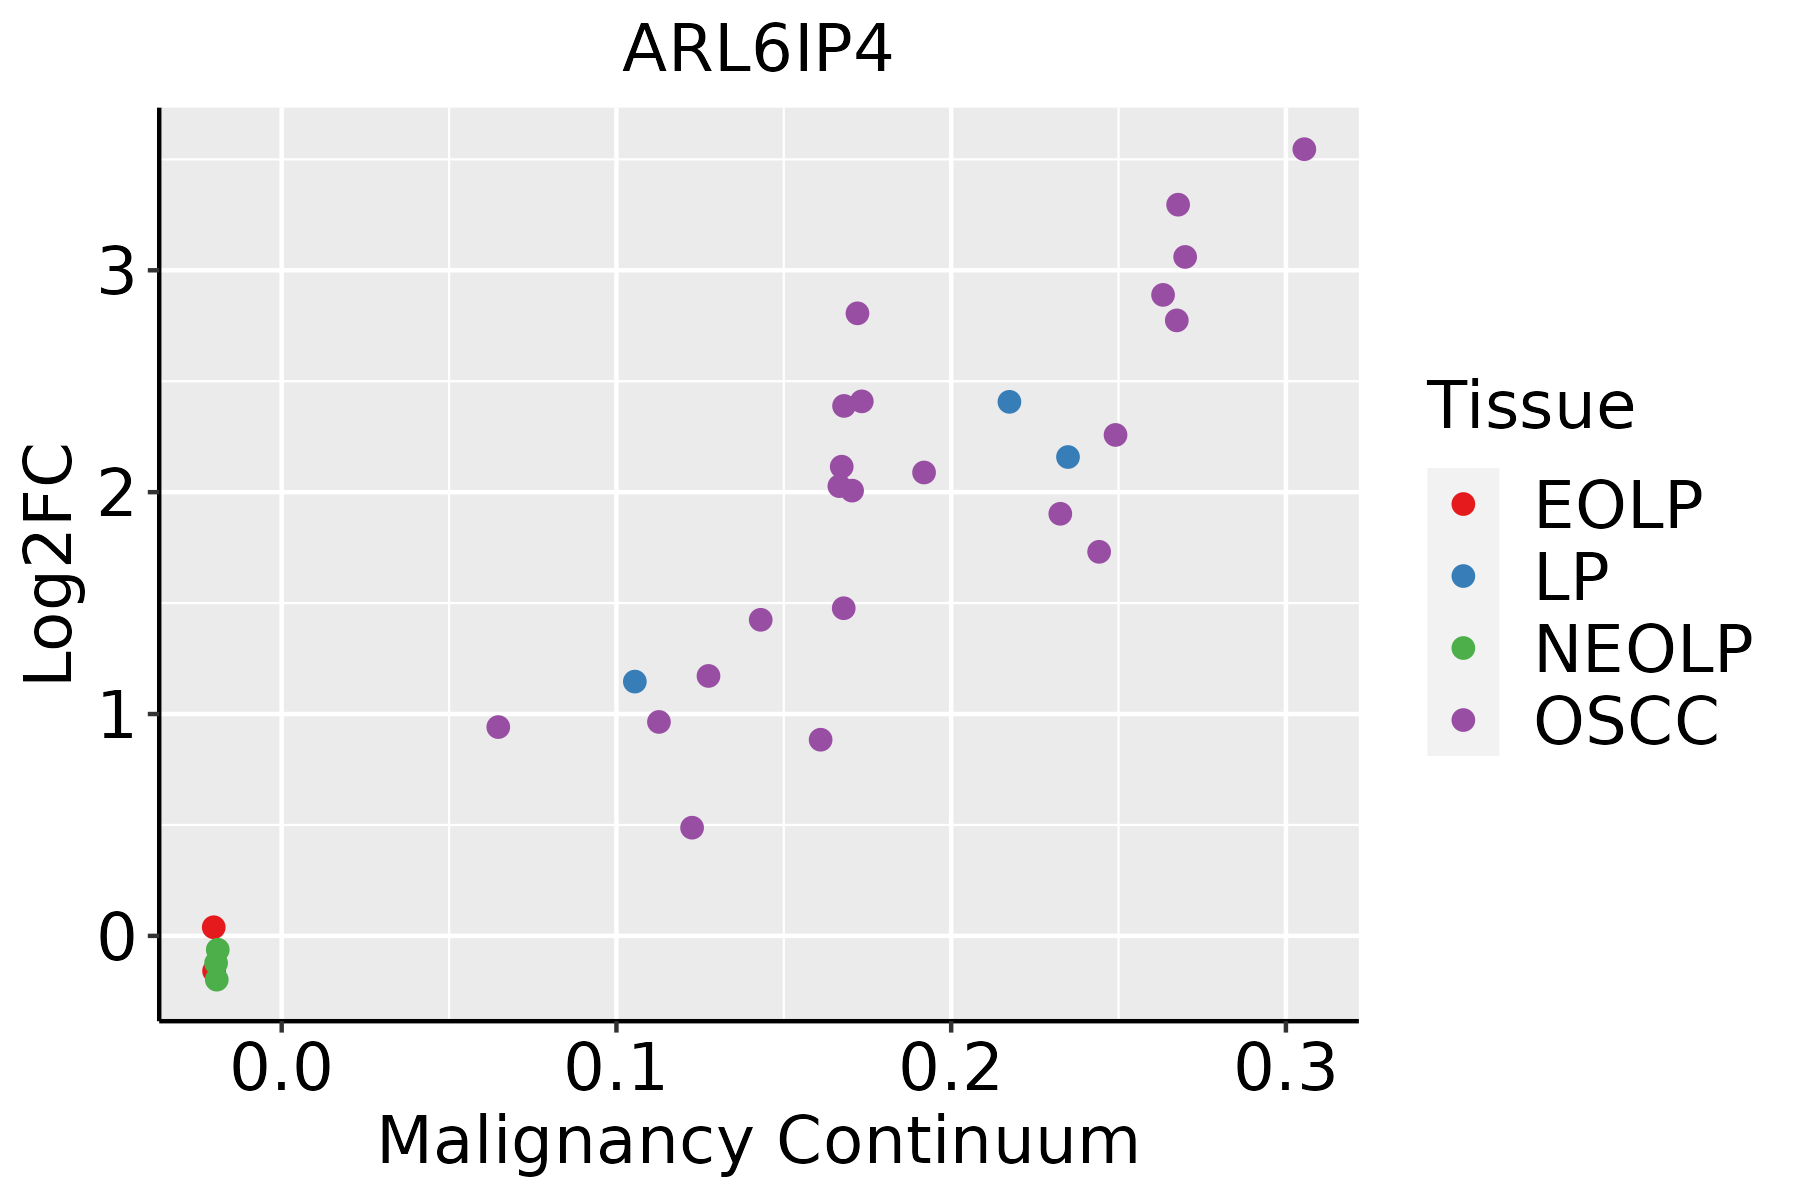 | EOLP: Erosive Oral lichen planus |
| LP: leukoplakia | ||
| NEOLP: Non-erosive oral lichen planus | ||
| OSCC: Oral squamous cell carcinoma | ||
| Prostate | 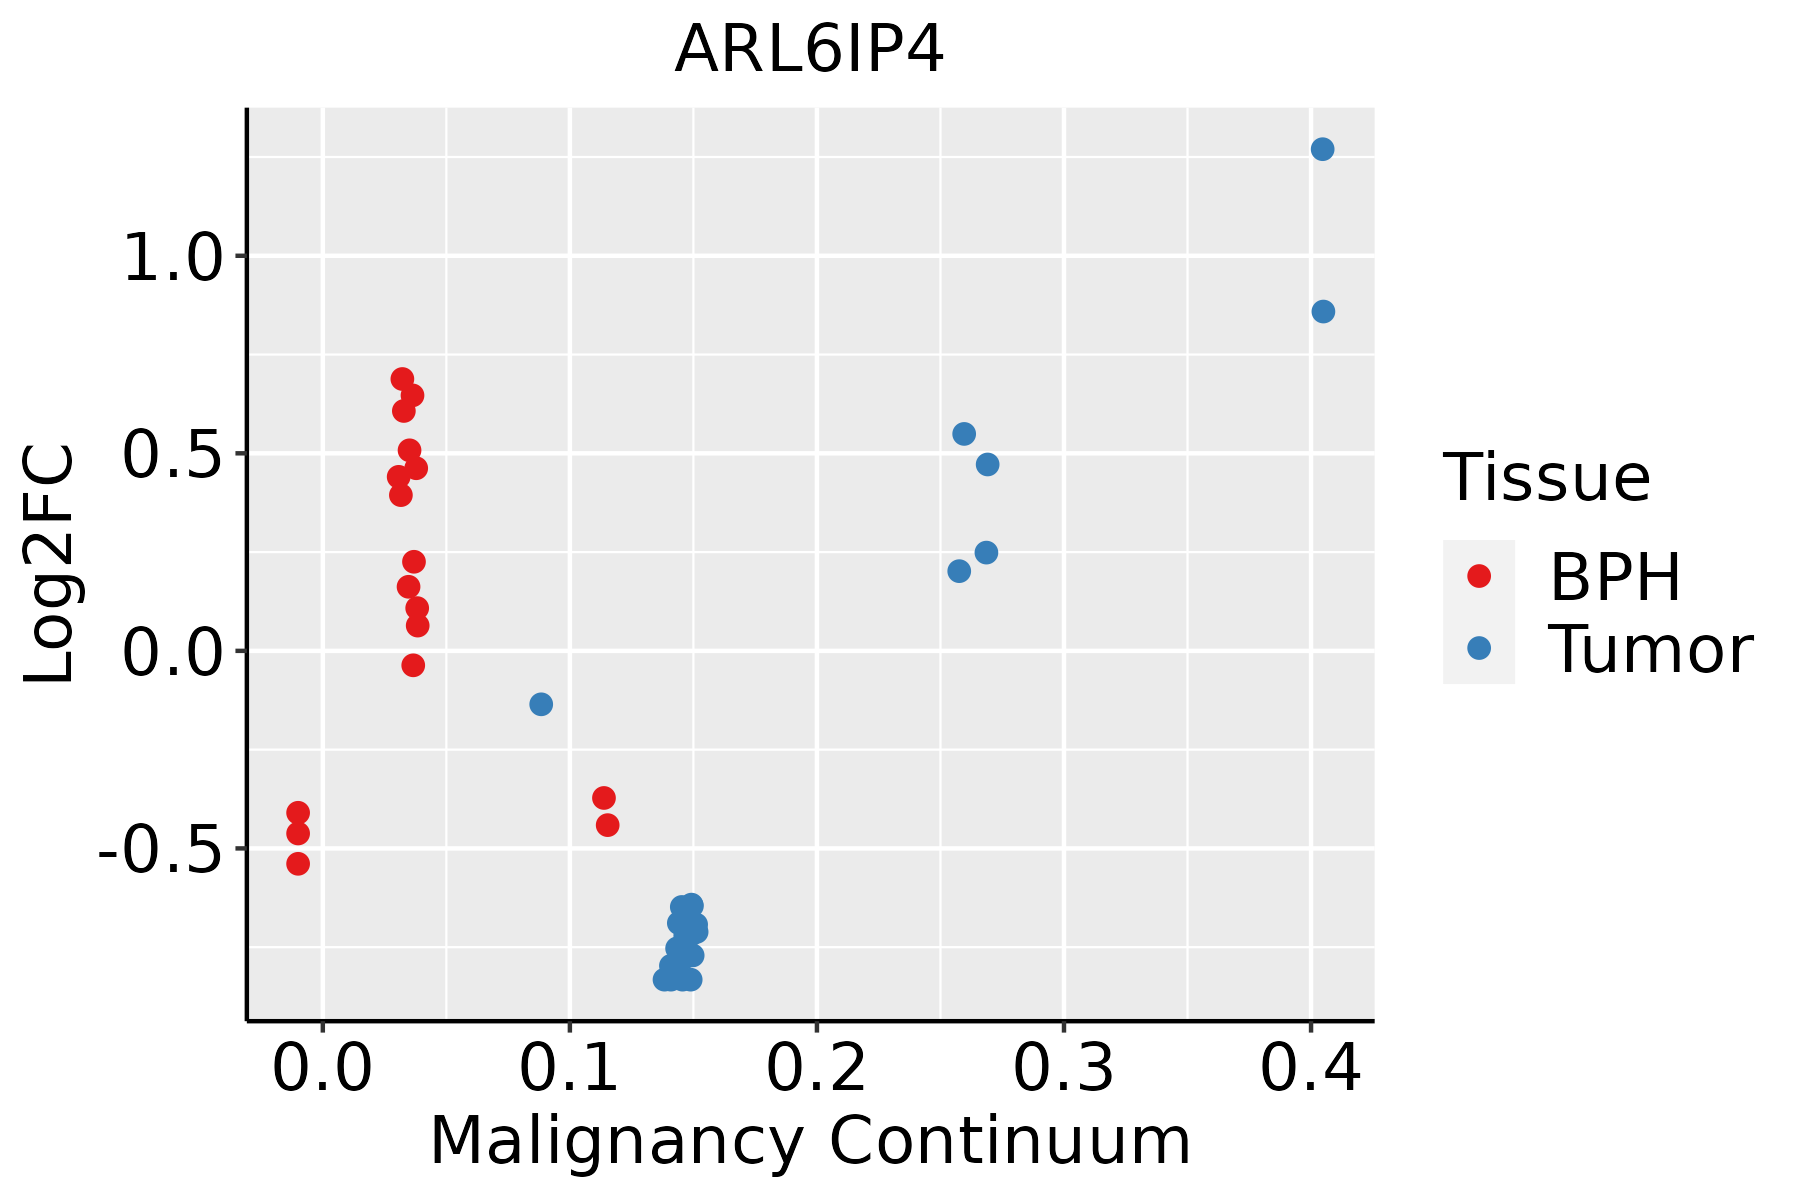 | BPH: Benign Prostatic Hyperplasia |
| Skin | 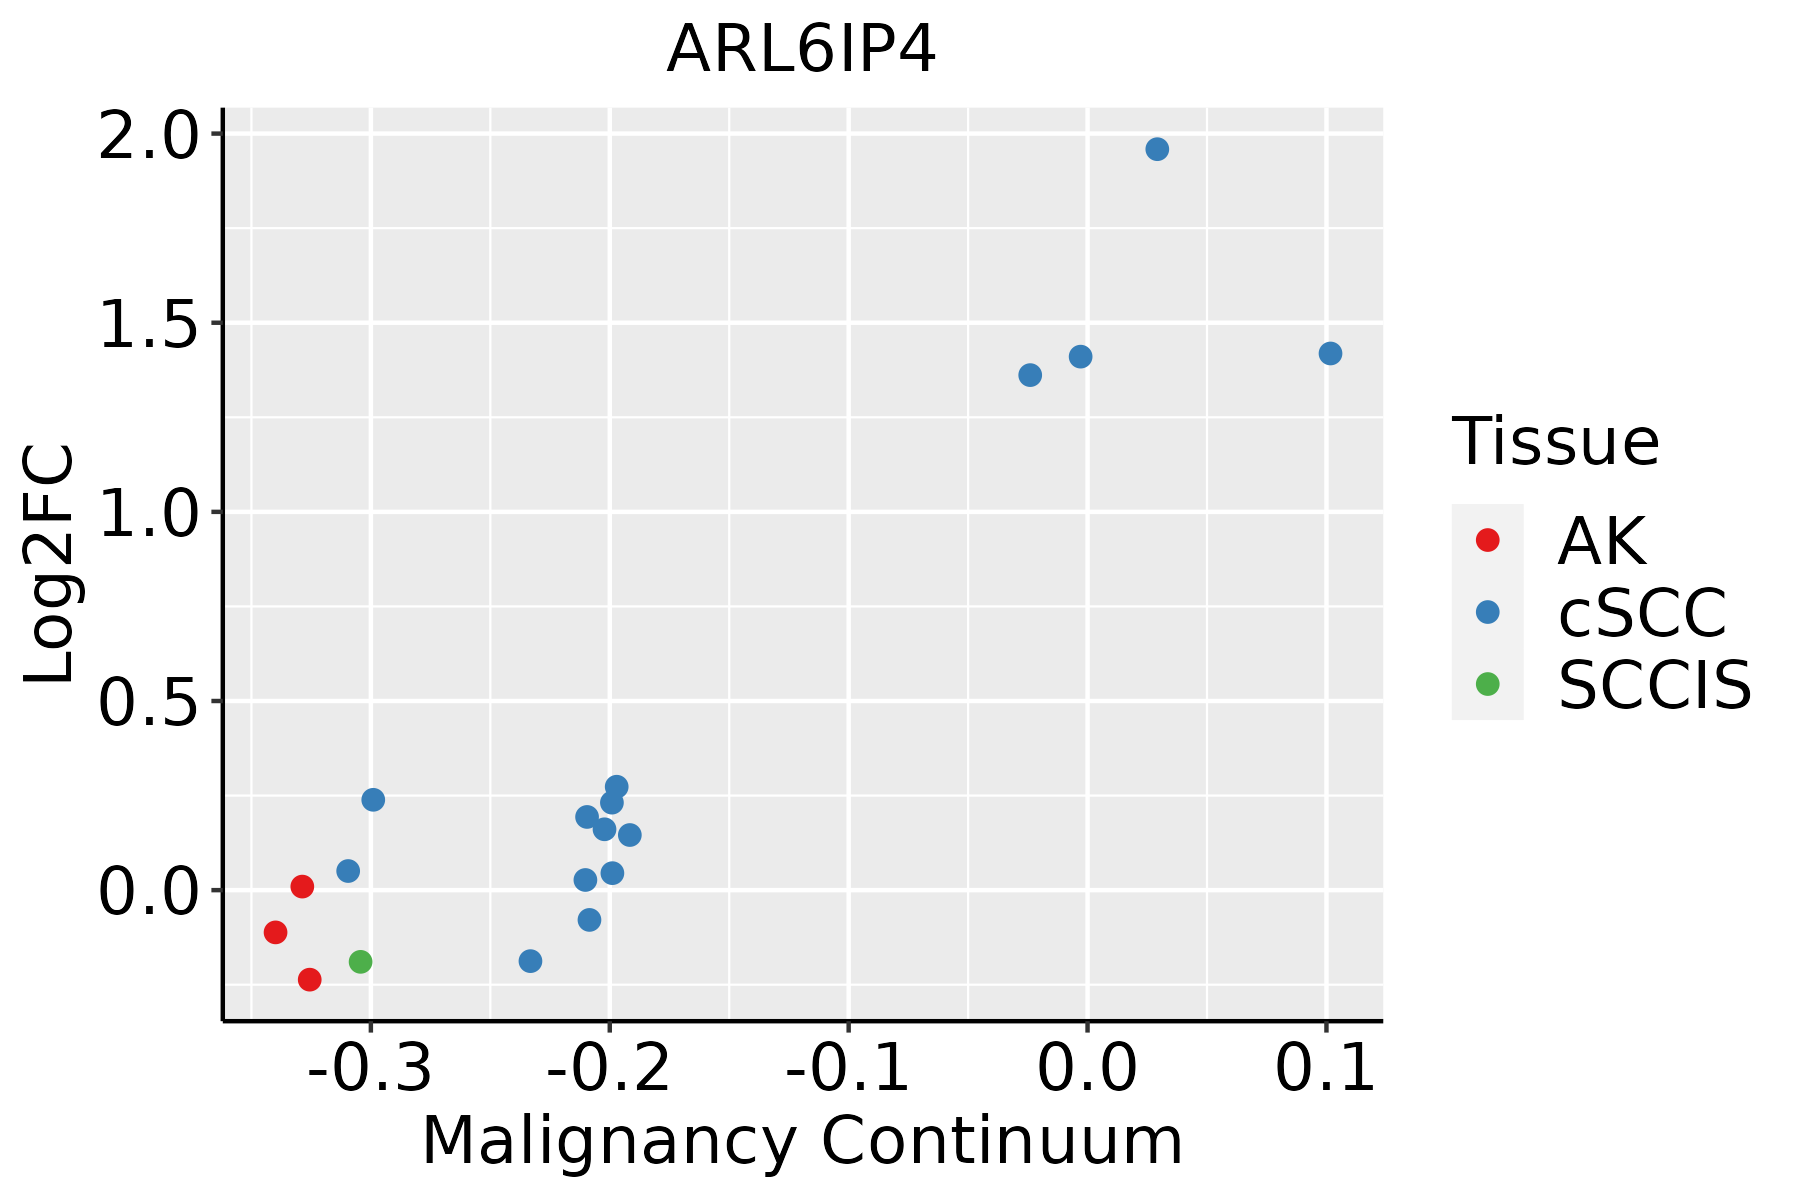 | AK: Actinic keratosis |
| cSCC: Cutaneous squamous cell carcinoma | ||
| SCCIS:squamous cell carcinoma in situ | ||
| Thyroid | 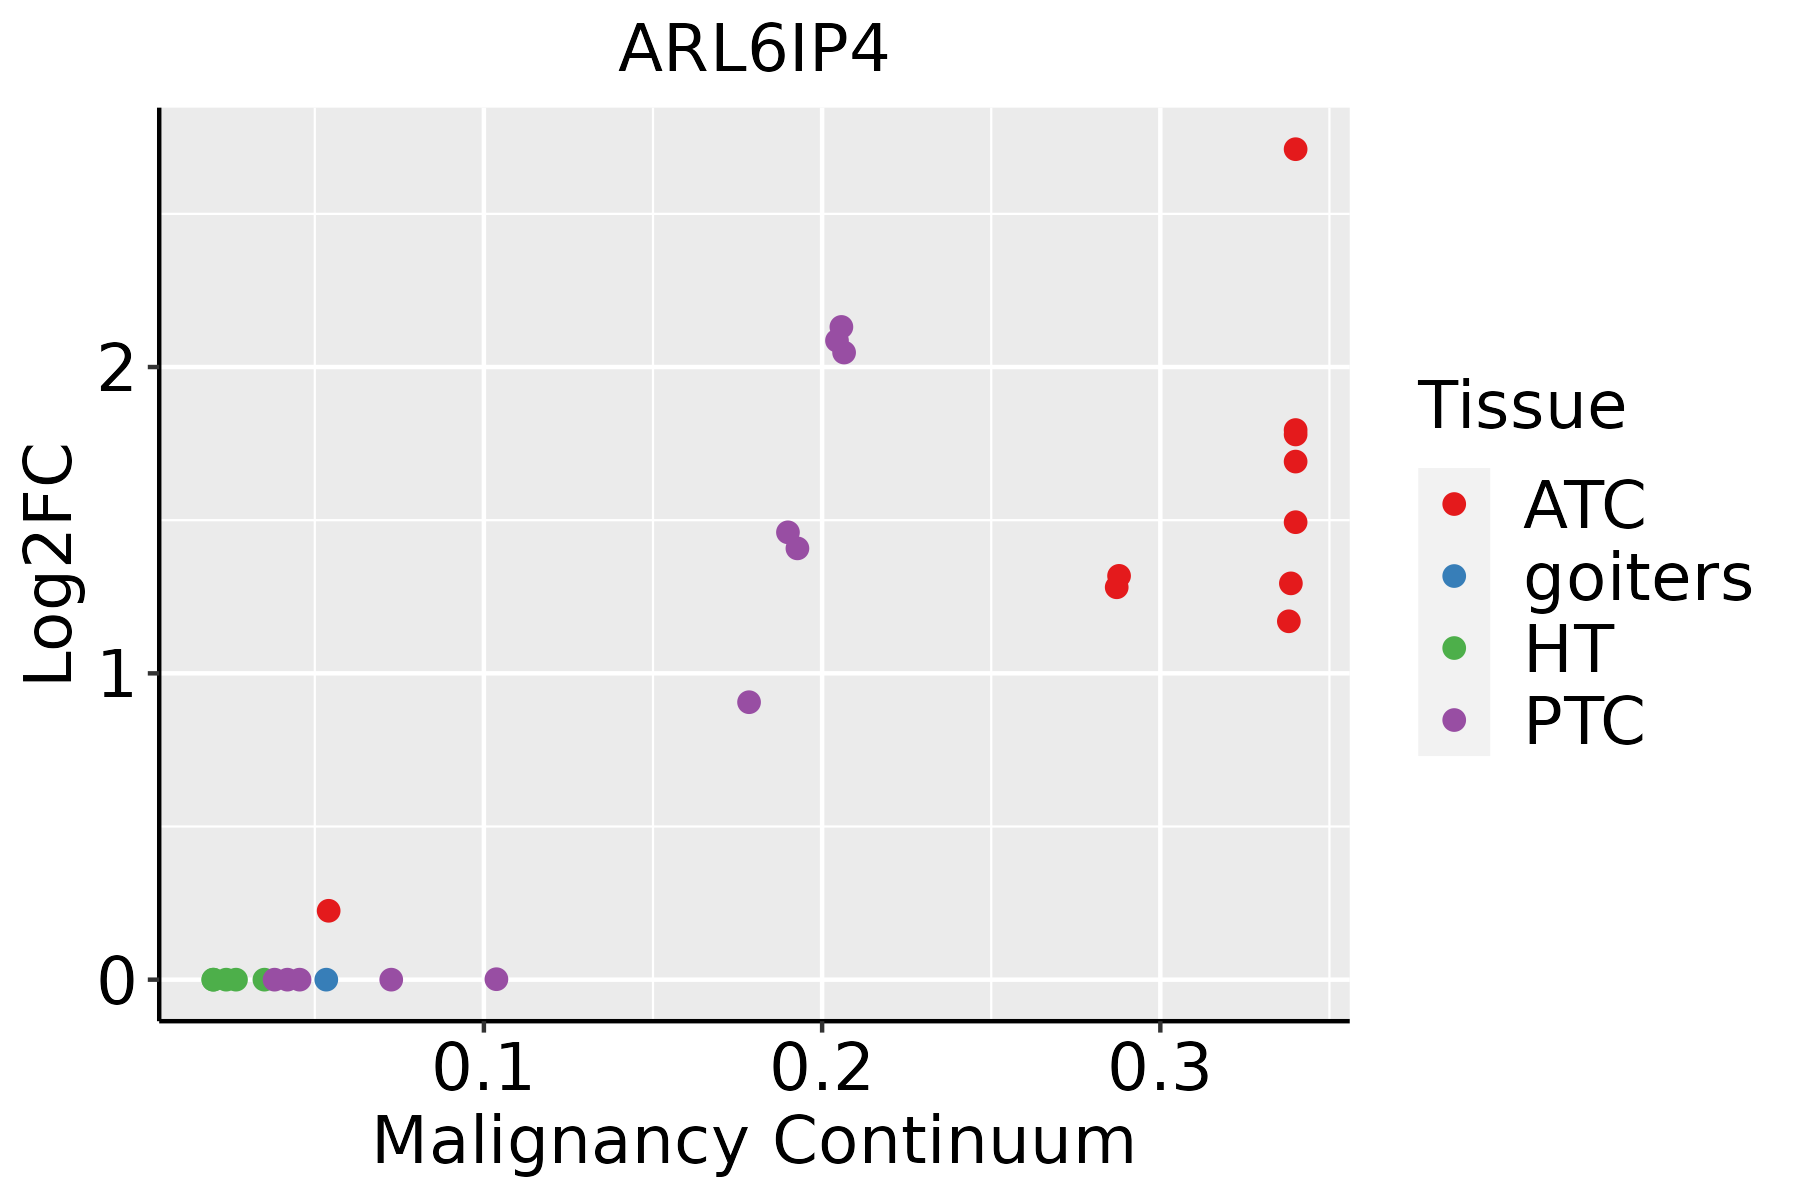 | ATC: Anaplastic thyroid cancer |
| HT: Hashimoto's thyroiditis | ||
| PTC: Papillary thyroid cancer |
| ∗log2FC in expression of this searched gene in stem-like cells from each diseased tissue sample relative to stem-like cells in normal samples in each tissue plotted against the malignancy continuum. Samples are colored based on if they are from different disease stage. |
Top |
Malignant transformation related pathway analysis |
| Find out the enriched GO biological processes and KEGG pathways involved in transition from healthy to precancer to cancer |
| Tissue | Disease Stage | Enriched GO biological Processes |
| Colorectum | AD |  |
| Colorectum | SER |  |
| Colorectum | MSS |  |
| Colorectum | MSI-H |  |
| Colorectum | FAP |  |
| ∗Top 15 enriched GO BP terms are showed in the bar plot of each disease state in each tissue. Each row represents a significant GO biological process which is colored according to the -log10(p.adjust). |
| Page: 1 2 3 4 5 6 7 8 9 |
| GO ID | Tissue | Disease Stage | Description | Gene Ratio | Bg Ratio | pvalue | p.adjust | Count |
| GO:000838010 | Cervix | CC | RNA splicing | 76/2311 | 434/18723 | 9.79e-04 | 8.19e-03 | 76 |
| GO:000838015 | Cervix | N_HPV | RNA splicing | 23/534 | 434/18723 | 3.44e-03 | 2.80e-02 | 23 |
| GO:000838016 | Endometrium | AEH | RNA splicing | 111/2100 | 434/18723 | 2.42e-17 | 1.12e-14 | 111 |
| GO:000838017 | Endometrium | EEC | RNA splicing | 111/2168 | 434/18723 | 2.45e-16 | 1.13e-13 | 111 |
| GO:000838026 | Esophagus | HGIN | RNA splicing | 160/2587 | 434/18723 | 3.74e-34 | 1.12e-30 | 160 |
| GO:0008380111 | Esophagus | ESCC | RNA splicing | 336/8552 | 434/18723 | 1.74e-42 | 3.67e-39 | 336 |
| GO:000838012 | Liver | Cirrhotic | RNA splicing | 229/4634 | 434/18723 | 9.13e-37 | 2.86e-33 | 229 |
| GO:000838022 | Liver | HCC | RNA splicing | 313/7958 | 434/18723 | 1.36e-36 | 1.73e-33 | 313 |
| GO:000838032 | Liver | Cyst | RNA splicing | 31/496 | 434/18723 | 6.22e-07 | 6.04e-05 | 31 |
| GO:00083808 | Lung | IAC | RNA splicing | 75/2061 | 434/18723 | 4.89e-05 | 1.12e-03 | 75 |
| GO:000838013 | Lung | AIS | RNA splicing | 68/1849 | 434/18723 | 8.50e-05 | 2.11e-03 | 68 |
| GO:000838023 | Lung | MIAC | RNA splicing | 44/967 | 434/18723 | 1.56e-05 | 1.07e-03 | 44 |
| GO:000838020 | Oral cavity | OSCC | RNA splicing | 308/7305 | 434/18723 | 2.43e-42 | 7.70e-39 | 308 |
| GO:0008380110 | Oral cavity | LP | RNA splicing | 237/4623 | 434/18723 | 1.82e-41 | 3.79e-38 | 237 |
| GO:000838018 | Prostate | BPH | RNA splicing | 147/3107 | 434/18723 | 5.17e-19 | 2.29e-16 | 147 |
| GO:000838019 | Prostate | Tumor | RNA splicing | 153/3246 | 434/18723 | 9.15e-20 | 5.79e-17 | 153 |
| GO:0008380112 | Skin | cSCC | RNA splicing | 263/4864 | 434/18723 | 2.45e-53 | 5.13e-50 | 263 |
| GO:00083806 | Stomach | CAG with IM | RNA splicing | 39/1050 | 434/18723 | 2.55e-03 | 2.49e-02 | 39 |
| GO:000838011 | Stomach | CSG | RNA splicing | 40/1034 | 434/18723 | 1.07e-03 | 1.35e-02 | 40 |
| GO:000838021 | Stomach | CAG | RNA splicing | 32/552 | 434/18723 | 2.08e-06 | 1.16e-04 | 32 |
| Page: 1 2 |
| Pathway ID | Tissue | Disease Stage | Description | Gene Ratio | Bg Ratio | pvalue | p.adjust | qvalue | Count |
| Page: 1 |
Top |
Cell-cell communication analysis |
| Identification of potential cell-cell interactions between two cell types and their ligand-receptor pairs for different disease states |
| Ligand | Receptor | LRpair | Pathway | Tissue | Disease Stage |
| Page: 1 |
Top |
Single-cell gene regulatory network inference analysis |
| Find out the significant the regulons (TFs) and the target genes of each regulon across cell types for different disease states |
| TF | Cell Type | Tissue | Disease Stage | Target Gene | RSS | Regulon Activity |
| ∗The dot plots of a searched regulon are shown for all cell subpopulations in each disease state of each tissue based on the regulon specific score inferred using pySCENIC and by calculating the average expression. |
| Page: 1 |
Top |
Somatic mutation of malignant transformation related genes |
| Annotation of somatic variants for genes involved in malignant transformation |
| Hugo Symbol | Variant Class | Variant Classification | dbSNP RS | HGVSc | HGVSp | HGVSp Short | SWISSPROT | BIOTYPE | SIFT | PolyPhen | Tumor Sample Barcode | Tissue | Histology | Sex | Age | Stage | Therapy Types | Drugs | Outcome |
| ARL6IP4 | SNV | Missense_Mutation | c.1093C>G | p.Gln365Glu | p.Q365E | Q66PJ3 | protein_coding | deleterious_low_confidence(0) | probably_damaging(0.953) | TCGA-E2-A1LL-01 | Breast | breast invasive carcinoma | Female | >=65 | III/IV | Chemotherapy | docetaxel | PD | |
| ARL6IP4 | SNV | Missense_Mutation | novel | c.697N>A | p.Ala233Thr | p.A233T | Q66PJ3 | protein_coding | tolerated_low_confidence(0.16) | benign(0.011) | TCGA-2W-A8YY-01 | Cervix | cervical & endocervical cancer | Female | <65 | I/II | Chemotherapy | cisplatin | CR |
| ARL6IP4 | SNV | Missense_Mutation | novel | c.799N>C | p.Ser267Pro | p.S267P | Q66PJ3 | protein_coding | deleterious_low_confidence(0) | probably_damaging(0.998) | TCGA-AA-3488-01 | Colorectum | colon adenocarcinoma | Male | <65 | III/IV | Unknown | Unknown | PD |
| ARL6IP4 | SNV | Missense_Mutation | c.985T>C | p.Trp329Arg | p.W329R | Q66PJ3 | protein_coding | deleterious_low_confidence(0) | probably_damaging(0.983) | TCGA-AM-5821-01 | Colorectum | colon adenocarcinoma | Female | >=65 | I/II | Unknown | Unknown | SD | |
| ARL6IP4 | SNV | Missense_Mutation | novel | c.160C>T | p.Pro54Ser | p.P54S | Q66PJ3 | protein_coding | tolerated_low_confidence(0.45) | possibly_damaging(0.81) | TCGA-CM-5861-01 | Colorectum | colon adenocarcinoma | Female | <65 | I/II | Unknown | Unknown | PD |
| ARL6IP4 | SNV | Missense_Mutation | c.643N>T | p.Asp215Tyr | p.D215Y | Q66PJ3 | protein_coding | deleterious_low_confidence(0.01) | possibly_damaging(0.787) | TCGA-AP-A0LM-01 | Endometrium | uterine corpus endometrioid carcinoma | Female | <65 | III/IV | Chemotherapy | cisplatin | SD | |
| ARL6IP4 | SNV | Missense_Mutation | rs374152314 | c.550G>A | p.Ala184Thr | p.A184T | Q66PJ3 | protein_coding | deleterious_low_confidence(0.01) | possibly_damaging(0.625) | TCGA-AX-A0IZ-01 | Endometrium | uterine corpus endometrioid carcinoma | Female | <65 | I/II | Unknown | Unknown | SD |
| ARL6IP4 | SNV | Missense_Mutation | novel | c.988N>T | p.His330Tyr | p.H330Y | Q66PJ3 | protein_coding | deleterious_low_confidence(0) | possibly_damaging(0.871) | TCGA-AX-A1CE-01 | Endometrium | uterine corpus endometrioid carcinoma | Female | <65 | I/II | Unspecific | Paclitaxel | SD |
| ARL6IP4 | SNV | Missense_Mutation | novel | c.930N>T | p.Lys310Asn | p.K310N | Q66PJ3 | protein_coding | deleterious_low_confidence(0.02) | probably_damaging(0.985) | TCGA-B5-A11E-01 | Endometrium | uterine corpus endometrioid carcinoma | Female | <65 | I/II | Unknown | Unknown | SD |
| ARL6IP4 | SNV | Missense_Mutation | novel | c.897G>T | p.Lys299Asn | p.K299N | Q66PJ3 | protein_coding | deleterious_low_confidence(0) | possibly_damaging(0.787) | TCGA-BS-A0UV-01 | Endometrium | uterine corpus endometrioid carcinoma | Female | <65 | III/IV | Unknown | Unknown | SD |
| Page: 1 2 |
Top |
Related drugs of malignant transformation related genes |
| Identification of chemicals and drugs interact with genes involved in malignant transfromation |
| (DGIdb 4.0) |
| Entrez ID | Symbol | Category | Interaction Types | Drug Claim Name | Drug Name | PMIDs |
| Page: 1 |

Copyright 2023-Present -The University of Texas Health Science Center at Houston |