
|
|||||
|
 | |
| |
| |
| |
| |
| |
|
Gene: ARL5B |
Gene summary for ARL5B |
| Gene information | Species | Human | Gene symbol | ARL5B | Gene ID | 221079 |
| Gene name | ADP ribosylation factor like GTPase 5B | |
| Gene Alias | ARL8 | |
| Cytomap | 10p12.31 | |
| Gene Type | protein-coding | GO ID | GO:0006810 | UniProtAcc | B0YIW9 |
Top |
Malignant transformation analysis |
| Identification of the aberrant gene expression in precancerous and cancerous lesions by comparing the gene expression of stem-like cells in diseased tissues with normal stem cells |
| Entrez ID | Symbol | Replicates | Species | Organ | Tissue | Adj P-value | Log2FC | Malignancy |
| 221079 | ARL5B | LZE4T | Human | Esophagus | ESCC | 3.72e-09 | 1.88e-01 | 0.0811 |
| 221079 | ARL5B | LZE5T | Human | Esophagus | ESCC | 3.69e-05 | 1.88e-01 | 0.0514 |
| 221079 | ARL5B | LZE8T | Human | Esophagus | ESCC | 1.42e-09 | 9.74e-02 | 0.067 |
| 221079 | ARL5B | LZE20T | Human | Esophagus | ESCC | 1.42e-06 | -4.17e-02 | 0.0662 |
| 221079 | ARL5B | LZE24T | Human | Esophagus | ESCC | 9.71e-16 | 7.94e-01 | 0.0596 |
| 221079 | ARL5B | LZE21T | Human | Esophagus | ESCC | 1.08e-09 | 9.60e-02 | 0.0655 |
| 221079 | ARL5B | P2T-E | Human | Esophagus | ESCC | 1.09e-17 | 5.31e-01 | 0.1177 |
| 221079 | ARL5B | P4T-E | Human | Esophagus | ESCC | 2.85e-18 | 6.93e-01 | 0.1323 |
| 221079 | ARL5B | P5T-E | Human | Esophagus | ESCC | 1.41e-03 | 3.09e-01 | 0.1327 |
| 221079 | ARL5B | P8T-E | Human | Esophagus | ESCC | 1.01e-14 | 5.55e-01 | 0.0889 |
| 221079 | ARL5B | P9T-E | Human | Esophagus | ESCC | 4.42e-02 | 3.96e-02 | 0.1131 |
| 221079 | ARL5B | P10T-E | Human | Esophagus | ESCC | 7.16e-19 | 1.71e-03 | 0.116 |
| 221079 | ARL5B | P11T-E | Human | Esophagus | ESCC | 1.37e-06 | 4.63e-01 | 0.1426 |
| 221079 | ARL5B | P12T-E | Human | Esophagus | ESCC | 1.27e-24 | 7.26e-01 | 0.1122 |
| 221079 | ARL5B | P15T-E | Human | Esophagus | ESCC | 1.82e-10 | 4.74e-01 | 0.1149 |
| 221079 | ARL5B | P16T-E | Human | Esophagus | ESCC | 1.68e-15 | 3.00e-01 | 0.1153 |
| 221079 | ARL5B | P20T-E | Human | Esophagus | ESCC | 2.06e-06 | 2.21e-01 | 0.1124 |
| 221079 | ARL5B | P21T-E | Human | Esophagus | ESCC | 4.34e-09 | 3.28e-01 | 0.1617 |
| 221079 | ARL5B | P22T-E | Human | Esophagus | ESCC | 6.05e-13 | -3.78e-02 | 0.1236 |
| 221079 | ARL5B | P23T-E | Human | Esophagus | ESCC | 5.16e-08 | 2.31e-01 | 0.108 |
| Page: 1 2 3 4 |
| Tissue | Expression Dynamics | Abbreviation |
| Esophagus | 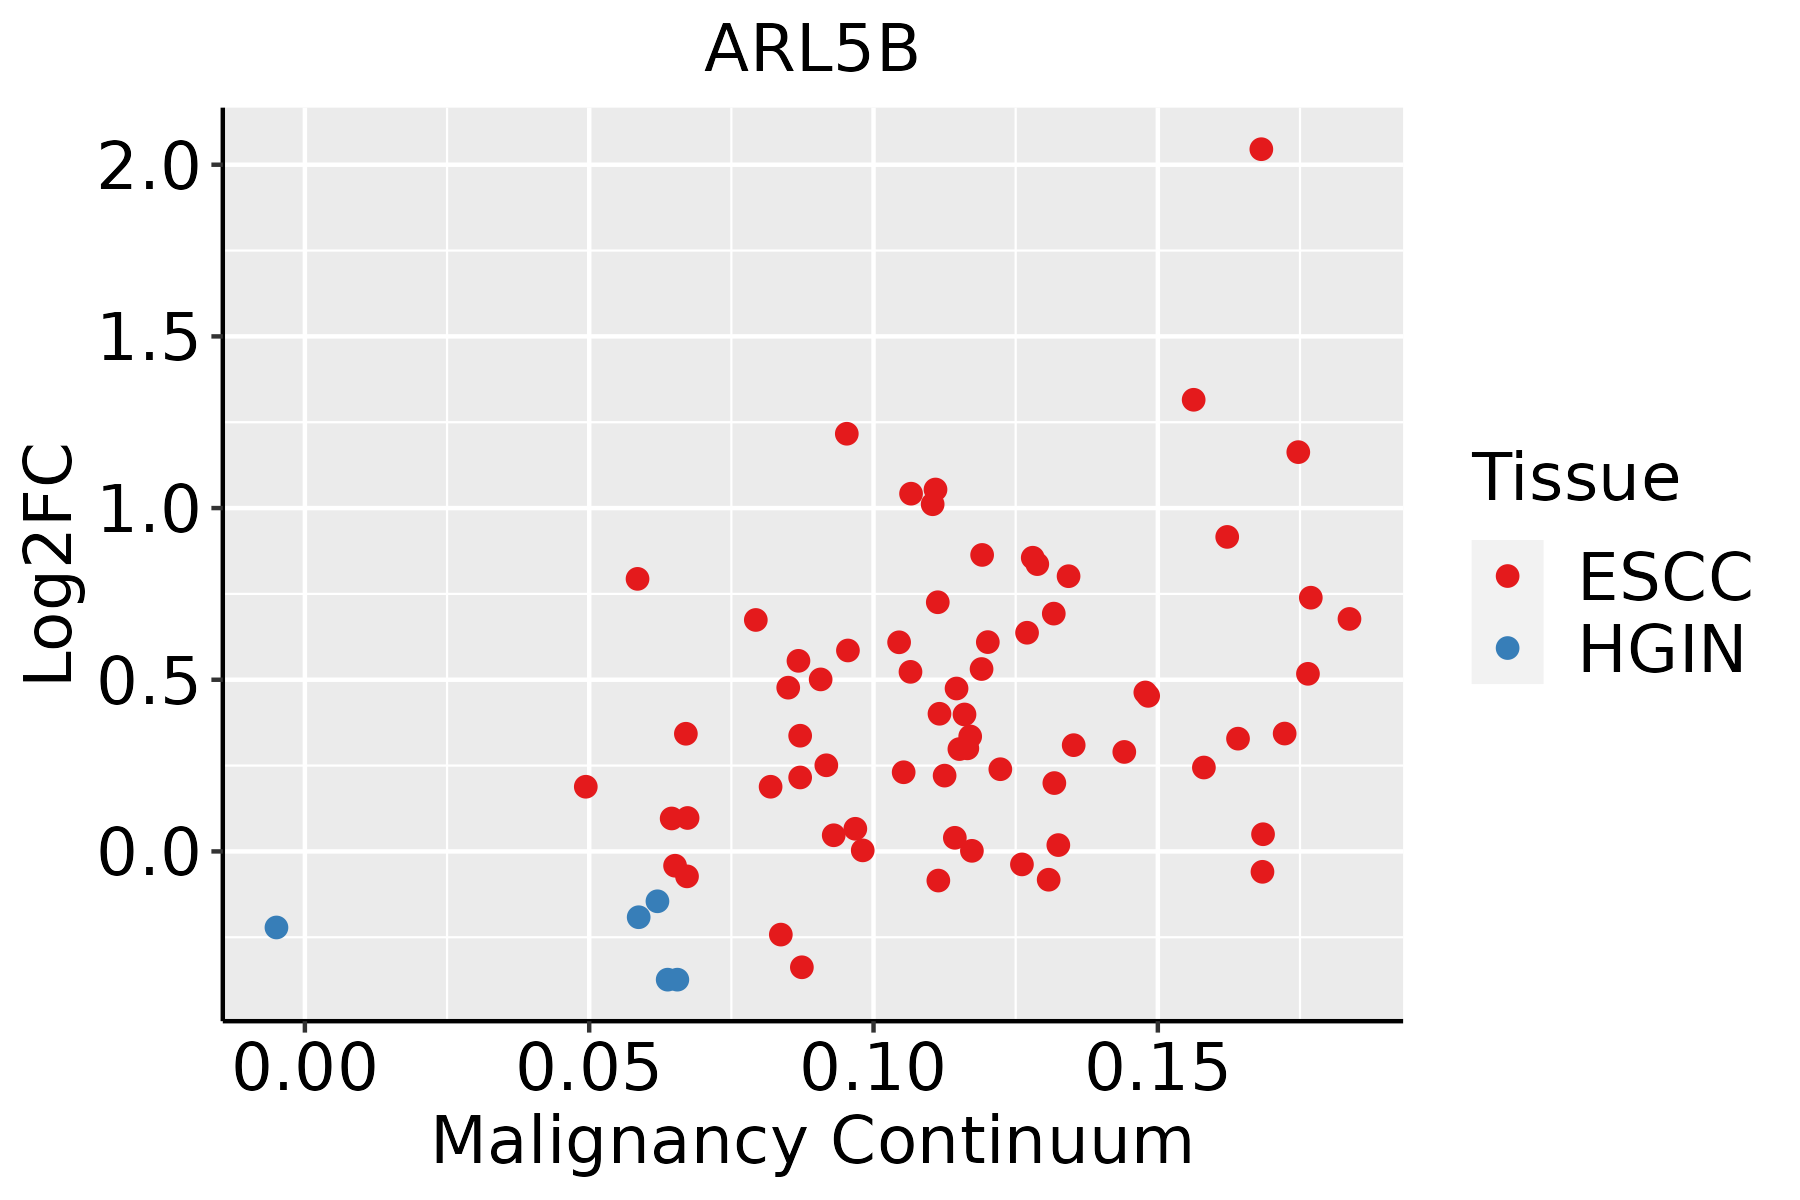 | ESCC: Esophageal squamous cell carcinoma |
| HGIN: High-grade intraepithelial neoplasias | ||
| LGIN: Low-grade intraepithelial neoplasias | ||
| Liver | 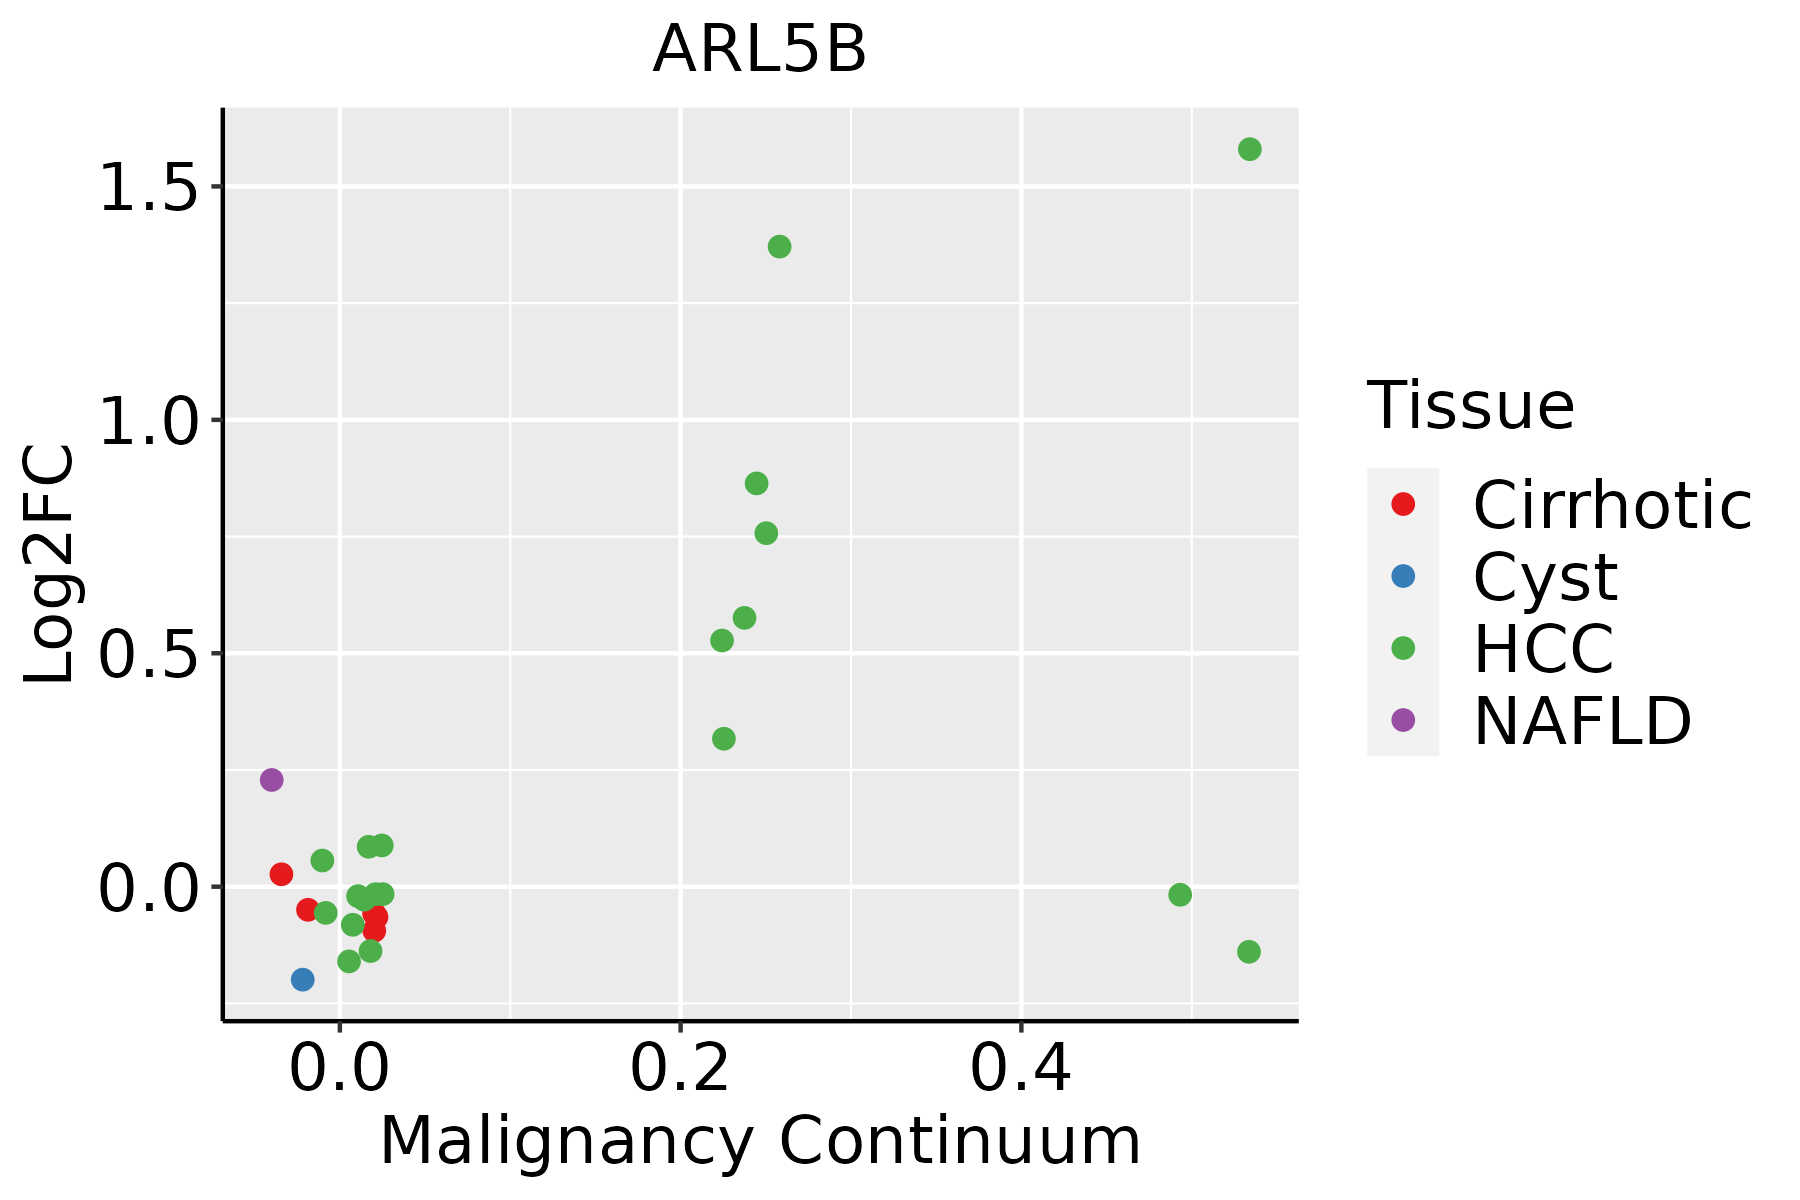 | HCC: Hepatocellular carcinoma |
| NAFLD: Non-alcoholic fatty liver disease | ||
| Lung | 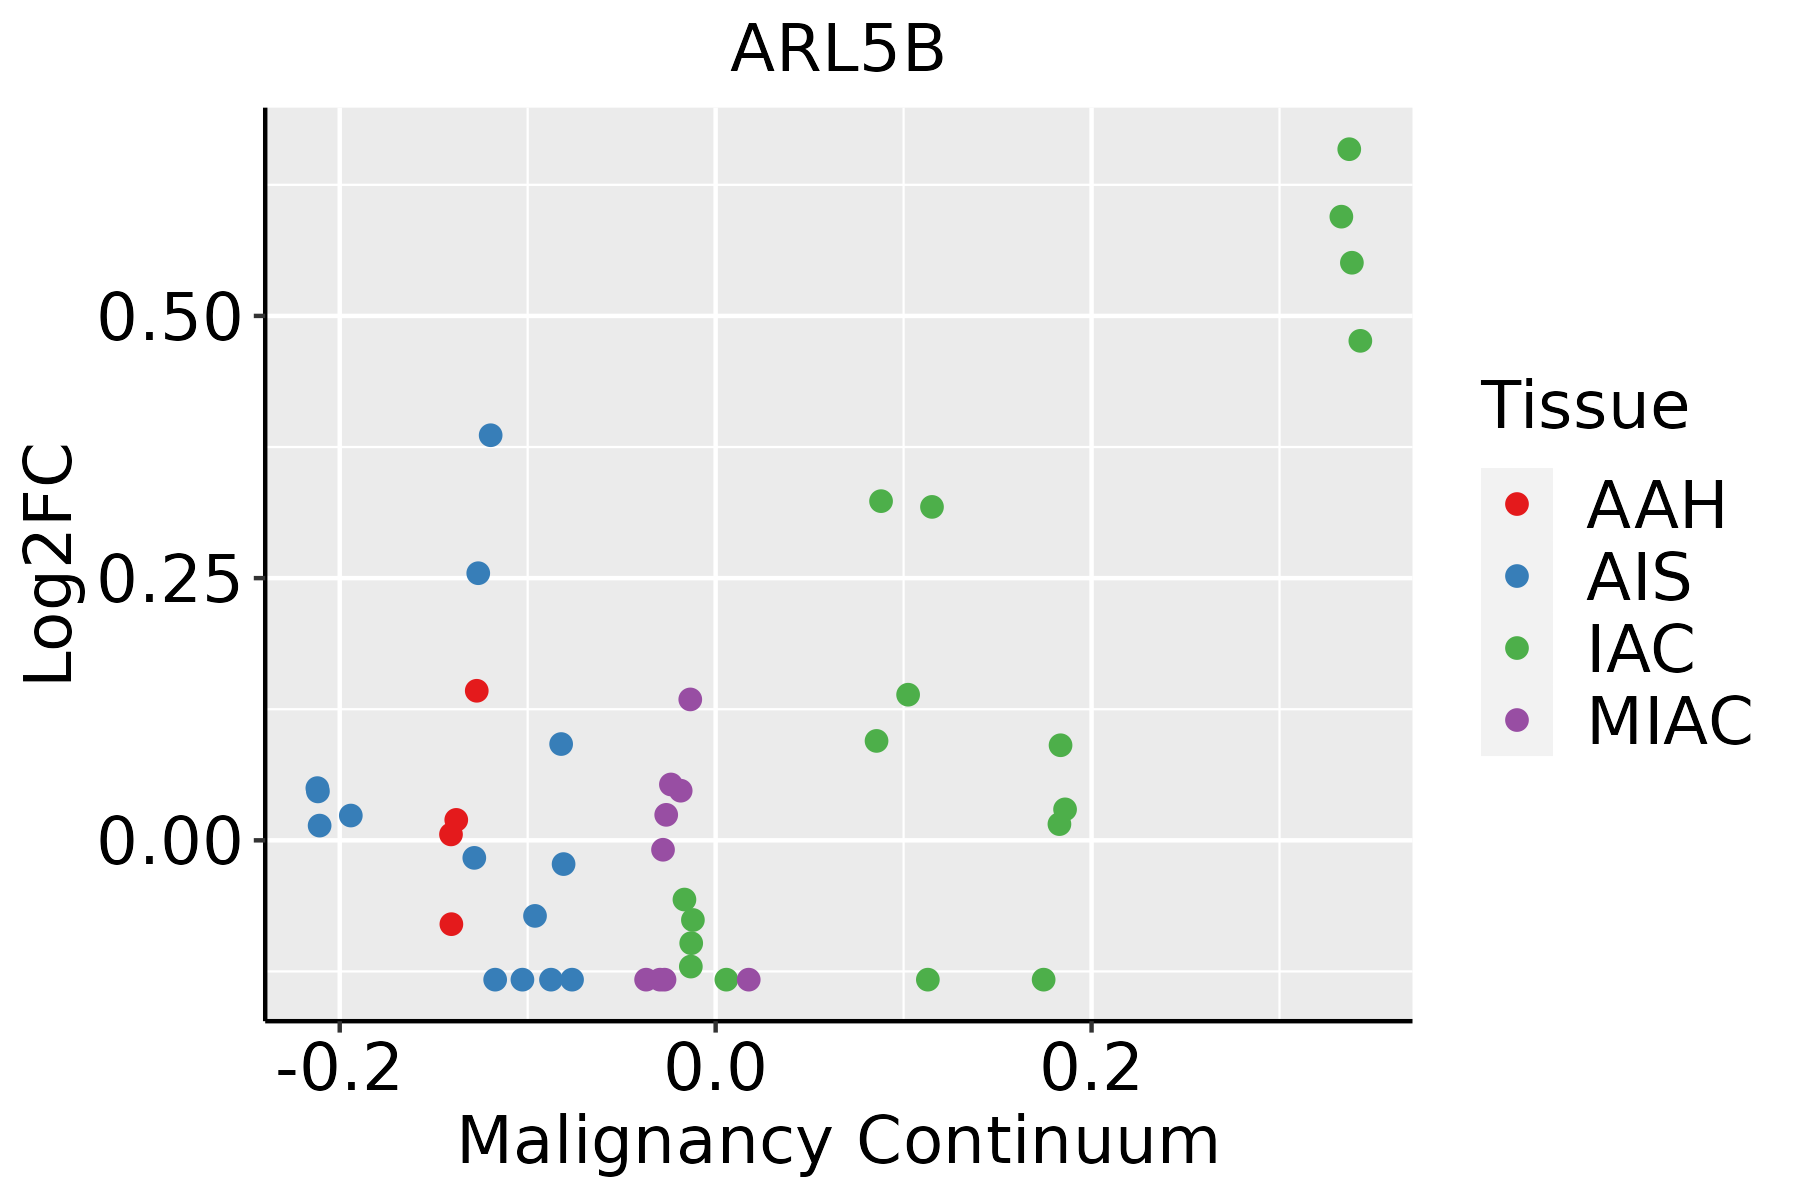 | AAH: Atypical adenomatous hyperplasia |
| AIS: Adenocarcinoma in situ | ||
| IAC: Invasive lung adenocarcinoma | ||
| MIA: Minimally invasive adenocarcinoma | ||
| Oral Cavity | 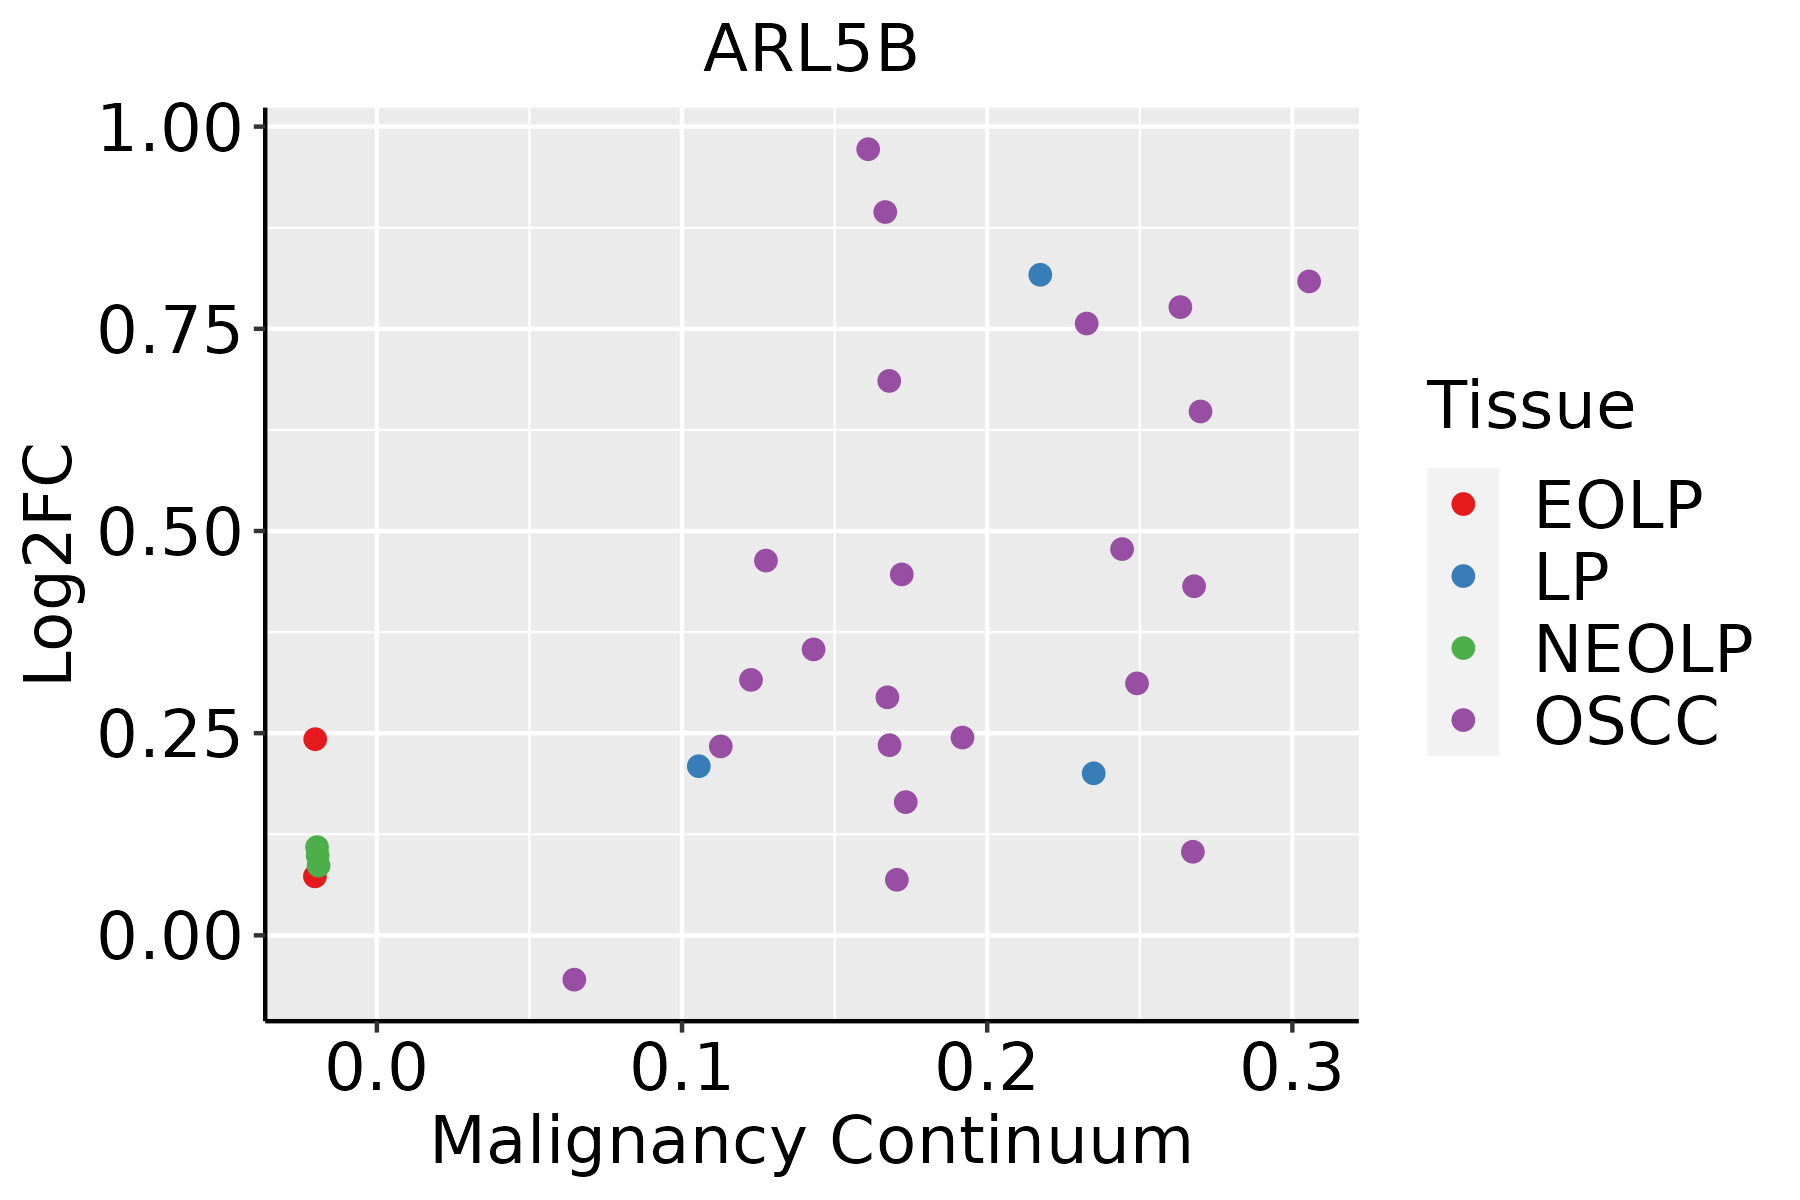 | EOLP: Erosive Oral lichen planus |
| LP: leukoplakia | ||
| NEOLP: Non-erosive oral lichen planus | ||
| OSCC: Oral squamous cell carcinoma |
| ∗log2FC in expression of this searched gene in stem-like cells from each diseased tissue sample relative to stem-like cells in normal samples in each tissue plotted against the malignancy continuum. Samples are colored based on if they are from different disease stage. |
Top |
Malignant transformation related pathway analysis |
| Find out the enriched GO biological processes and KEGG pathways involved in transition from healthy to precancer to cancer |
| Tissue | Disease Stage | Enriched GO biological Processes |
| Colorectum | AD |  |
| Colorectum | SER |  |
| Colorectum | MSS |  |
| Colorectum | MSI-H |  |
| Colorectum | FAP |  |
| ∗Top 15 enriched GO BP terms are showed in the bar plot of each disease state in each tissue. Each row represents a significant GO biological process which is colored according to the -log10(p.adjust). |
| Page: 1 2 3 4 5 6 7 8 9 |
| GO ID | Tissue | Disease Stage | Description | Gene Ratio | Bg Ratio | pvalue | p.adjust | Count |
| GO:00340676 | Esophagus | ESCC | protein localization to Golgi apparatus | 23/8552 | 29/18723 | 2.25e-04 | 1.40e-03 | 23 |
| GO:00340673 | Liver | NAFLD | protein localization to Golgi apparatus | 9/1882 | 29/18723 | 1.59e-03 | 1.71e-02 | 9 |
| GO:003406721 | Liver | HCC | protein localization to Golgi apparatus | 23/7958 | 29/18723 | 5.86e-05 | 5.38e-04 | 23 |
| GO:00340675 | Oral cavity | OSCC | protein localization to Golgi apparatus | 21/7305 | 29/18723 | 2.73e-04 | 1.73e-03 | 21 |
| GO:003406722 | Oral cavity | EOLP | protein localization to Golgi apparatus | 11/2218 | 29/18723 | 2.83e-04 | 2.70e-03 | 11 |
| Page: 1 |
| Pathway ID | Tissue | Disease Stage | Description | Gene Ratio | Bg Ratio | pvalue | p.adjust | qvalue | Count |
| Page: 1 |
Top |
Cell-cell communication analysis |
| Identification of potential cell-cell interactions between two cell types and their ligand-receptor pairs for different disease states |
| Ligand | Receptor | LRpair | Pathway | Tissue | Disease Stage |
| Page: 1 |
Top |
Single-cell gene regulatory network inference analysis |
| Find out the significant the regulons (TFs) and the target genes of each regulon across cell types for different disease states |
| TF | Cell Type | Tissue | Disease Stage | Target Gene | RSS | Regulon Activity |
| ∗The dot plots of a searched regulon are shown for all cell subpopulations in each disease state of each tissue based on the regulon specific score inferred using pySCENIC and by calculating the average expression. |
| Page: 1 |
Top |
Somatic mutation of malignant transformation related genes |
| Annotation of somatic variants for genes involved in malignant transformation |
| Hugo Symbol | Variant Class | Variant Classification | dbSNP RS | HGVSc | HGVSp | HGVSp Short | SWISSPROT | BIOTYPE | SIFT | PolyPhen | Tumor Sample Barcode | Tissue | Histology | Sex | Age | Stage | Therapy Types | Drugs | Outcome |
| ARL5B | SNV | Missense_Mutation | c.29N>T | p.Ser10Ile | p.S10I | Q96KC2 | protein_coding | deleterious(0.01) | benign(0.281) | TCGA-A8-A09Z-01 | Breast | breast invasive carcinoma | Female | >=65 | I/II | Unknown | Unknown | SD | |
| ARL5B | SNV | Missense_Mutation | novel | c.387G>A | p.Met129Ile | p.M129I | Q96KC2 | protein_coding | tolerated(0.25) | benign(0) | TCGA-BH-A2L8-01 | Breast | breast invasive carcinoma | Female | <65 | I/II | Chemotherapy | cytoxan | CR |
| ARL5B | SNV | Missense_Mutation | rs372696681 | c.416N>T | p.Ser139Leu | p.S139L | Q96KC2 | protein_coding | deleterious(0) | probably_damaging(0.98) | TCGA-A6-2686-01 | Colorectum | colon adenocarcinoma | Female | >=65 | I/II | Unknown | Unknown | SD |
| ARL5B | SNV | Missense_Mutation | novel | c.88N>G | p.Thr30Ala | p.T30A | Q96KC2 | protein_coding | deleterious(0.01) | possibly_damaging(0.472) | TCGA-AP-A0LM-01 | Endometrium | uterine corpus endometrioid carcinoma | Female | <65 | III/IV | Chemotherapy | cisplatin | SD |
| ARL5B | SNV | Missense_Mutation | novel | c.112A>G | p.Met38Val | p.M38V | Q96KC2 | protein_coding | tolerated(0.16) | benign(0.009) | TCGA-AX-A3G3-01 | Endometrium | uterine corpus endometrioid carcinoma | Female | <65 | III/IV | Unknown | Unknown | SD |
| ARL5B | SNV | Missense_Mutation | novel | c.293N>T | p.Arg98Leu | p.R98L | Q96KC2 | protein_coding | deleterious(0) | probably_damaging(0.998) | TCGA-B5-A3FC-01 | Endometrium | uterine corpus endometrioid carcinoma | Female | <65 | I/II | Unknown | Unknown | SD |
| ARL5B | SNV | Missense_Mutation | c.400N>G | p.Thr134Ala | p.T134A | Q96KC2 | protein_coding | tolerated(0.05) | benign(0.029) | TCGA-D1-A17Q-01 | Endometrium | uterine corpus endometrioid carcinoma | Female | <65 | I/II | Unknown | Unknown | SD | |
| ARL5B | SNV | Missense_Mutation | rs372696681 | c.416N>T | p.Ser139Leu | p.S139L | Q96KC2 | protein_coding | deleterious(0) | probably_damaging(0.98) | TCGA-EO-A22U-01 | Endometrium | uterine corpus endometrioid carcinoma | Female | >=65 | I/II | Unknown | Unknown | SD |
| ARL5B | SNV | Missense_Mutation | c.205G>A | p.Gly69Ser | p.G69S | Q96KC2 | protein_coding | deleterious(0) | probably_damaging(0.979) | TCGA-DD-A73G-01 | Liver | liver hepatocellular carcinoma | Female | >=65 | I/II | Unknown | Unknown | SD | |
| ARL5B | SNV | Missense_Mutation | c.516N>A | p.Met172Ile | p.M172I | Q96KC2 | protein_coding | tolerated(0.29) | benign(0.003) | TCGA-G3-A3CI-01 | Liver | liver hepatocellular carcinoma | Male | >=65 | I/II | Unknown | Unknown | SD |
| Page: 1 2 |
Top |
Related drugs of malignant transformation related genes |
| Identification of chemicals and drugs interact with genes involved in malignant transfromation |
| (DGIdb 4.0) |
| Entrez ID | Symbol | Category | Interaction Types | Drug Claim Name | Drug Name | PMIDs |
| Page: 1 |

Copyright 2023-Present -The University of Texas Health Science Center at Houston |