
|
|||||
|
 | |
| |
| |
| |
| |
| |
|
Gene: ARL5A |
Gene summary for ARL5A |
| Gene information | Species | Human | Gene symbol | ARL5A | Gene ID | 26225 |
| Gene name | ADP ribosylation factor like GTPase 5A | |
| Gene Alias | ARFLP5 | |
| Cytomap | 2q23.3 | |
| Gene Type | protein-coding | GO ID | GO:0006810 | UniProtAcc | Q9Y689 |
Top |
Malignant transformation analysis |
| Identification of the aberrant gene expression in precancerous and cancerous lesions by comparing the gene expression of stem-like cells in diseased tissues with normal stem cells |
| Entrez ID | Symbol | Replicates | Species | Organ | Tissue | Adj P-value | Log2FC | Malignancy |
| 26225 | ARL5A | LZE2D | Human | Esophagus | HGIN | 2.21e-03 | 2.87e-01 | 0.0642 |
| 26225 | ARL5A | LZE2T | Human | Esophagus | ESCC | 3.70e-10 | 1.04e+00 | 0.082 |
| 26225 | ARL5A | LZE4T | Human | Esophagus | ESCC | 1.57e-33 | 9.81e-01 | 0.0811 |
| 26225 | ARL5A | LZE5T | Human | Esophagus | ESCC | 2.52e-06 | 3.23e-01 | 0.0514 |
| 26225 | ARL5A | LZE7T | Human | Esophagus | ESCC | 2.36e-03 | 2.59e-01 | 0.0667 |
| 26225 | ARL5A | LZE8T | Human | Esophagus | ESCC | 7.78e-05 | 8.66e-02 | 0.067 |
| 26225 | ARL5A | LZE20T | Human | Esophagus | ESCC | 6.18e-10 | 3.54e-01 | 0.0662 |
| 26225 | ARL5A | LZE22D1 | Human | Esophagus | HGIN | 1.51e-04 | 3.66e-01 | 0.0595 |
| 26225 | ARL5A | LZE22T | Human | Esophagus | ESCC | 1.12e-15 | 9.92e-01 | 0.068 |
| 26225 | ARL5A | LZE24T | Human | Esophagus | ESCC | 6.72e-36 | 7.85e-01 | 0.0596 |
| 26225 | ARL5A | LZE21T | Human | Esophagus | ESCC | 2.37e-10 | 3.98e-01 | 0.0655 |
| 26225 | ARL5A | LZE6T | Human | Esophagus | ESCC | 5.52e-03 | 9.63e-02 | 0.0845 |
| 26225 | ARL5A | P1T-E | Human | Esophagus | ESCC | 9.48e-11 | 6.05e-01 | 0.0875 |
| 26225 | ARL5A | P2T-E | Human | Esophagus | ESCC | 5.89e-44 | 8.73e-01 | 0.1177 |
| 26225 | ARL5A | P4T-E | Human | Esophagus | ESCC | 2.06e-74 | 1.61e+00 | 0.1323 |
| 26225 | ARL5A | P5T-E | Human | Esophagus | ESCC | 6.45e-40 | 8.23e-01 | 0.1327 |
| 26225 | ARL5A | P8T-E | Human | Esophagus | ESCC | 1.64e-45 | 9.43e-01 | 0.0889 |
| 26225 | ARL5A | P9T-E | Human | Esophagus | ESCC | 1.55e-39 | 7.96e-01 | 0.1131 |
| 26225 | ARL5A | P10T-E | Human | Esophagus | ESCC | 8.20e-60 | 1.14e+00 | 0.116 |
| 26225 | ARL5A | P11T-E | Human | Esophagus | ESCC | 2.25e-37 | 1.15e+00 | 0.1426 |
| Page: 1 2 3 4 5 6 7 |
| Tissue | Expression Dynamics | Abbreviation |
| Esophagus | 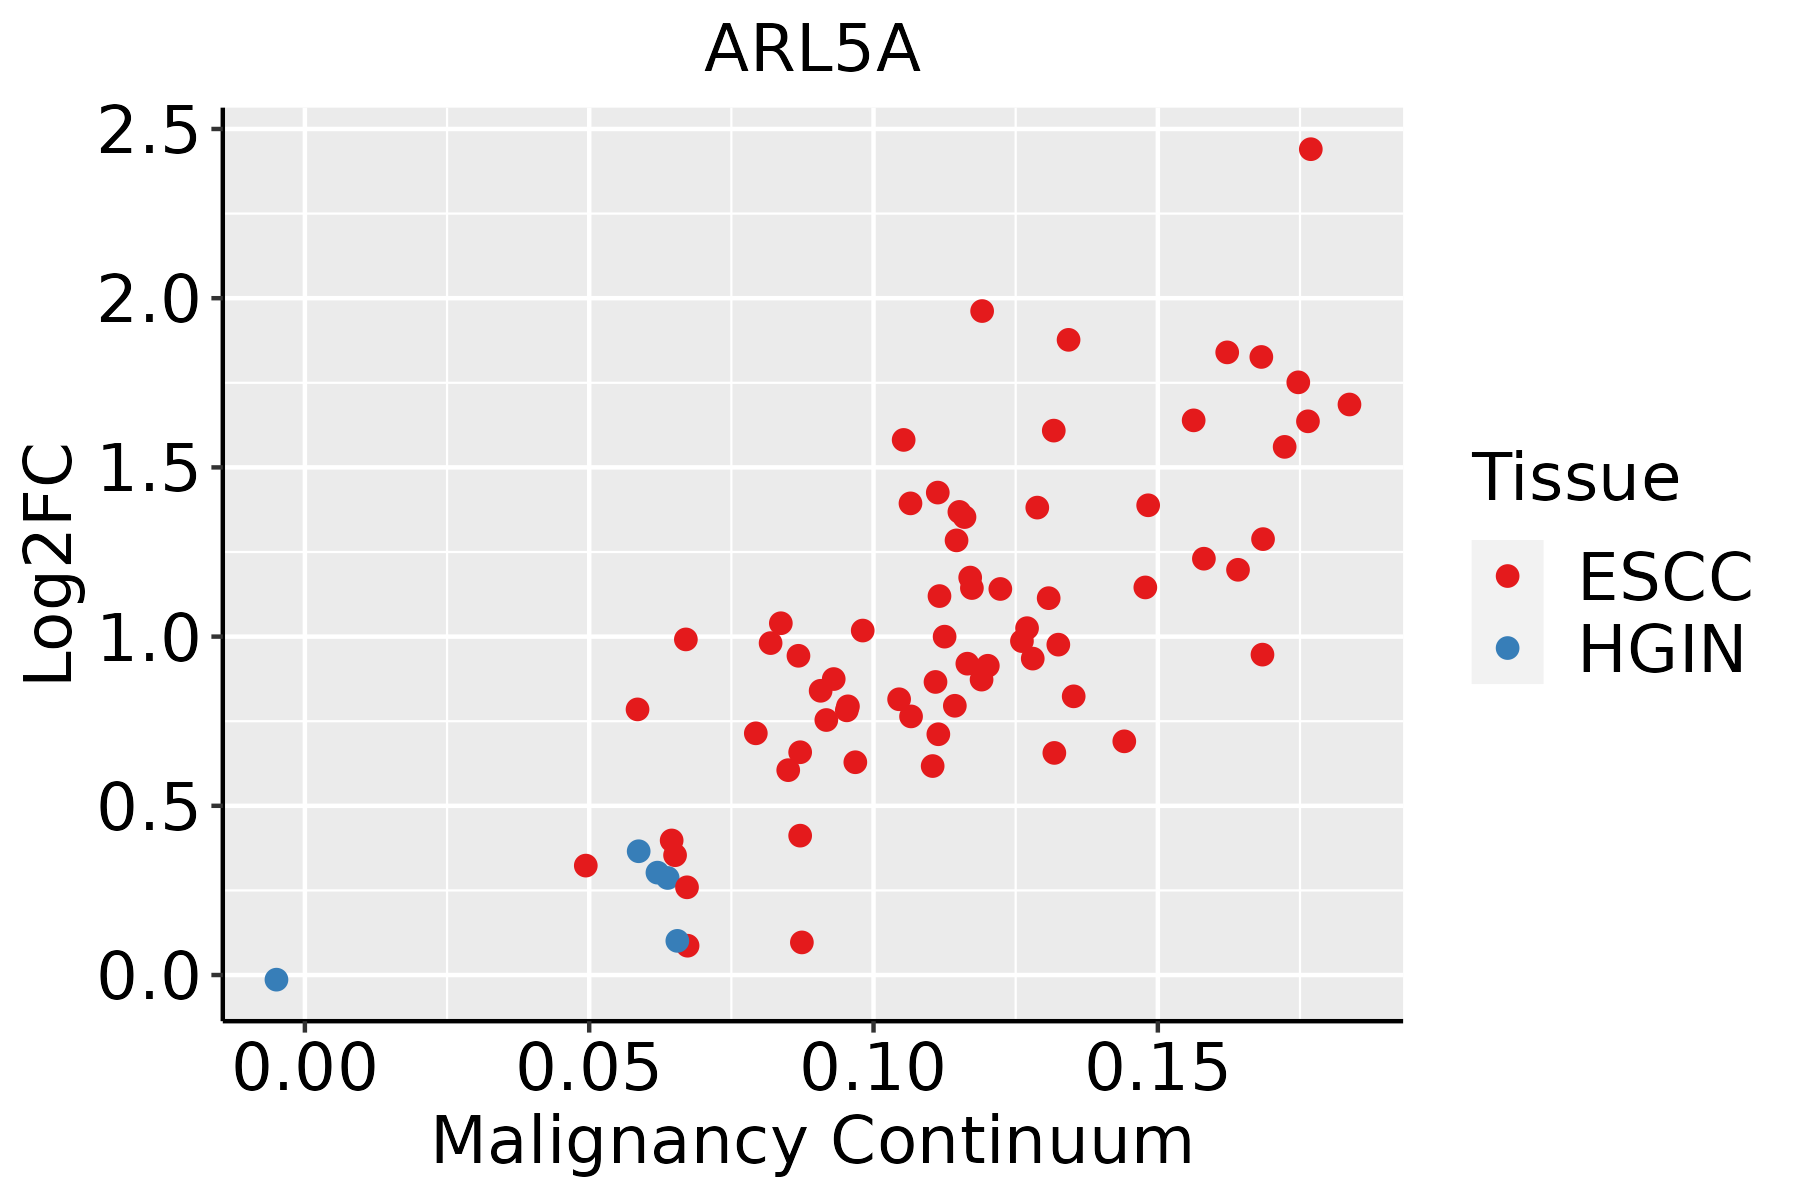 | ESCC: Esophageal squamous cell carcinoma |
| HGIN: High-grade intraepithelial neoplasias | ||
| LGIN: Low-grade intraepithelial neoplasias | ||
| Liver | 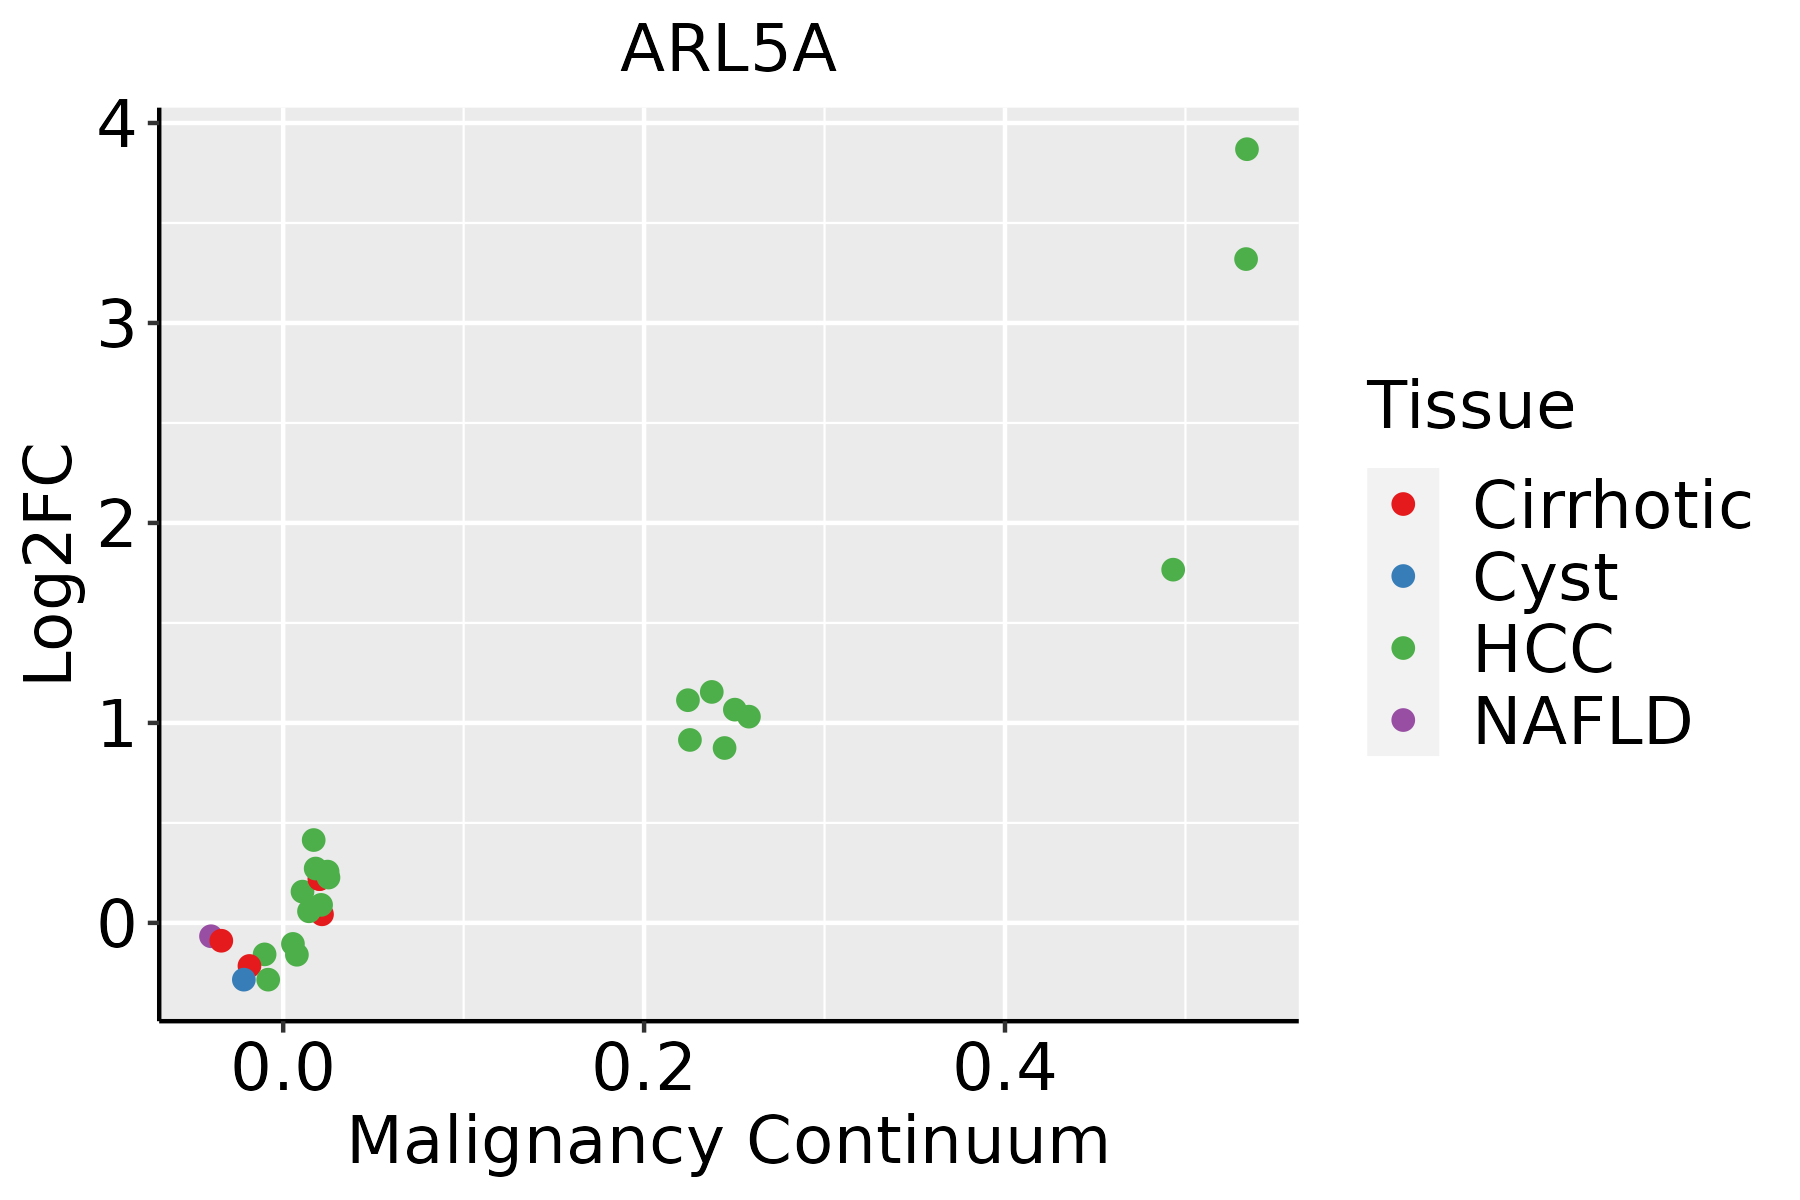 | HCC: Hepatocellular carcinoma |
| NAFLD: Non-alcoholic fatty liver disease | ||
| Oral Cavity | 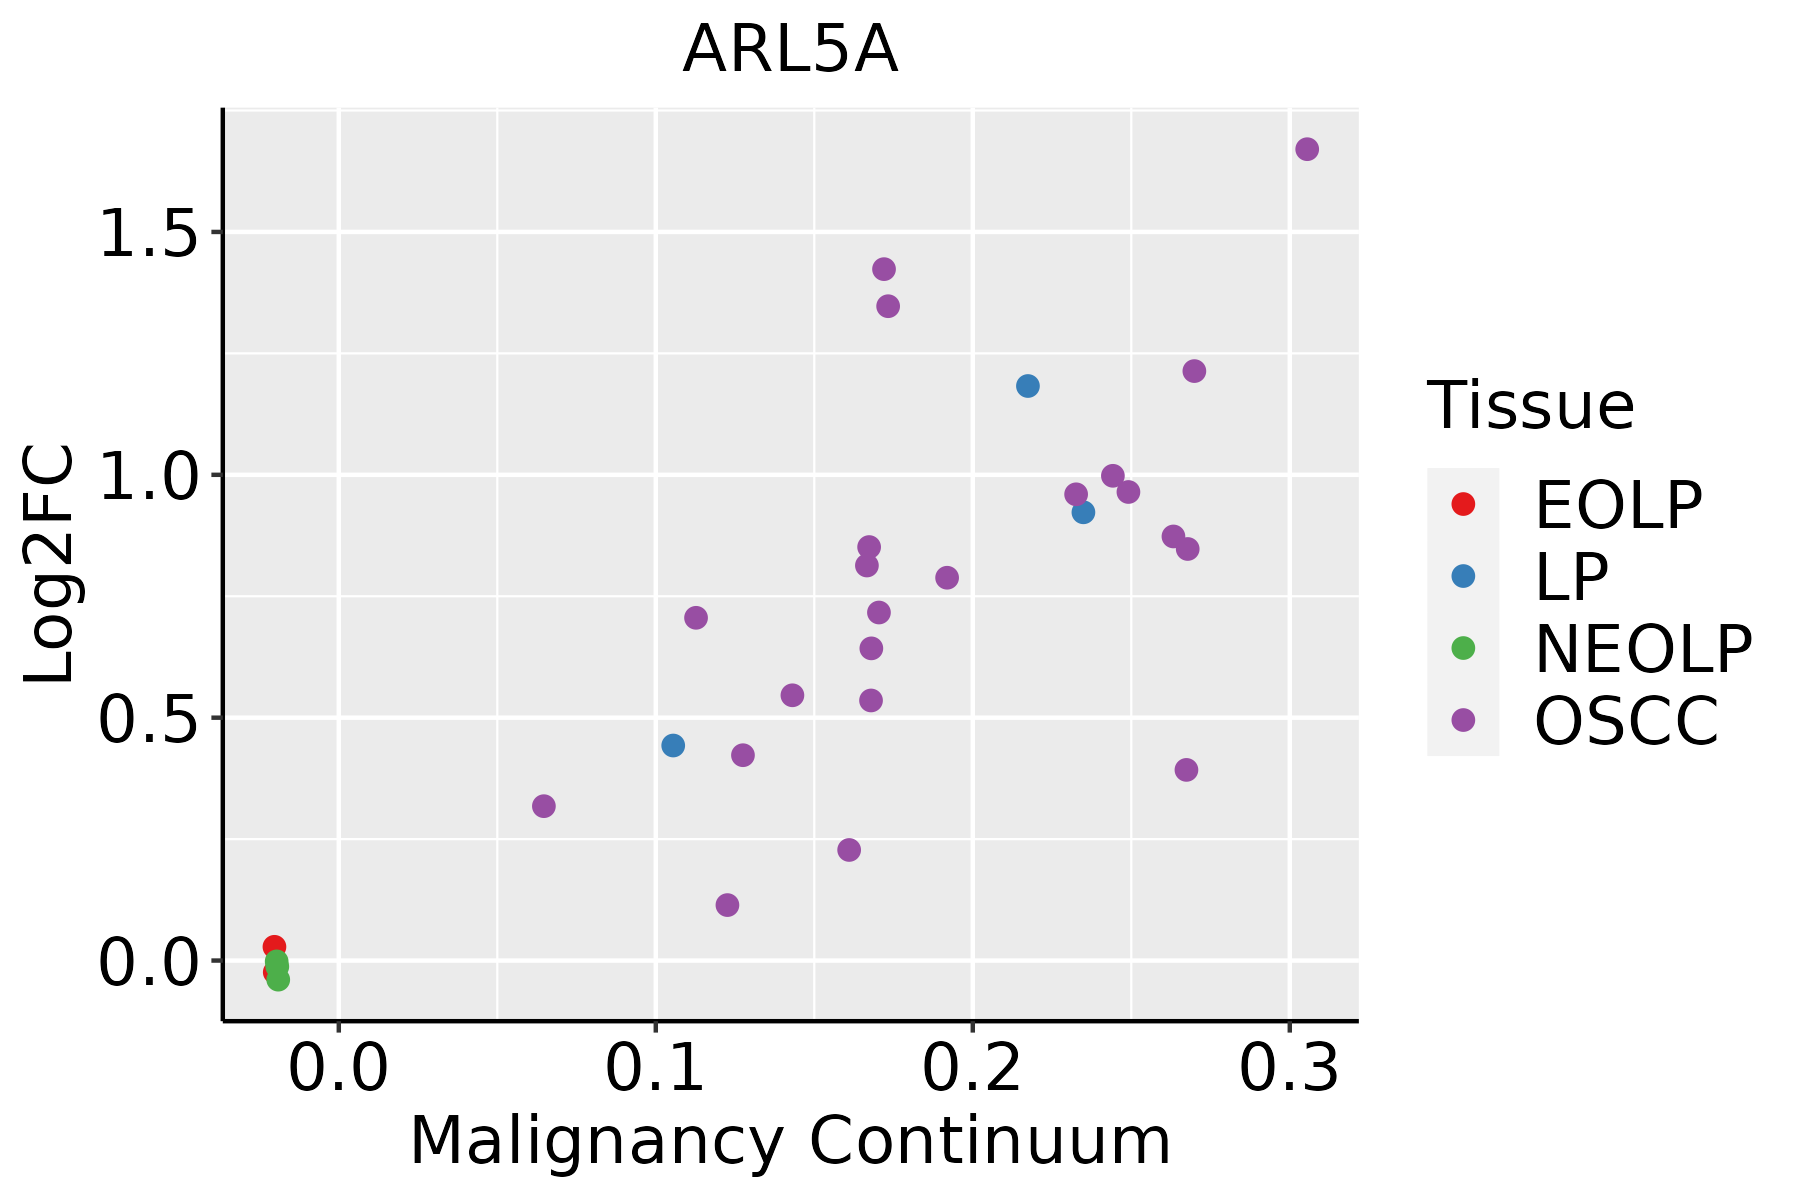 | EOLP: Erosive Oral lichen planus |
| LP: leukoplakia | ||
| NEOLP: Non-erosive oral lichen planus | ||
| OSCC: Oral squamous cell carcinoma | ||
| Prostate | 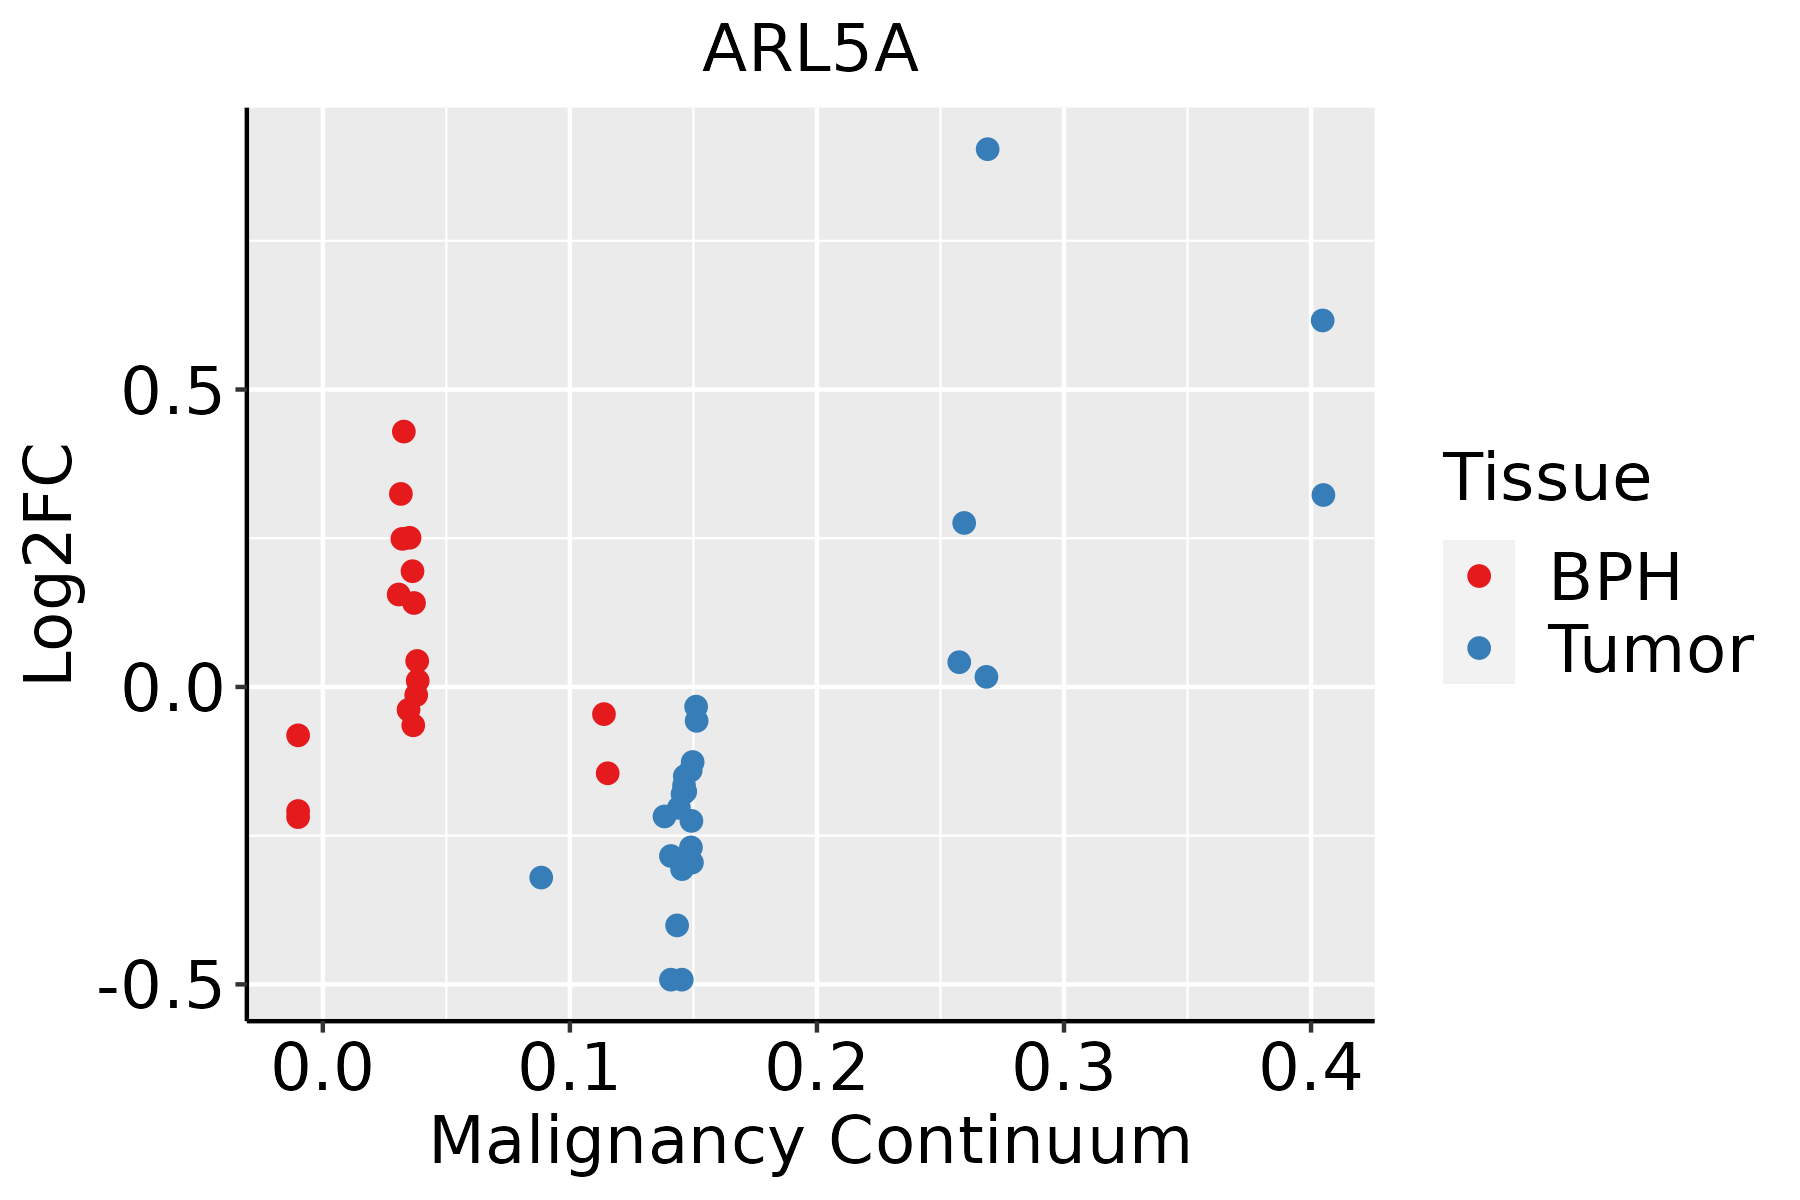 | BPH: Benign Prostatic Hyperplasia |
| Skin | 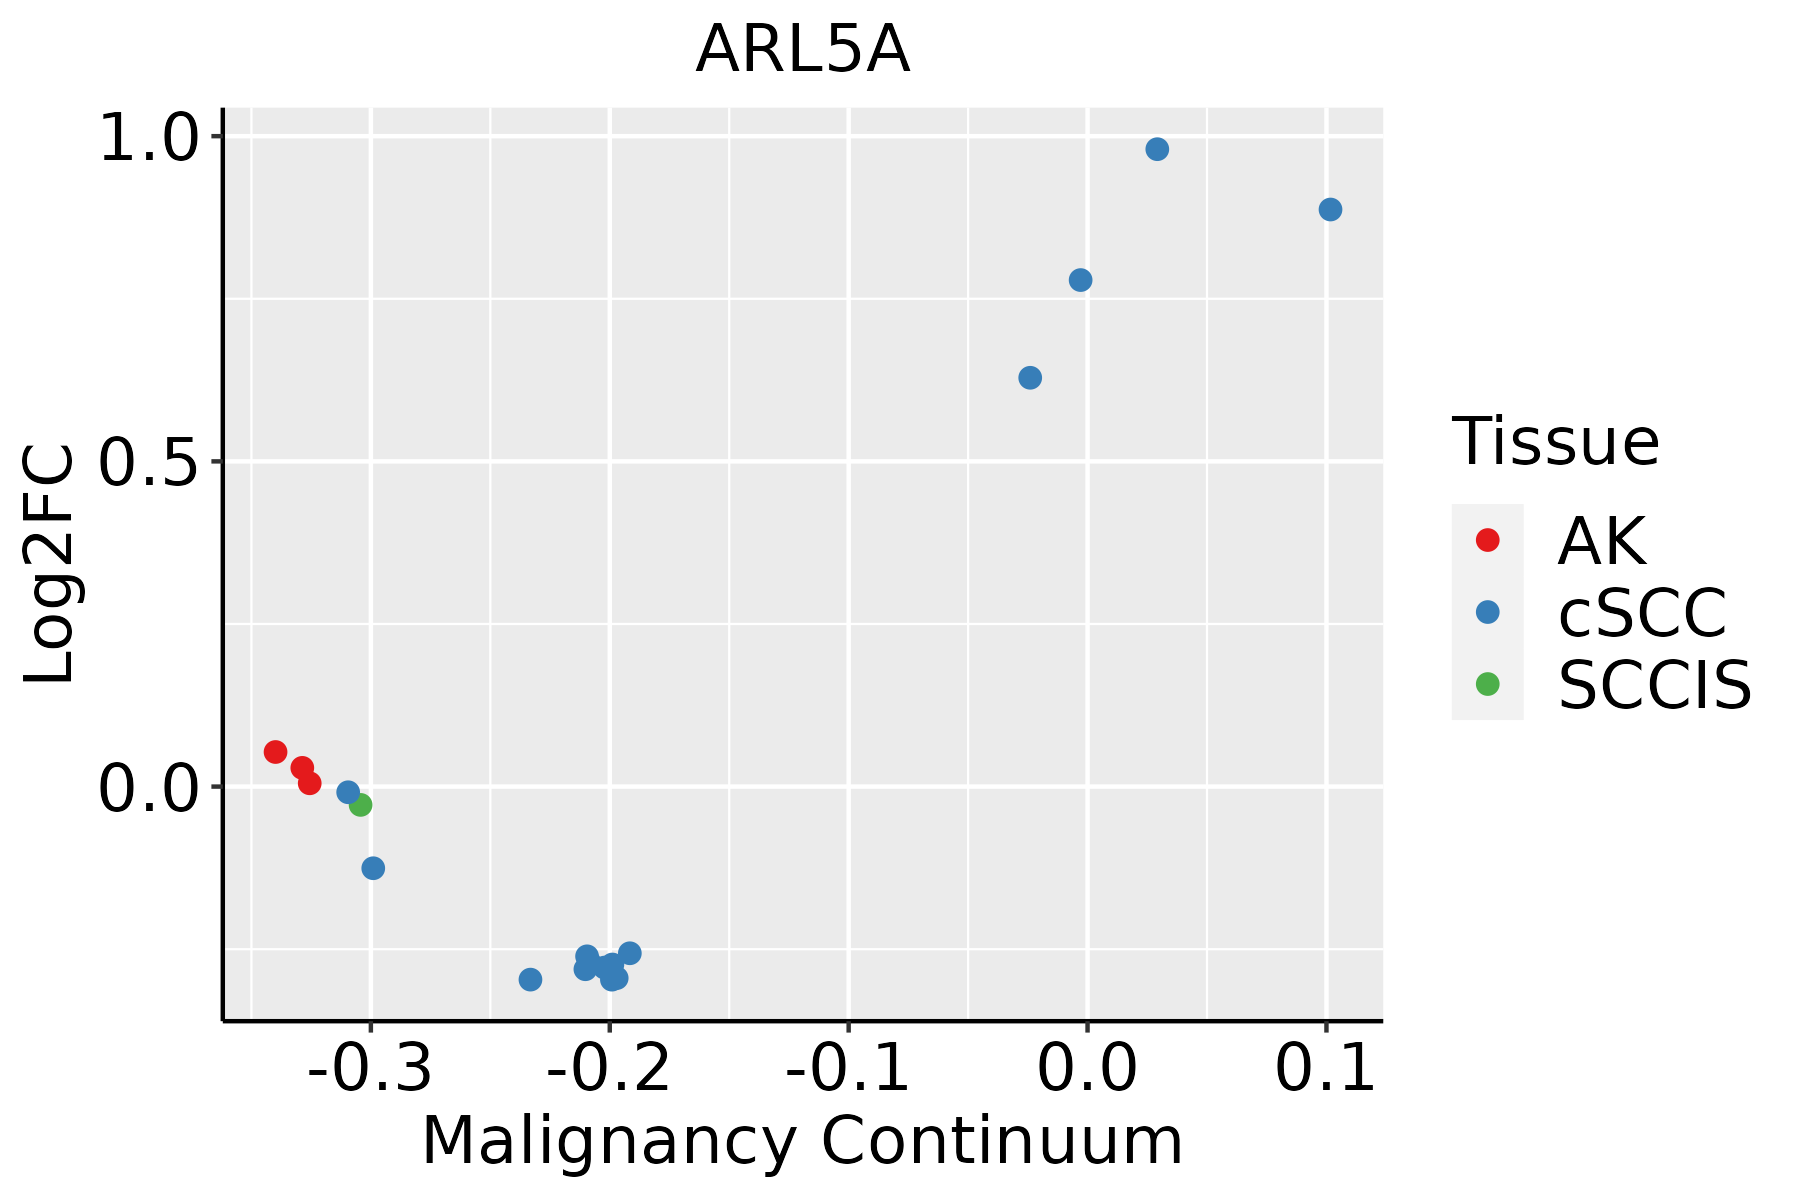 | AK: Actinic keratosis |
| cSCC: Cutaneous squamous cell carcinoma | ||
| SCCIS:squamous cell carcinoma in situ | ||
| Thyroid | 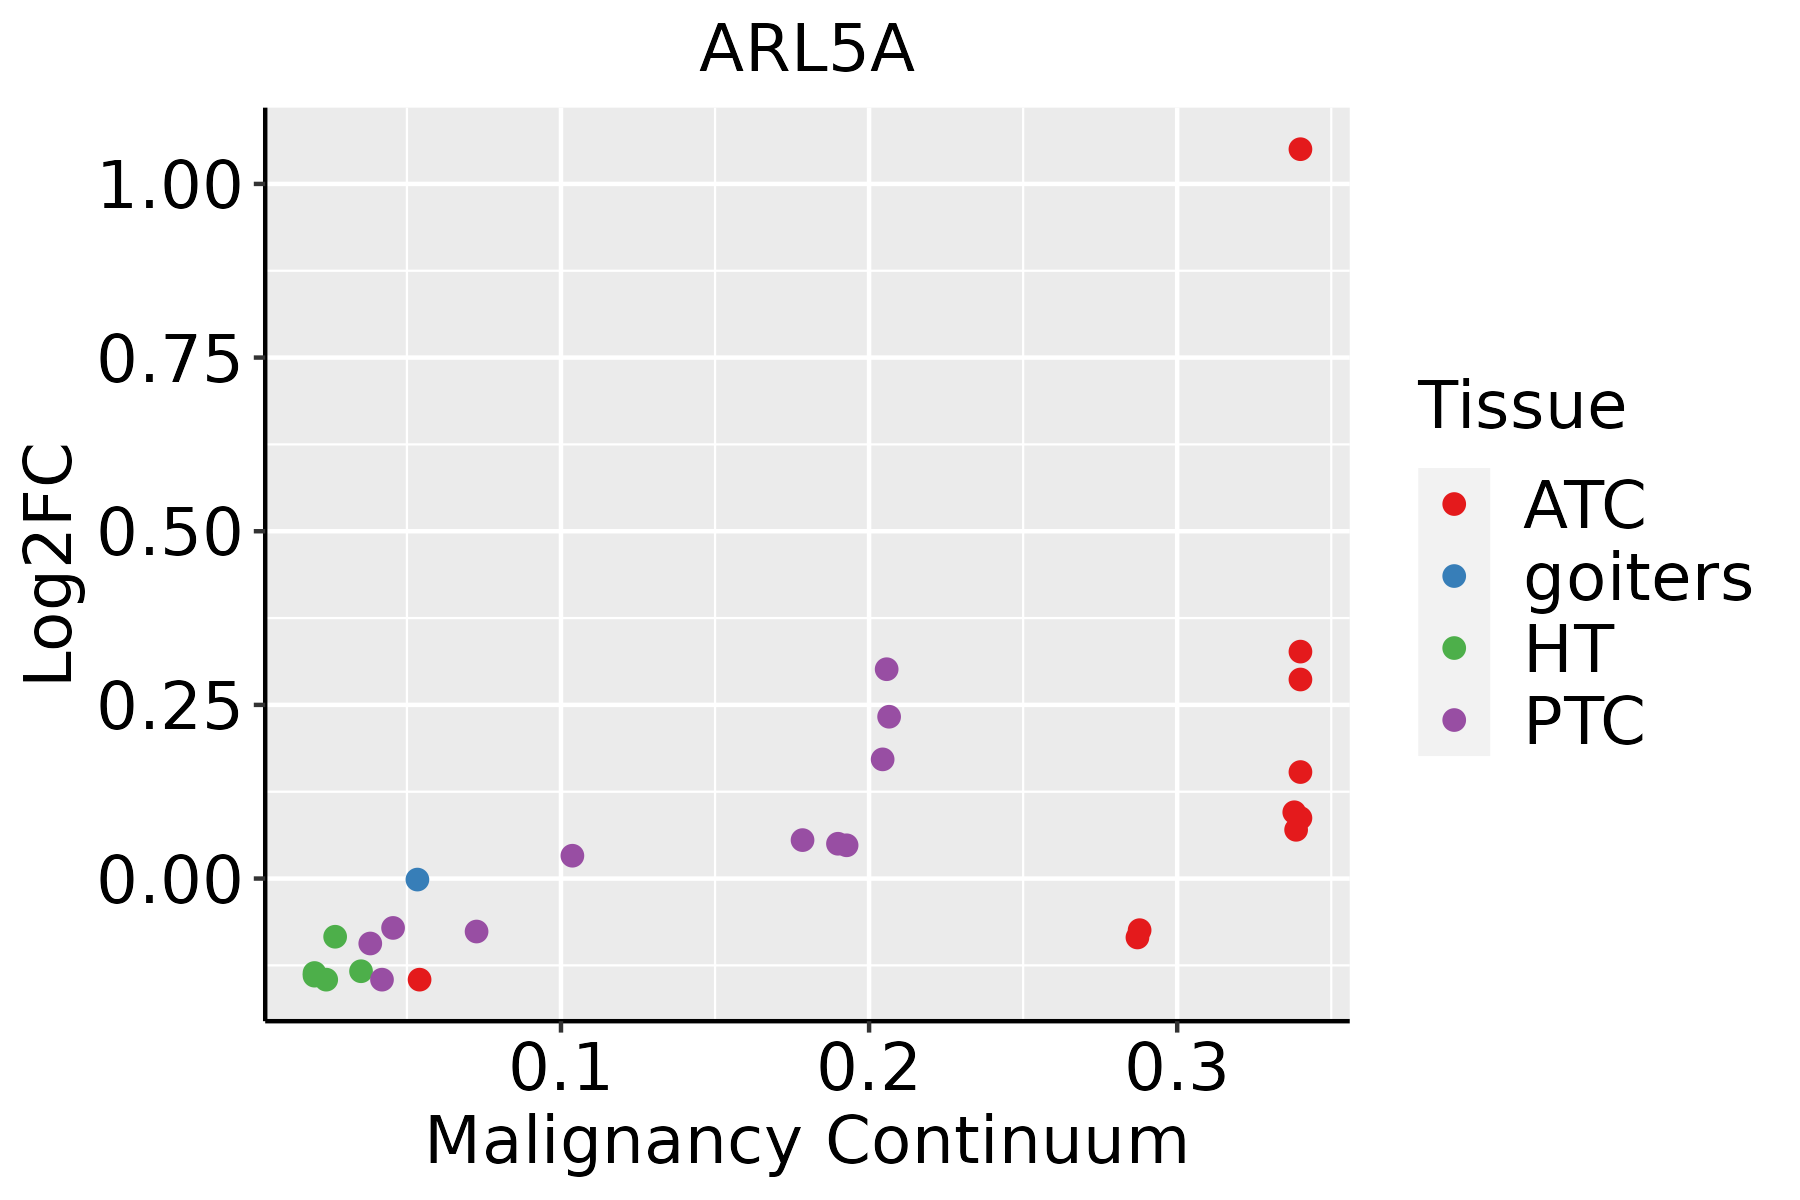 | ATC: Anaplastic thyroid cancer |
| HT: Hashimoto's thyroiditis | ||
| PTC: Papillary thyroid cancer |
| ∗log2FC in expression of this searched gene in stem-like cells from each diseased tissue sample relative to stem-like cells in normal samples in each tissue plotted against the malignancy continuum. Samples are colored based on if they are from different disease stage. |
Top |
Malignant transformation related pathway analysis |
| Find out the enriched GO biological processes and KEGG pathways involved in transition from healthy to precancer to cancer |
| Tissue | Disease Stage | Enriched GO biological Processes |
| Colorectum | AD |  |
| Colorectum | SER |  |
| Colorectum | MSS |  |
| Colorectum | MSI-H |  |
| Colorectum | FAP |  |
| ∗Top 15 enriched GO BP terms are showed in the bar plot of each disease state in each tissue. Each row represents a significant GO biological process which is colored according to the -log10(p.adjust). |
| Page: 1 2 3 4 5 6 7 8 9 |
| GO ID | Tissue | Disease Stage | Description | Gene Ratio | Bg Ratio | pvalue | p.adjust | Count |
| GO:00340676 | Esophagus | ESCC | protein localization to Golgi apparatus | 23/8552 | 29/18723 | 2.25e-04 | 1.40e-03 | 23 |
| GO:003406711 | Liver | Cirrhotic | protein localization to Golgi apparatus | 17/4634 | 29/18723 | 1.05e-04 | 1.08e-03 | 17 |
| GO:003406721 | Liver | HCC | protein localization to Golgi apparatus | 23/7958 | 29/18723 | 5.86e-05 | 5.38e-04 | 23 |
| GO:00340675 | Oral cavity | OSCC | protein localization to Golgi apparatus | 21/7305 | 29/18723 | 2.73e-04 | 1.73e-03 | 21 |
| GO:003406713 | Oral cavity | LP | protein localization to Golgi apparatus | 14/4623 | 29/18723 | 4.98e-03 | 3.10e-02 | 14 |
| GO:00340674 | Prostate | BPH | protein localization to Golgi apparatus | 14/3107 | 29/18723 | 7.48e-05 | 7.24e-04 | 14 |
| GO:003406712 | Prostate | Tumor | protein localization to Golgi apparatus | 15/3246 | 29/18723 | 2.48e-05 | 3.10e-04 | 15 |
| GO:00340677 | Thyroid | PTC | protein localization to Golgi apparatus | 20/5968 | 29/18723 | 4.54e-05 | 4.09e-04 | 20 |
| GO:003406714 | Thyroid | ATC | protein localization to Golgi apparatus | 21/6293 | 29/18723 | 2.21e-05 | 1.96e-04 | 21 |
| Page: 1 |
| Pathway ID | Tissue | Disease Stage | Description | Gene Ratio | Bg Ratio | pvalue | p.adjust | qvalue | Count |
| Page: 1 |
Top |
Cell-cell communication analysis |
| Identification of potential cell-cell interactions between two cell types and their ligand-receptor pairs for different disease states |
| Ligand | Receptor | LRpair | Pathway | Tissue | Disease Stage |
| Page: 1 |
Top |
Single-cell gene regulatory network inference analysis |
| Find out the significant the regulons (TFs) and the target genes of each regulon across cell types for different disease states |
| TF | Cell Type | Tissue | Disease Stage | Target Gene | RSS | Regulon Activity |
| ∗The dot plots of a searched regulon are shown for all cell subpopulations in each disease state of each tissue based on the regulon specific score inferred using pySCENIC and by calculating the average expression. |
| Page: 1 |
Top |
Somatic mutation of malignant transformation related genes |
| Annotation of somatic variants for genes involved in malignant transformation |
| Hugo Symbol | Variant Class | Variant Classification | dbSNP RS | HGVSc | HGVSp | HGVSp Short | SWISSPROT | BIOTYPE | SIFT | PolyPhen | Tumor Sample Barcode | Tissue | Histology | Sex | Age | Stage | Therapy Types | Drugs | Outcome |
| ARL5A | SNV | Missense_Mutation | c.286A>G | p.Arg96Gly | p.R96G | Q9Y689 | protein_coding | deleterious(0) | possibly_damaging(0.894) | TCGA-AO-A03P-01 | Breast | breast invasive carcinoma | Female | <65 | I/II | Hormone Therapy | letrozole | PD | |
| ARL5A | SNV | Missense_Mutation | novel | c.457C>T | p.His153Tyr | p.H153Y | Q9Y689 | protein_coding | tolerated(0.47) | probably_damaging(0.987) | TCGA-2W-A8YY-01 | Cervix | cervical & endocervical cancer | Female | <65 | I/II | Chemotherapy | cisplatin | CR |
| ARL5A | SNV | Missense_Mutation | novel | c.457N>T | p.His153Tyr | p.H153Y | Q9Y689 | protein_coding | tolerated(0.47) | probably_damaging(0.987) | TCGA-EA-A3HU-01 | Cervix | cervical & endocervical cancer | Female | <65 | I/II | Unknown | Unknown | SD |
| ARL5A | SNV | Missense_Mutation | novel | c.110N>A | p.Ser37Tyr | p.S37Y | Q9Y689 | protein_coding | tolerated(0.46) | possibly_damaging(0.704) | TCGA-A5-A2K5-01 | Endometrium | uterine corpus endometrioid carcinoma | Female | >=65 | I/II | Unknown | Unknown | SD |
| ARL5A | SNV | Missense_Mutation | novel | c.470N>A | p.Cys157Tyr | p.C157Y | Q9Y689 | protein_coding | deleterious(0.01) | probably_damaging(0.928) | TCGA-AP-A1DK-01 | Endometrium | uterine corpus endometrioid carcinoma | Female | <65 | I/II | Unknown | Unknown | SD |
| ARL5A | SNV | Missense_Mutation | novel | c.381N>C | p.Gln127His | p.Q127H | Q9Y689 | protein_coding | deleterious(0) | probably_damaging(0.978) | TCGA-AP-A1DV-01 | Endometrium | uterine corpus endometrioid carcinoma | Female | <65 | I/II | Unknown | Unknown | SD |
| ARL5A | SNV | Missense_Mutation | novel | c.293G>T | p.Arg98Met | p.R98M | Q9Y689 | protein_coding | deleterious(0) | probably_damaging(0.995) | TCGA-AX-A2HD-01 | Endometrium | uterine corpus endometrioid carcinoma | Female | >=65 | III/IV | Unknown | Unknown | SD |
| ARL5A | SNV | Missense_Mutation | novel | c.121G>T | p.Val41Phe | p.V41F | Q9Y689 | protein_coding | deleterious(0) | probably_damaging(0.953) | TCGA-B5-A1MX-01 | Endometrium | uterine corpus endometrioid carcinoma | Female | <65 | I/II | Hormone Therapy | megace | SD |
| ARL5A | SNV | Missense_Mutation | novel | c.106N>C | p.Phe36Leu | p.F36L | Q9Y689 | protein_coding | tolerated(1) | benign(0.176) | TCGA-B5-A3FA-01 | Endometrium | uterine corpus endometrioid carcinoma | Female | >=65 | I/II | Unknown | Unknown | SD |
| ARL5A | SNV | Missense_Mutation | novel | c.110N>A | p.Ser37Tyr | p.S37Y | Q9Y689 | protein_coding | tolerated(0.46) | possibly_damaging(0.704) | TCGA-E6-A1M0-01 | Endometrium | uterine corpus endometrioid carcinoma | Female | <65 | III/IV | Chemotherapy | carboplatin | SD |
| Page: 1 2 3 |
Top |
Related drugs of malignant transformation related genes |
| Identification of chemicals and drugs interact with genes involved in malignant transfromation |
| (DGIdb 4.0) |
| Entrez ID | Symbol | Category | Interaction Types | Drug Claim Name | Drug Name | PMIDs |
| Page: 1 |

Copyright 2023-Present -The University of Texas Health Science Center at Houston |