
|
|||||
|
 | |
| |
| |
| |
| |
| |
|
Gene: ARL4C |
Gene summary for ARL4C |
| Gene information | Species | Human | Gene symbol | ARL4C | Gene ID | 10123 |
| Gene name | ADP ribosylation factor like GTPase 4C | |
| Gene Alias | ARL7 | |
| Cytomap | 2q37.1 | |
| Gene Type | protein-coding | GO ID | GO:0006810 | UniProtAcc | P56559 |
Top |
Malignant transformation analysis |
| Identification of the aberrant gene expression in precancerous and cancerous lesions by comparing the gene expression of stem-like cells in diseased tissues with normal stem cells |
| Entrez ID | Symbol | Replicates | Species | Organ | Tissue | Adj P-value | Log2FC | Malignancy |
| 10123 | ARL4C | LZE2T | Human | Esophagus | ESCC | 9.84e-03 | -5.83e-01 | 0.082 |
| 10123 | ARL4C | LZE4T | Human | Esophagus | ESCC | 1.02e-13 | -4.47e-01 | 0.0811 |
| 10123 | ARL4C | LZE5T | Human | Esophagus | ESCC | 9.02e-07 | -6.10e-01 | 0.0514 |
| 10123 | ARL4C | LZE7T | Human | Esophagus | ESCC | 1.50e-08 | -5.44e-02 | 0.0667 |
| 10123 | ARL4C | LZE8T | Human | Esophagus | ESCC | 5.27e-10 | -5.40e-01 | 0.067 |
| 10123 | ARL4C | LZE22D1 | Human | Esophagus | HGIN | 1.77e-05 | -7.08e-01 | 0.0595 |
| 10123 | ARL4C | LZE22T | Human | Esophagus | ESCC | 2.35e-05 | -5.31e-01 | 0.068 |
| 10123 | ARL4C | LZE24T | Human | Esophagus | ESCC | 2.97e-19 | -5.91e-01 | 0.0596 |
| 10123 | ARL4C | LZE21T | Human | Esophagus | ESCC | 8.25e-06 | -4.37e-01 | 0.0655 |
| 10123 | ARL4C | LZE6T | Human | Esophagus | ESCC | 3.76e-03 | -5.08e-01 | 0.0845 |
| 10123 | ARL4C | P1T-E | Human | Esophagus | ESCC | 6.70e-07 | -4.05e-01 | 0.0875 |
| 10123 | ARL4C | P2T-E | Human | Esophagus | ESCC | 1.15e-17 | -2.69e-01 | 0.1177 |
| 10123 | ARL4C | P4T-E | Human | Esophagus | ESCC | 1.03e-22 | -1.73e-01 | 0.1323 |
| 10123 | ARL4C | P5T-E | Human | Esophagus | ESCC | 7.02e-19 | -2.79e-01 | 0.1327 |
| 10123 | ARL4C | P8T-E | Human | Esophagus | ESCC | 1.83e-11 | -1.66e-01 | 0.0889 |
| 10123 | ARL4C | P9T-E | Human | Esophagus | ESCC | 1.96e-09 | -3.89e-01 | 0.1131 |
| 10123 | ARL4C | P10T-E | Human | Esophagus | ESCC | 5.23e-08 | 2.87e-02 | 0.116 |
| 10123 | ARL4C | P15T-E | Human | Esophagus | ESCC | 1.32e-03 | 1.56e-01 | 0.1149 |
| 10123 | ARL4C | P16T-E | Human | Esophagus | ESCC | 5.87e-32 | -5.46e-01 | 0.1153 |
| 10123 | ARL4C | P17T-E | Human | Esophagus | ESCC | 1.65e-04 | -6.17e-01 | 0.1278 |
| Page: 1 2 3 4 5 |
| Tissue | Expression Dynamics | Abbreviation |
| Esophagus | 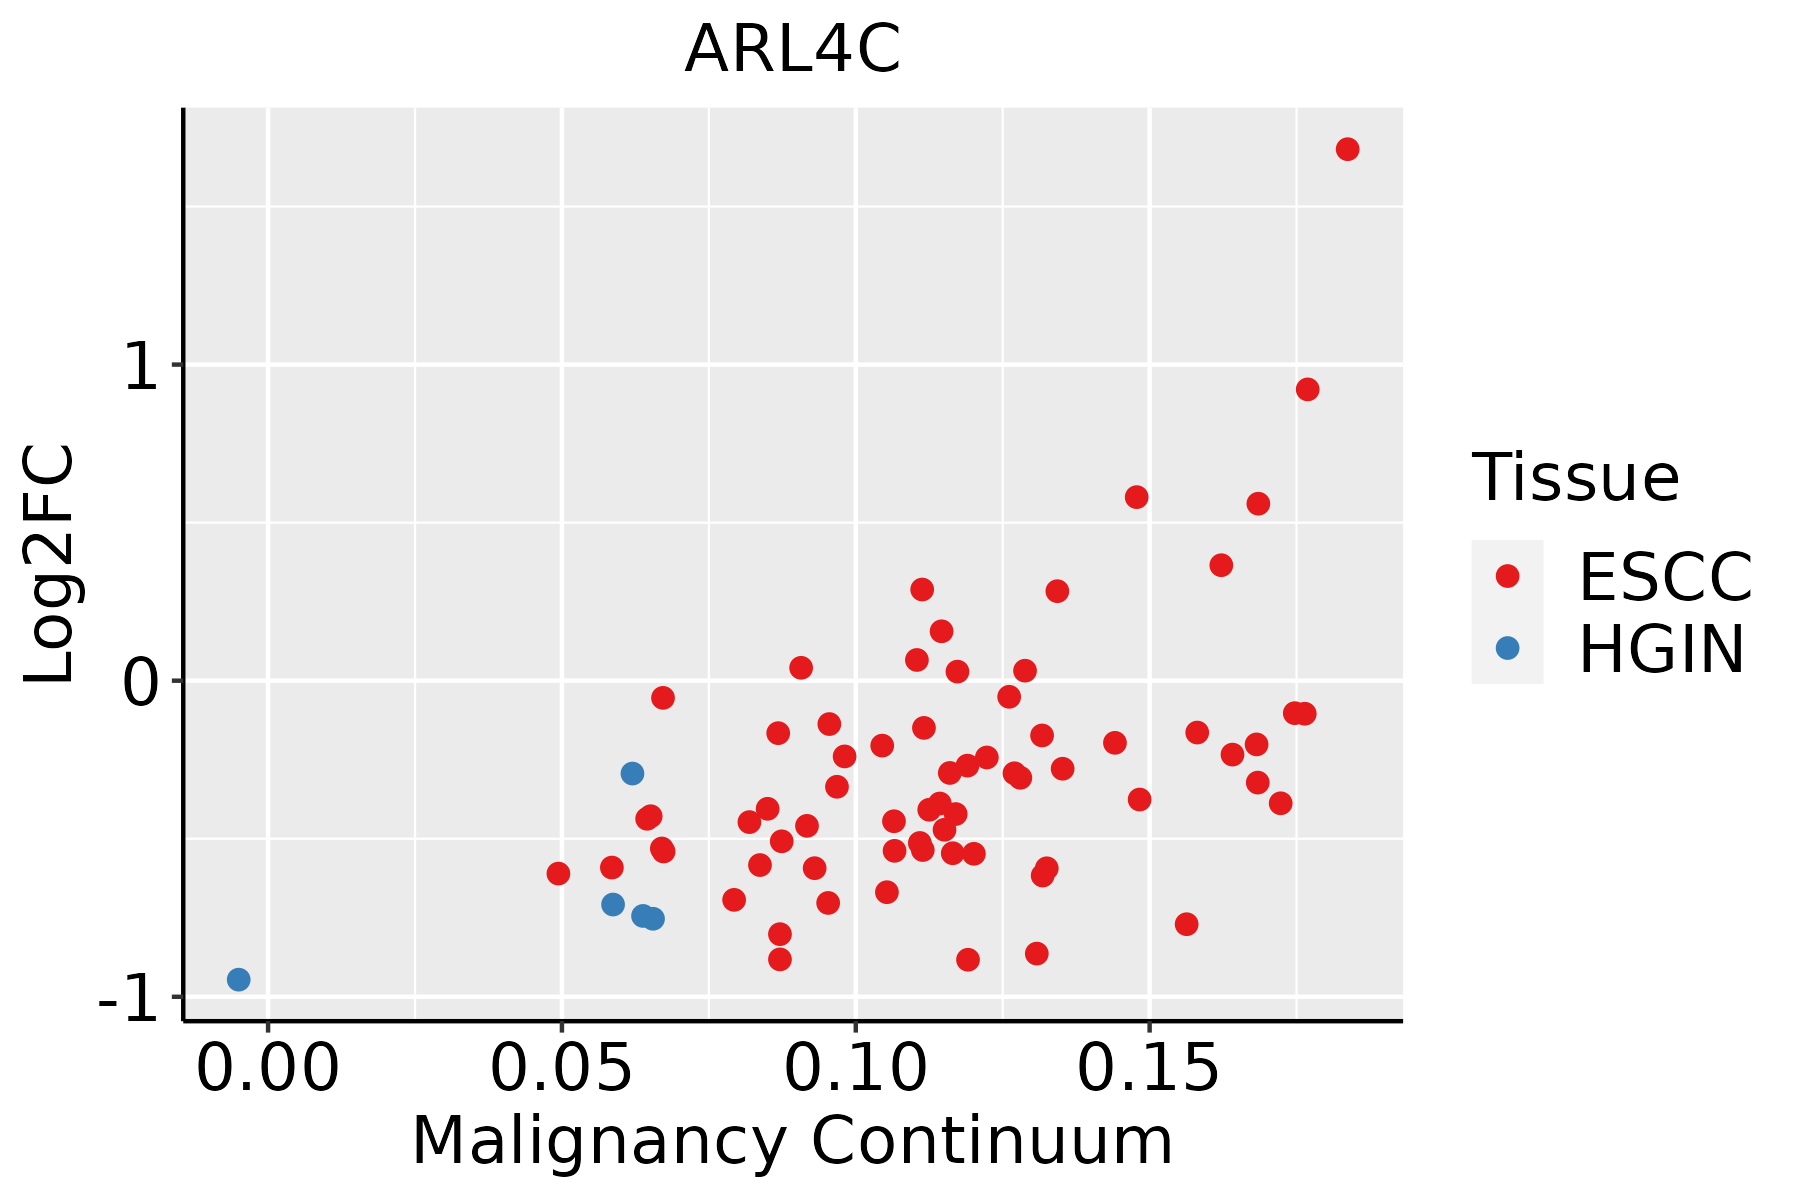 | ESCC: Esophageal squamous cell carcinoma |
| HGIN: High-grade intraepithelial neoplasias | ||
| LGIN: Low-grade intraepithelial neoplasias | ||
| Oral Cavity | 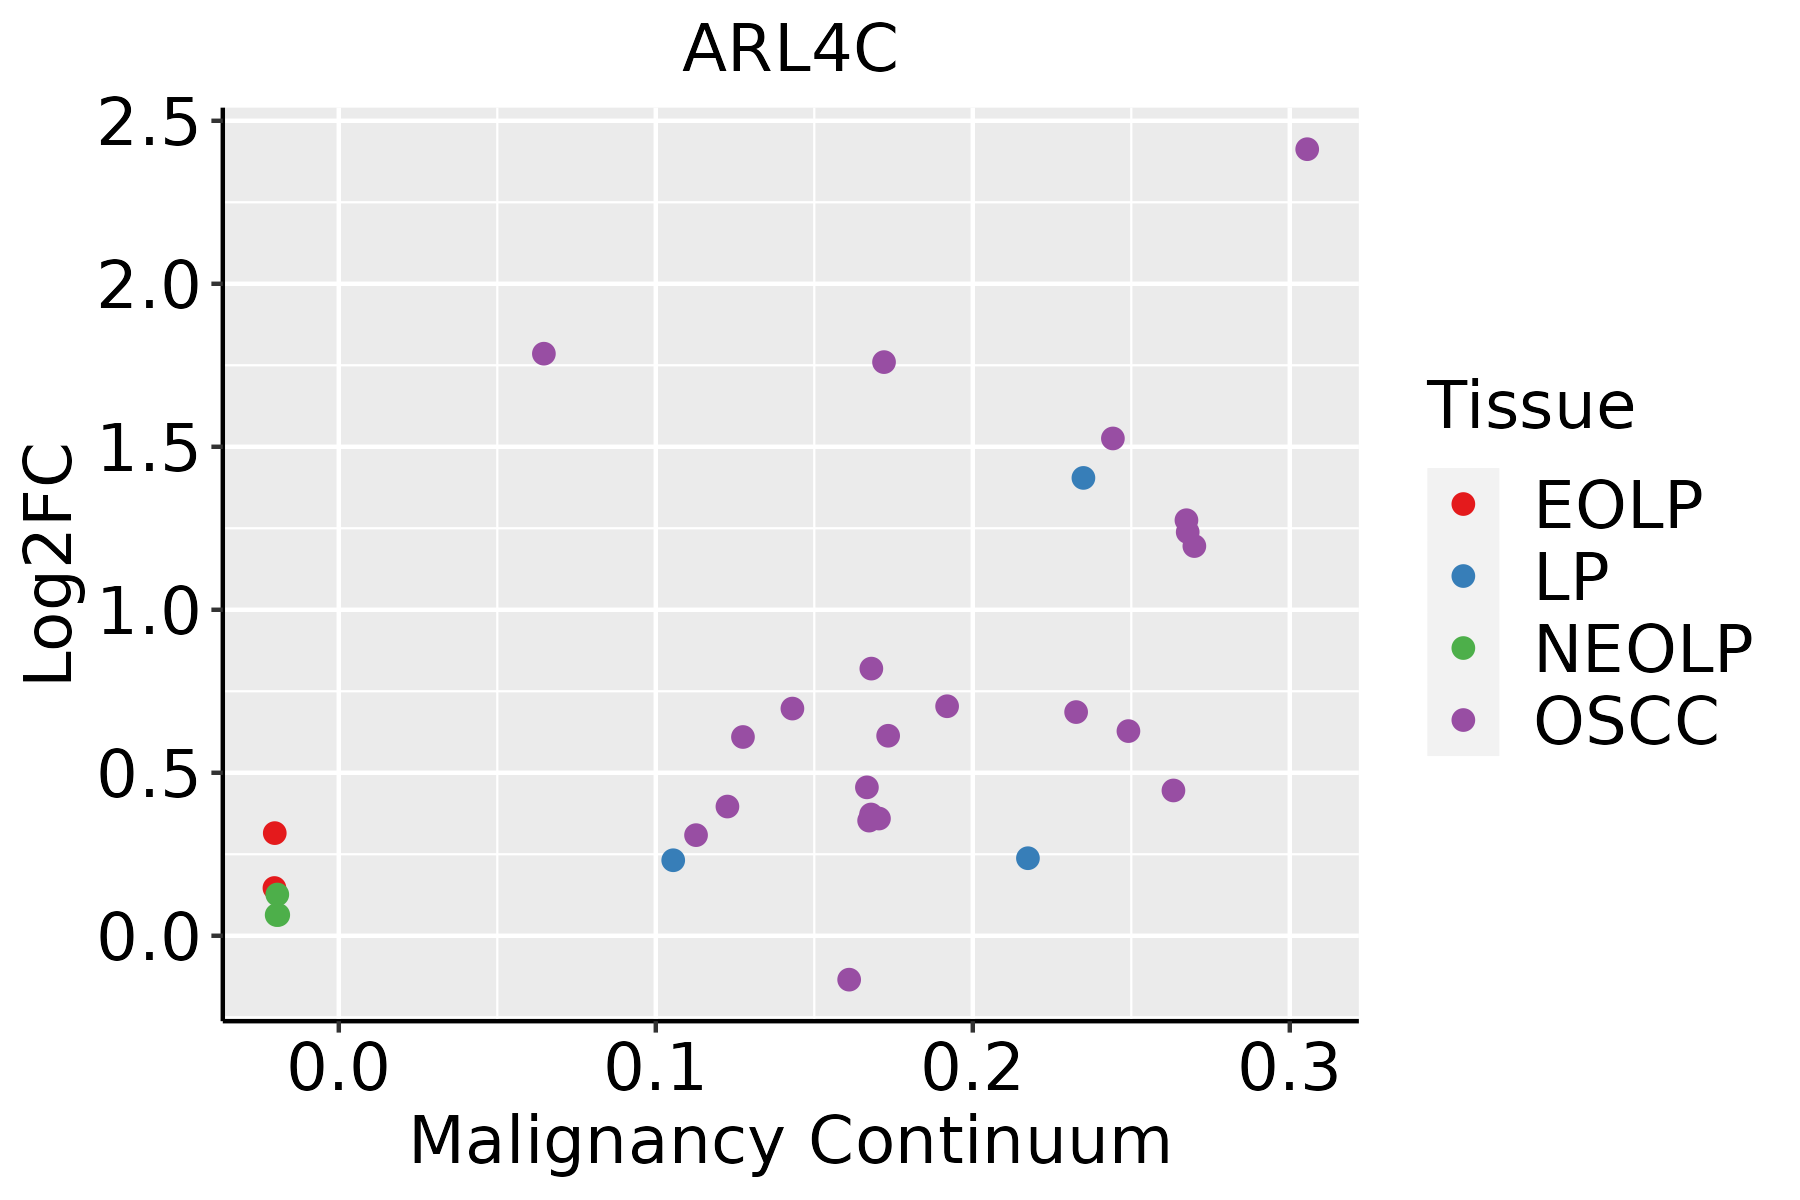 | EOLP: Erosive Oral lichen planus |
| LP: leukoplakia | ||
| NEOLP: Non-erosive oral lichen planus | ||
| OSCC: Oral squamous cell carcinoma | ||
| Prostate | 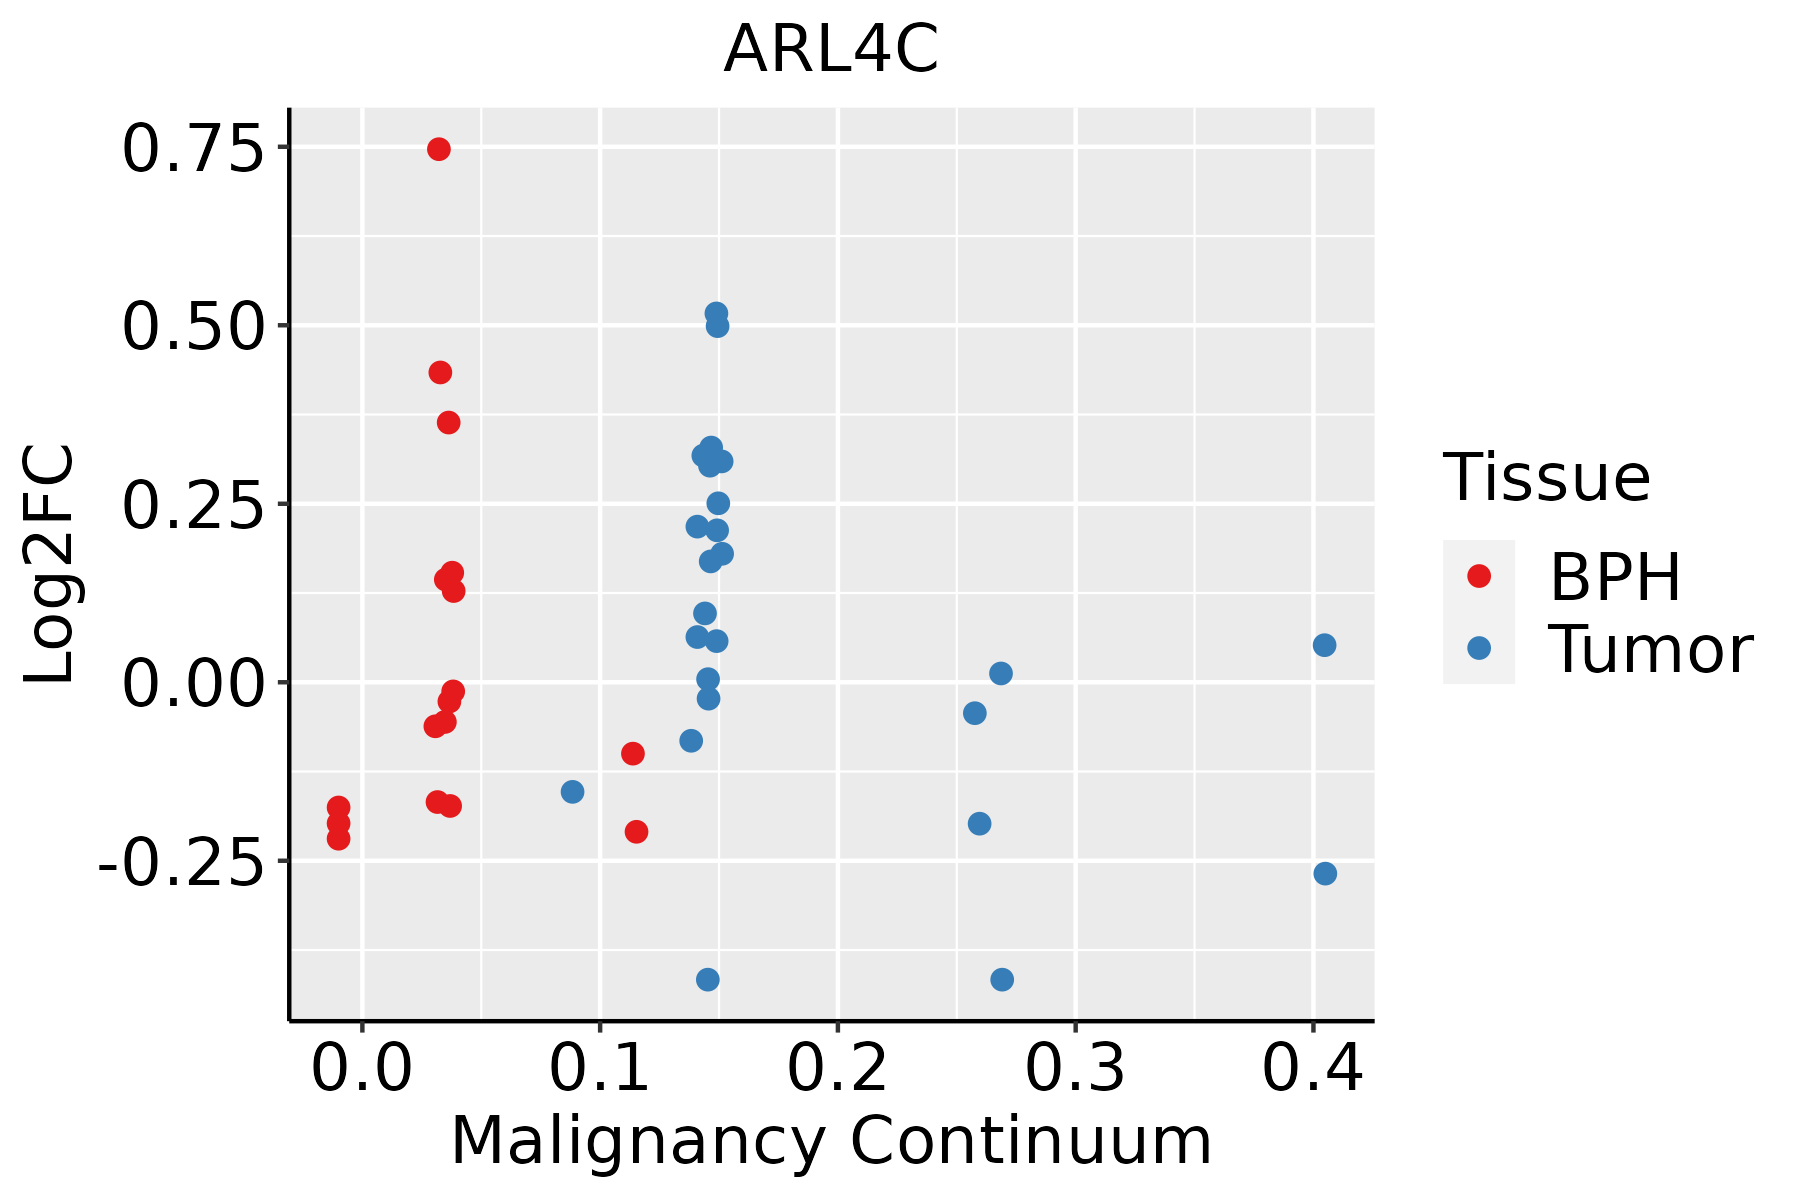 | BPH: Benign Prostatic Hyperplasia |
| Skin | 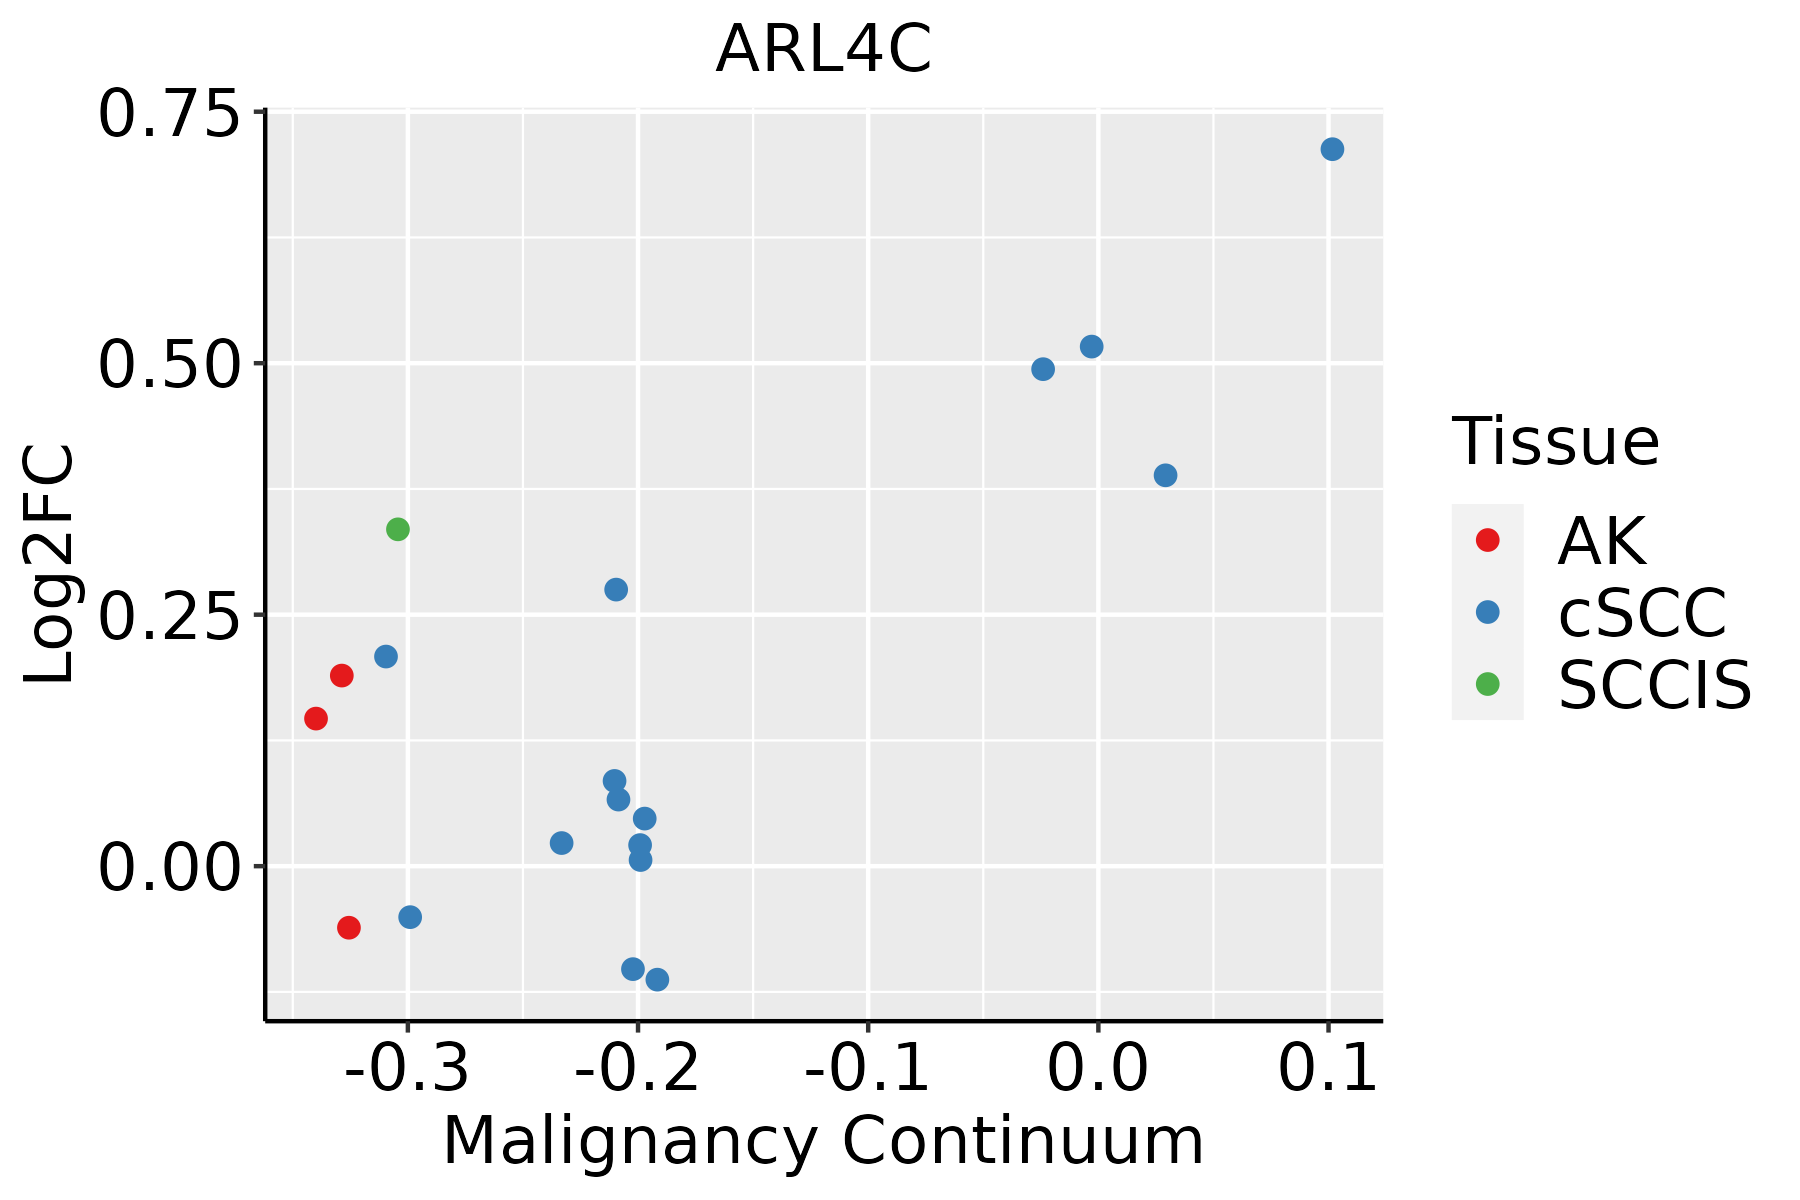 | AK: Actinic keratosis |
| cSCC: Cutaneous squamous cell carcinoma | ||
| SCCIS:squamous cell carcinoma in situ | ||
| Thyroid | 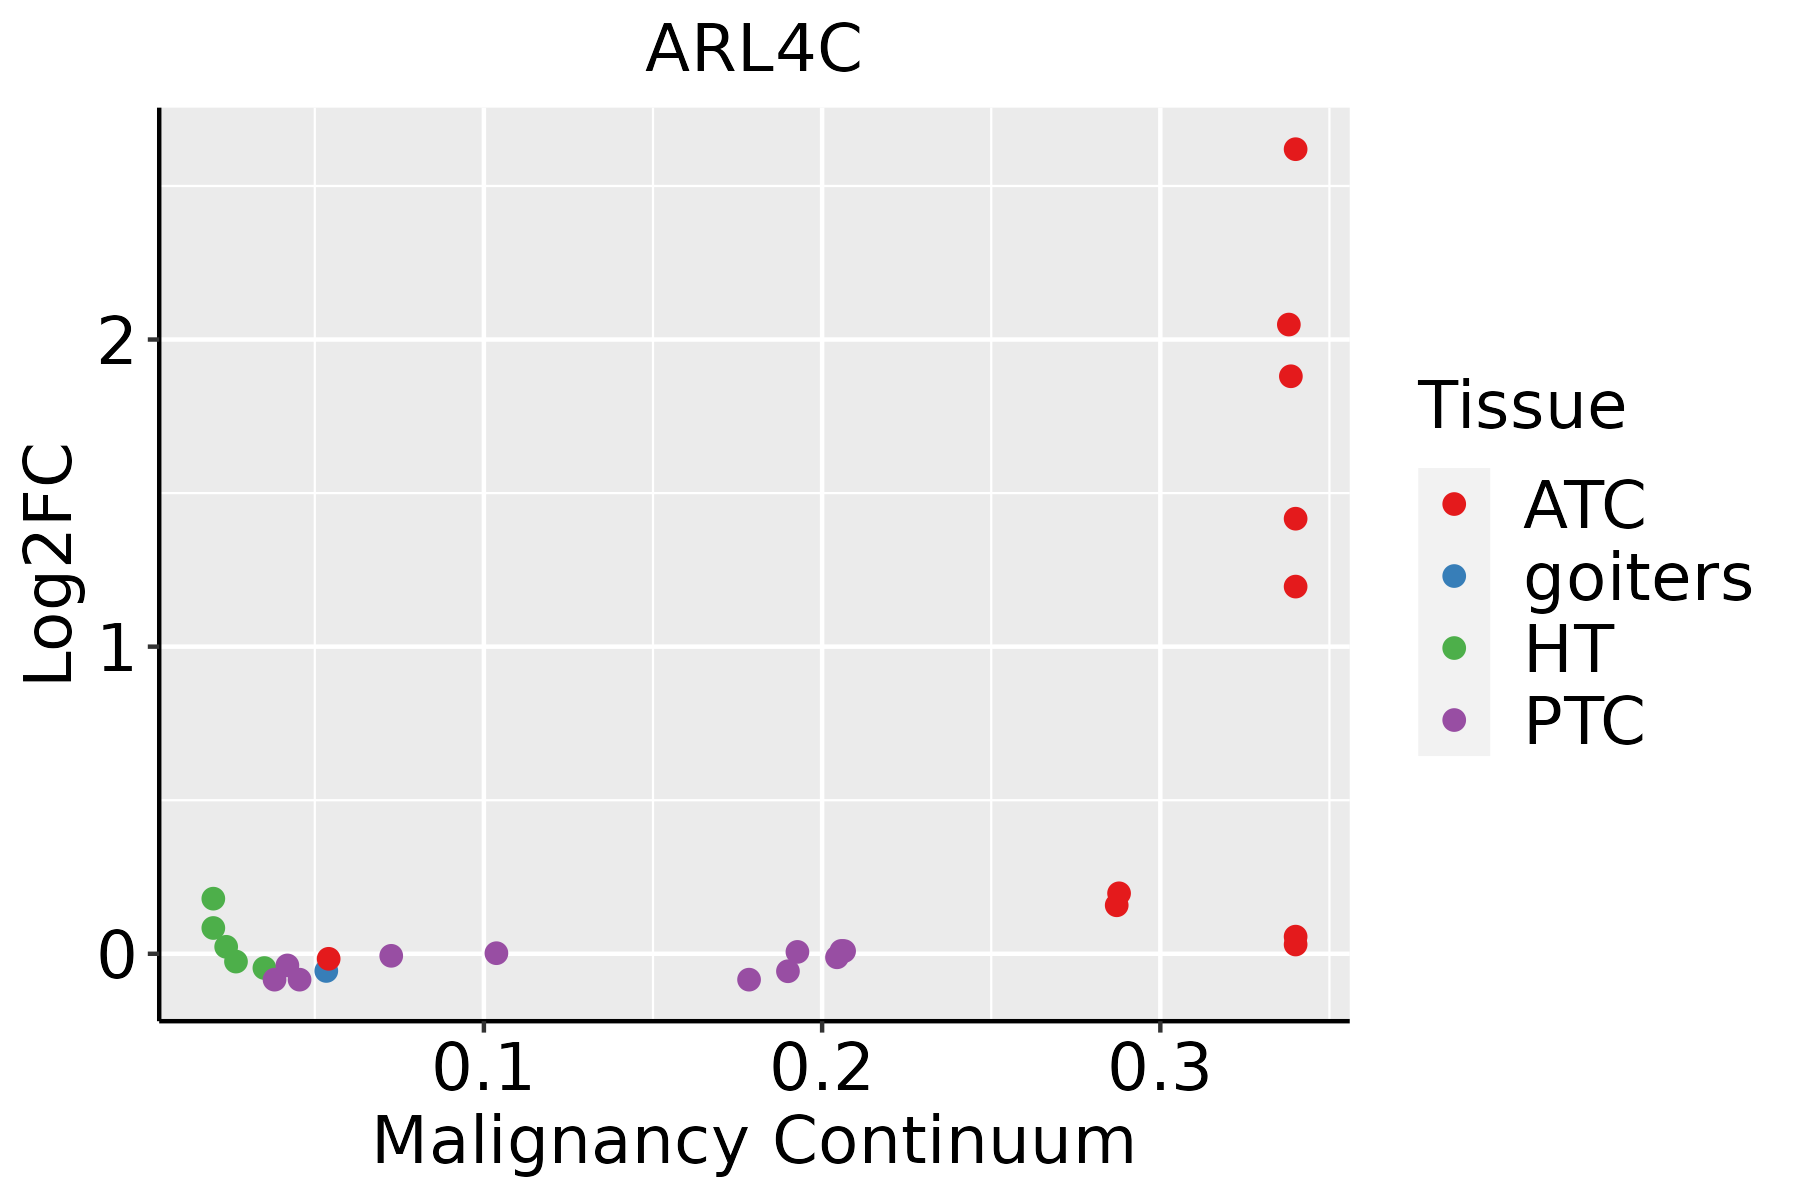 | ATC: Anaplastic thyroid cancer |
| HT: Hashimoto's thyroiditis | ||
| PTC: Papillary thyroid cancer |
| ∗log2FC in expression of this searched gene in stem-like cells from each diseased tissue sample relative to stem-like cells in normal samples in each tissue plotted against the malignancy continuum. Samples are colored based on if they are from different disease stage. |
Top |
Malignant transformation related pathway analysis |
| Find out the enriched GO biological processes and KEGG pathways involved in transition from healthy to precancer to cancer |
| Tissue | Disease Stage | Enriched GO biological Processes |
| Colorectum | AD |  |
| Colorectum | SER |  |
| Colorectum | MSS |  |
| Colorectum | MSI-H |  |
| Colorectum | FAP |  |
| ∗Top 15 enriched GO BP terms are showed in the bar plot of each disease state in each tissue. Each row represents a significant GO biological process which is colored according to the -log10(p.adjust). |
| Page: 1 2 3 4 5 6 7 8 9 |
| GO ID | Tissue | Disease Stage | Description | Gene Ratio | Bg Ratio | pvalue | p.adjust | Count |
| GO:001619710 | Esophagus | HGIN | endosomal transport | 57/2587 | 230/18723 | 5.74e-06 | 1.81e-04 | 57 |
| GO:009887610 | Esophagus | HGIN | vesicle-mediated transport to the plasma membrane | 36/2587 | 136/18723 | 6.76e-05 | 1.55e-03 | 36 |
| GO:001619715 | Esophagus | ESCC | endosomal transport | 168/8552 | 230/18723 | 2.28e-17 | 1.93e-15 | 168 |
| GO:009887615 | Esophagus | ESCC | vesicle-mediated transport to the plasma membrane | 99/8552 | 136/18723 | 1.13e-10 | 3.39e-09 | 99 |
| GO:00324565 | Esophagus | ESCC | endocytic recycling | 51/8552 | 73/18723 | 2.47e-05 | 2.10e-04 | 51 |
| GO:00161979 | Oral cavity | OSCC | endosomal transport | 141/7305 | 230/18723 | 5.40e-12 | 2.06e-10 | 141 |
| GO:00988769 | Oral cavity | OSCC | vesicle-mediated transport to the plasma membrane | 79/7305 | 136/18723 | 4.93e-06 | 5.58e-05 | 79 |
| GO:001619714 | Oral cavity | LP | endosomal transport | 98/4623 | 230/18723 | 1.65e-09 | 7.50e-08 | 98 |
| GO:009887614 | Oral cavity | LP | vesicle-mediated transport to the plasma membrane | 53/4623 | 136/18723 | 1.54e-04 | 1.76e-03 | 53 |
| GO:00324564 | Oral cavity | LP | endocytic recycling | 28/4623 | 73/18723 | 6.61e-03 | 3.86e-02 | 28 |
| GO:00988768 | Prostate | BPH | vesicle-mediated transport to the plasma membrane | 43/3107 | 136/18723 | 1.11e-05 | 1.51e-04 | 43 |
| GO:00161978 | Prostate | BPH | endosomal transport | 62/3107 | 230/18723 | 4.54e-05 | 4.77e-04 | 62 |
| GO:00324563 | Prostate | BPH | endocytic recycling | 21/3107 | 73/18723 | 6.45e-03 | 2.91e-02 | 21 |
| GO:009887613 | Prostate | Tumor | vesicle-mediated transport to the plasma membrane | 42/3246 | 136/18723 | 7.47e-05 | 7.84e-04 | 42 |
| GO:001619713 | Prostate | Tumor | endosomal transport | 62/3246 | 230/18723 | 1.65e-04 | 1.47e-03 | 62 |
| GO:001619716 | Skin | AK | endosomal transport | 41/1910 | 230/18723 | 2.76e-04 | 2.93e-03 | 41 |
| GO:009887616 | Skin | AK | vesicle-mediated transport to the plasma membrane | 23/1910 | 136/18723 | 1.05e-02 | 4.96e-02 | 23 |
| GO:001619717 | Skin | cSCC | endosomal transport | 98/4864 | 230/18723 | 2.71e-08 | 7.41e-07 | 98 |
| GO:009887617 | Skin | cSCC | vesicle-mediated transport to the plasma membrane | 59/4864 | 136/18723 | 7.60e-06 | 1.04e-04 | 59 |
| GO:001619719 | Thyroid | ATC | endosomal transport | 128/6293 | 230/18723 | 4.44e-12 | 1.75e-10 | 128 |
| Page: 1 2 |
| Pathway ID | Tissue | Disease Stage | Description | Gene Ratio | Bg Ratio | pvalue | p.adjust | qvalue | Count |
| Page: 1 |
Top |
Cell-cell communication analysis |
| Identification of potential cell-cell interactions between two cell types and their ligand-receptor pairs for different disease states |
| Ligand | Receptor | LRpair | Pathway | Tissue | Disease Stage |
| Page: 1 |
Top |
Single-cell gene regulatory network inference analysis |
| Find out the significant the regulons (TFs) and the target genes of each regulon across cell types for different disease states |
| TF | Cell Type | Tissue | Disease Stage | Target Gene | RSS | Regulon Activity |
| ∗The dot plots of a searched regulon are shown for all cell subpopulations in each disease state of each tissue based on the regulon specific score inferred using pySCENIC and by calculating the average expression. |
| Page: 1 |
Top |
Somatic mutation of malignant transformation related genes |
| Annotation of somatic variants for genes involved in malignant transformation |
| Hugo Symbol | Variant Class | Variant Classification | dbSNP RS | HGVSc | HGVSp | HGVSp Short | SWISSPROT | BIOTYPE | SIFT | PolyPhen | Tumor Sample Barcode | Tissue | Histology | Sex | Age | Stage | Therapy Types | Drugs | Outcome |
| ARL4C | SNV | Missense_Mutation | novel | c.83N>A | p.Thr28Lys | p.T28K | P56559 | protein_coding | deleterious(0) | probably_damaging(0.999) | TCGA-EK-A2RJ-01 | Cervix | cervical & endocervical cancer | Female | <65 | I/II | Unknown | Unknown | SD |
| ARL4C | SNV | Missense_Mutation | novel | c.364N>A | p.Leu122Met | p.L122M | P56559 | protein_coding | deleterious(0) | probably_damaging(0.945) | TCGA-AG-A00Y-01 | Colorectum | rectum adenocarcinoma | Male | >=65 | I/II | Unknown | Unknown | PD |
| ARL4C | SNV | Missense_Mutation | novel | c.559N>G | p.Lys187Glu | p.K187E | P56559 | protein_coding | deleterious(0) | possibly_damaging(0.899) | TCGA-A5-A0GG-01 | Endometrium | uterine corpus endometrioid carcinoma | Female | >=65 | I/II | Unknown | Unknown | SD |
| ARL4C | SNV | Missense_Mutation | novel | c.88N>T | p.Leu30Phe | p.L30F | P56559 | protein_coding | deleterious(0) | probably_damaging(0.999) | TCGA-AP-A1DV-01 | Endometrium | uterine corpus endometrioid carcinoma | Female | <65 | I/II | Unknown | Unknown | SD |
| ARL4C | SNV | Missense_Mutation | novel | c.323N>C | p.Leu108Pro | p.L108P | P56559 | protein_coding | deleterious(0) | probably_damaging(0.999) | TCGA-AX-A3FT-01 | Endometrium | uterine corpus endometrioid carcinoma | Female | <65 | I/II | Unknown | Unknown | SD |
| ARL4C | SNV | Missense_Mutation | novel | c.584A>G | p.Asp195Gly | p.D195G | P56559 | protein_coding | tolerated_low_confidence(0.1) | benign(0.001) | TCGA-EO-A22R-01 | Endometrium | uterine corpus endometrioid carcinoma | Female | <65 | I/II | Unknown | Unknown | SD |
| ARL4C | SNV | Missense_Mutation | c.407N>T | p.Pro136Leu | p.P136L | P56559 | protein_coding | deleterious(0.03) | benign(0.089) | TCGA-49-AARQ-01 | Lung | lung adenocarcinoma | Female | <65 | I/II | Unknown | Unknown | SD | |
| ARL4C | SNV | Missense_Mutation | novel | c.367N>G | p.Leu123Val | p.L123V | P56559 | protein_coding | tolerated(0.12) | probably_damaging(0.996) | TCGA-94-8491-01 | Lung | lung squamous cell carcinoma | Male | >=65 | I/II | Chemotherapy | unknown | PD |
| ARL4C | SNV | Missense_Mutation | novel | c.421N>A | p.Glu141Lys | p.E141K | P56559 | protein_coding | tolerated(0.24) | possibly_damaging(0.672) | TCGA-P3-A6T3-01 | Oral cavity | head & neck squamous cell carcinoma | Male | <65 | I/II | Chemotherapy | cisplatin | PD |
| ARL4C | SNV | Missense_Mutation | c.434C>T | p.Ala145Val | p.A145V | P56559 | protein_coding | deleterious(0.01) | probably_damaging(0.942) | TCGA-BR-7851-01 | Stomach | stomach adenocarcinoma | Male | >=65 | I/II | Unknown | Unknown | SD |
| Page: 1 2 |
Top |
Related drugs of malignant transformation related genes |
| Identification of chemicals and drugs interact with genes involved in malignant transfromation |
| (DGIdb 4.0) |
| Entrez ID | Symbol | Category | Interaction Types | Drug Claim Name | Drug Name | PMIDs |
| Page: 1 |

Copyright 2023-Present -The University of Texas Health Science Center at Houston |