
|
|||||
|
 | |
| |
| |
| |
| |
| |
|
Gene: ARL3 |
Gene summary for ARL3 |
| Gene information | Species | Human | Gene symbol | ARL3 | Gene ID | 403 |
| Gene name | ADP ribosylation factor like GTPase 3 | |
| Gene Alias | ARFL3 | |
| Cytomap | 10q24.32 | |
| Gene Type | protein-coding | GO ID | GO:0000226 | UniProtAcc | P36405 |
Top |
Malignant transformation analysis |
| Identification of the aberrant gene expression in precancerous and cancerous lesions by comparing the gene expression of stem-like cells in diseased tissues with normal stem cells |
| Entrez ID | Symbol | Replicates | Species | Organ | Tissue | Adj P-value | Log2FC | Malignancy |
| 403 | ARL3 | AEH-subject1 | Human | Endometrium | AEH | 1.94e-08 | -2.80e-01 | -0.3059 |
| 403 | ARL3 | AEH-subject2 | Human | Endometrium | AEH | 6.44e-08 | -3.06e-01 | -0.2525 |
| 403 | ARL3 | AEH-subject3 | Human | Endometrium | AEH | 4.25e-05 | -8.84e-02 | -0.2576 |
| 403 | ARL3 | AEH-subject4 | Human | Endometrium | AEH | 1.77e-04 | -3.83e-02 | -0.2657 |
| 403 | ARL3 | AEH-subject5 | Human | Endometrium | AEH | 6.67e-04 | -2.90e-01 | -0.2953 |
| 403 | ARL3 | EEC-subject2 | Human | Endometrium | EEC | 5.98e-16 | -4.47e-01 | -0.2607 |
| 403 | ARL3 | EEC-subject3 | Human | Endometrium | EEC | 4.63e-31 | -4.78e-01 | -0.2525 |
| 403 | ARL3 | EEC-subject4 | Human | Endometrium | EEC | 2.23e-02 | -1.35e-01 | -0.2571 |
| 403 | ARL3 | EEC-subject5 | Human | Endometrium | EEC | 2.88e-11 | -3.34e-01 | -0.249 |
| 403 | ARL3 | GSM5276934 | Human | Endometrium | EEC | 4.57e-12 | -4.26e-01 | -0.0913 |
| 403 | ARL3 | GSM5276937 | Human | Endometrium | EEC | 2.31e-10 | -4.20e-01 | -0.0897 |
| 403 | ARL3 | GSM6177620_NYU_UCEC1_lib1_lib1 | Human | Endometrium | EEC | 1.52e-28 | -5.00e-01 | -0.1869 |
| 403 | ARL3 | GSM6177620_NYU_UCEC1_lib2_lib2 | Human | Endometrium | EEC | 1.56e-28 | -4.60e-01 | -0.1875 |
| 403 | ARL3 | GSM6177620_NYU_UCEC1_lib3_lib3 | Human | Endometrium | EEC | 5.07e-30 | -5.33e-01 | -0.1883 |
| 403 | ARL3 | GSM6177621_NYU_UCEC2_lib1_lib1 | Human | Endometrium | EEC | 1.28e-26 | -1.90e-01 | -0.1934 |
| 403 | ARL3 | GSM6177622_NYU_UCEC3_lib1_lib1 | Human | Endometrium | EEC | 9.41e-43 | -5.03e-01 | -0.1917 |
| 403 | ARL3 | GSM6177622_NYU_UCEC3_lib2_lib2 | Human | Endometrium | EEC | 3.87e-37 | -5.23e-01 | -0.1916 |
| 403 | ARL3 | GSM6177623_NYU_UCEC3_Vis | Human | Endometrium | EEC | 3.53e-09 | -3.65e-01 | -0.1269 |
| 403 | ARL3 | LZE4T | Human | Esophagus | ESCC | 1.17e-04 | 1.62e-01 | 0.0811 |
| 403 | ARL3 | LZE5T | Human | Esophagus | ESCC | 5.27e-03 | 5.87e-01 | 0.0514 |
| Page: 1 2 3 4 5 6 7 |
| Tissue | Expression Dynamics | Abbreviation |
| Endometrium |  | AEH: Atypical endometrial hyperplasia |
| EEC: Endometrioid Cancer | ||
| Esophagus |  | ESCC: Esophageal squamous cell carcinoma |
| HGIN: High-grade intraepithelial neoplasias | ||
| LGIN: Low-grade intraepithelial neoplasias | ||
| Liver | 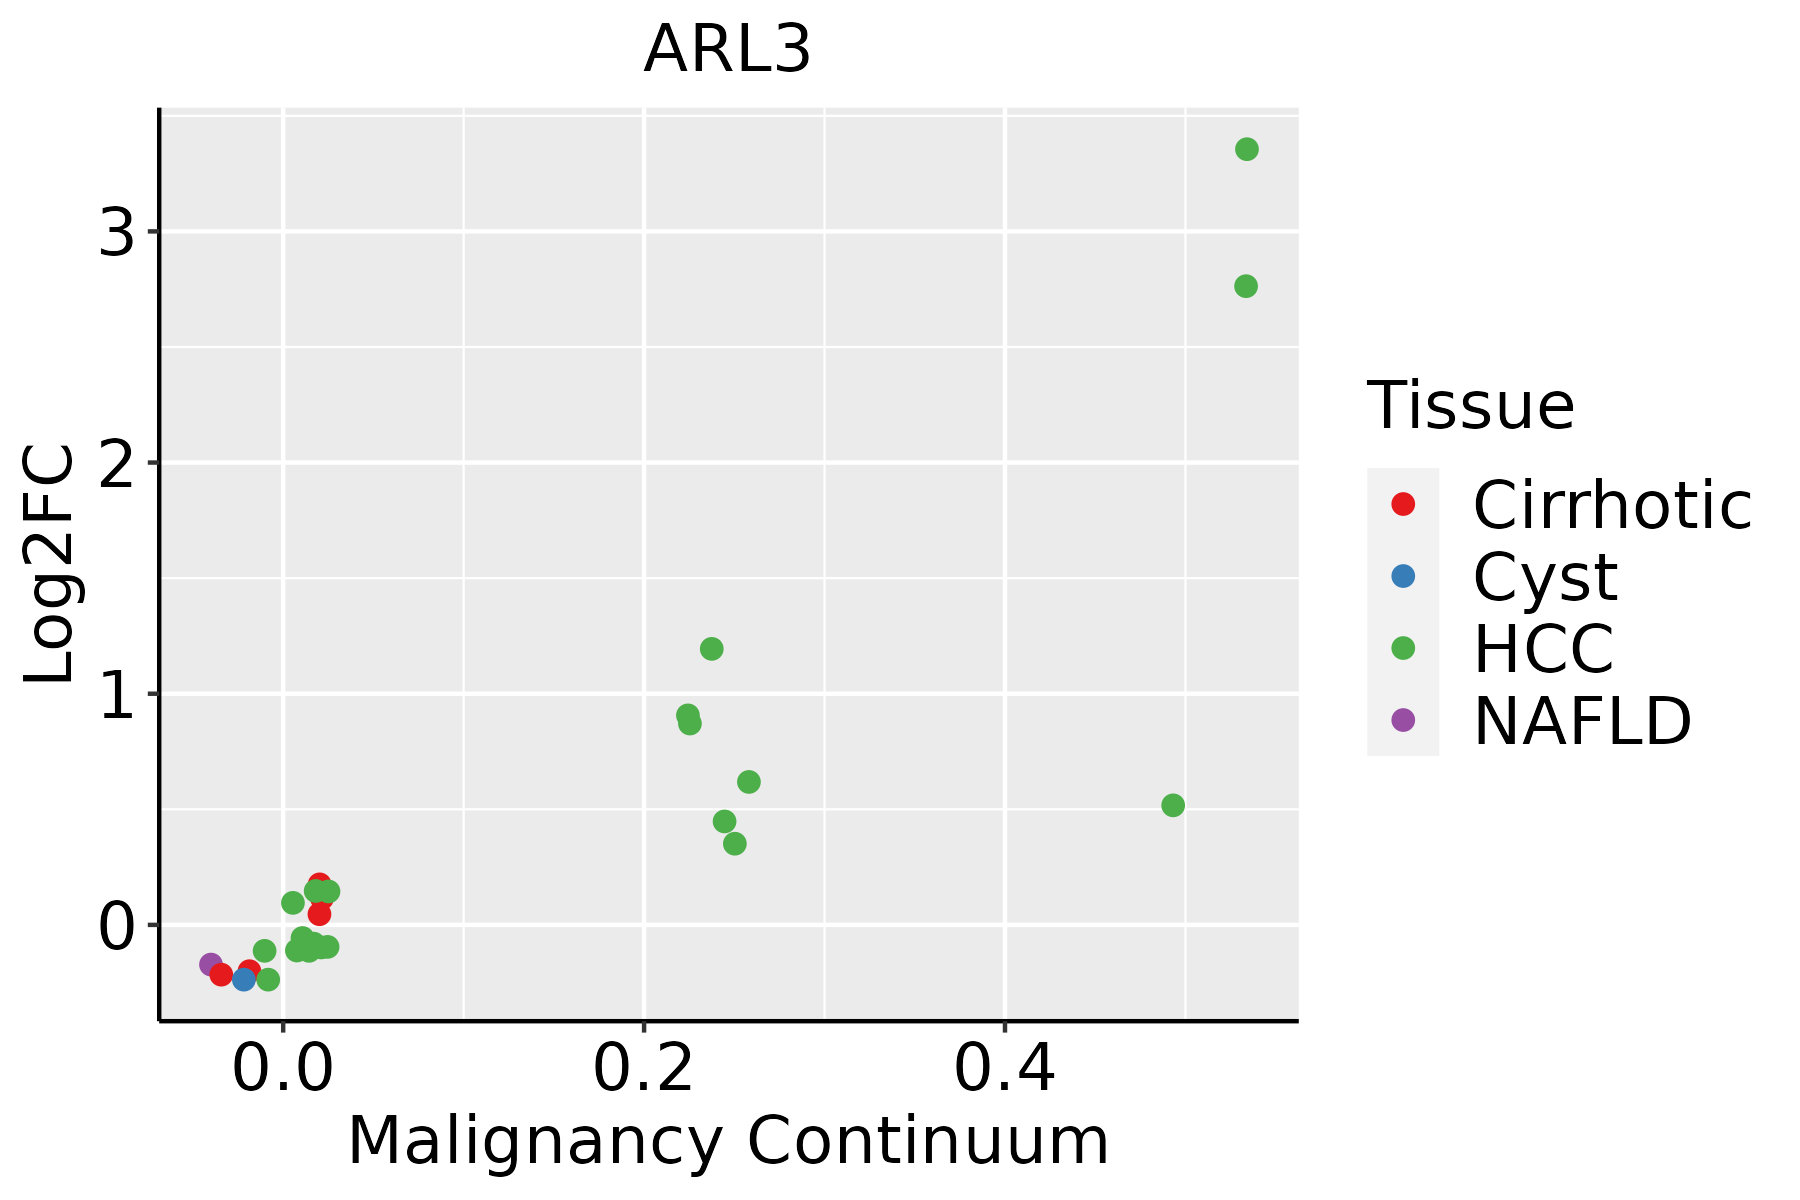 | HCC: Hepatocellular carcinoma |
| NAFLD: Non-alcoholic fatty liver disease | ||
| Oral Cavity |  | EOLP: Erosive Oral lichen planus |
| LP: leukoplakia | ||
| NEOLP: Non-erosive oral lichen planus | ||
| OSCC: Oral squamous cell carcinoma | ||
| Skin |  | AK: Actinic keratosis |
| cSCC: Cutaneous squamous cell carcinoma | ||
| SCCIS:squamous cell carcinoma in situ | ||
| Thyroid | 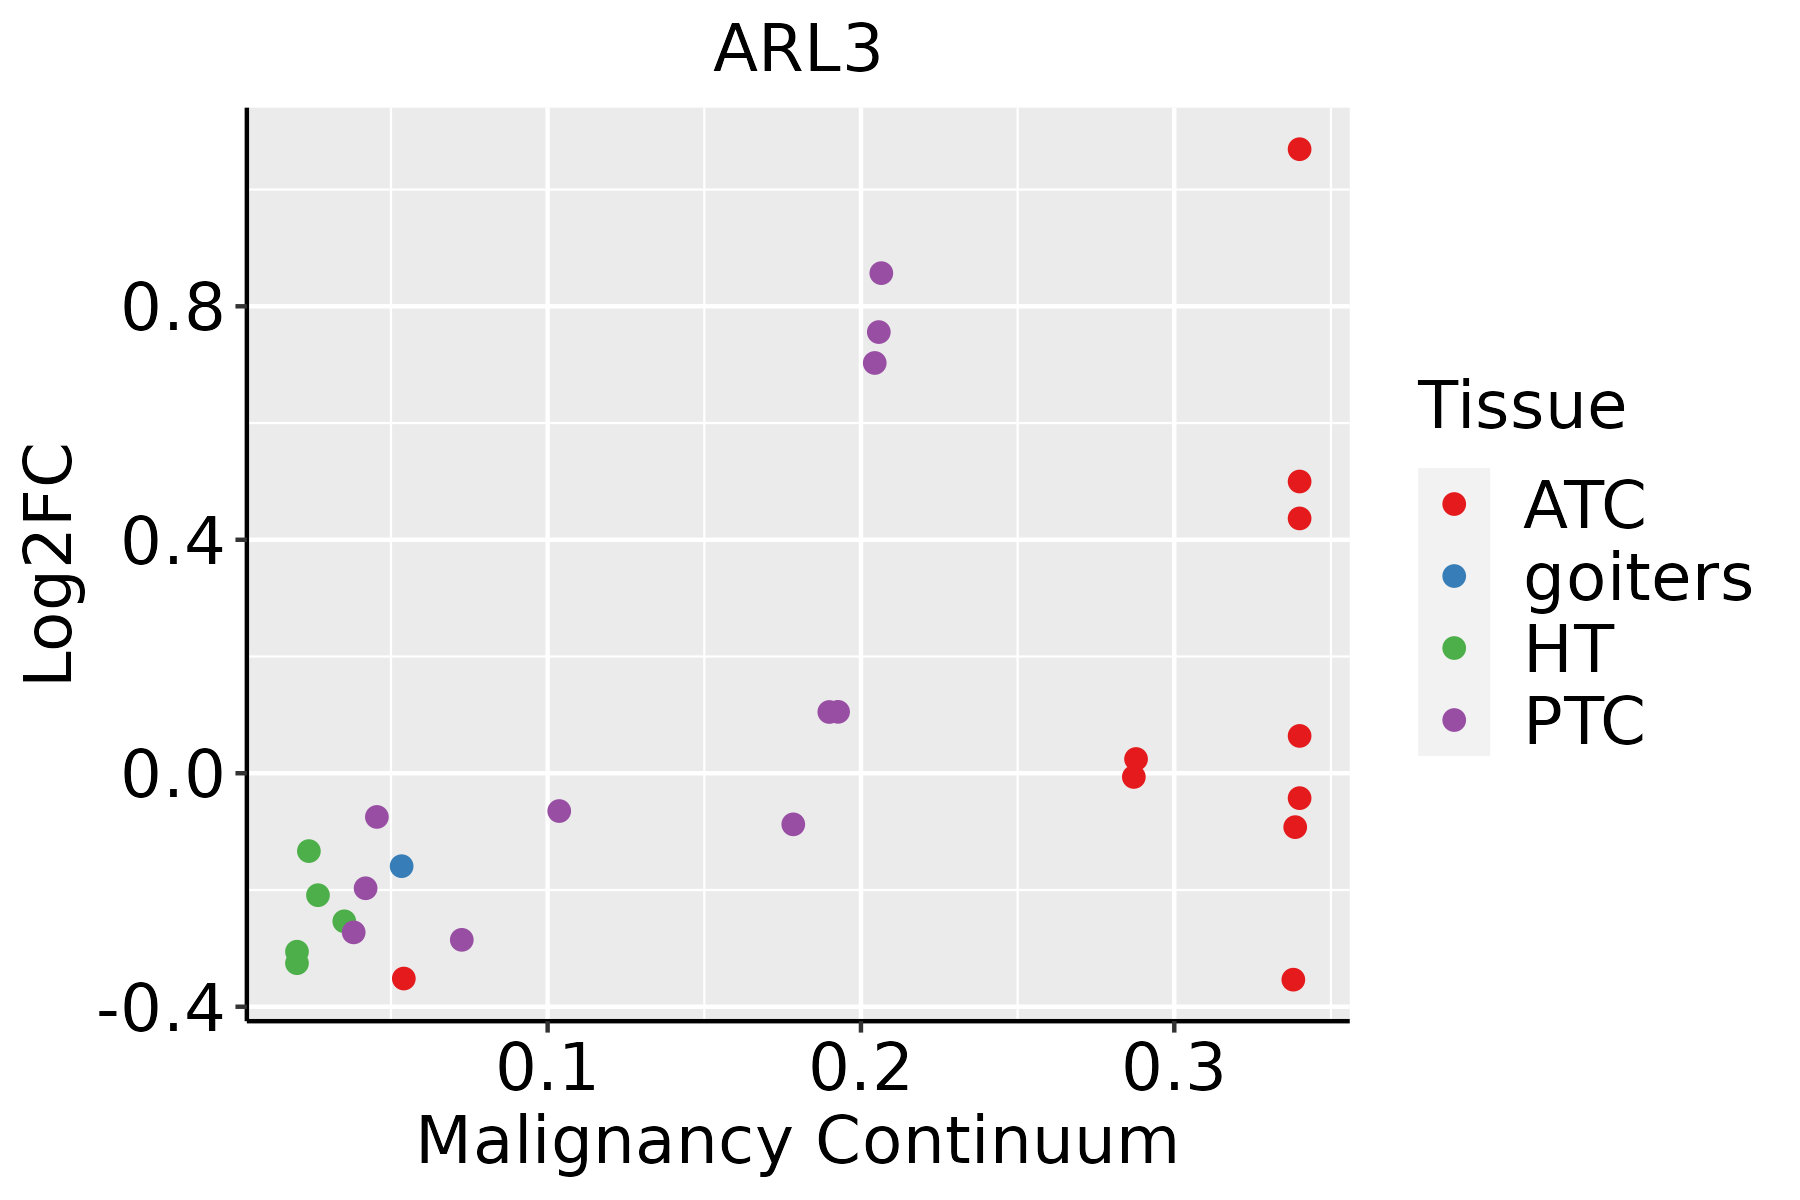 | ATC: Anaplastic thyroid cancer |
| HT: Hashimoto's thyroiditis | ||
| PTC: Papillary thyroid cancer |
| ∗log2FC in expression of this searched gene in stem-like cells from each diseased tissue sample relative to stem-like cells in normal samples in each tissue plotted against the malignancy continuum. Samples are colored based on if they are from different disease stage. |
Top |
Malignant transformation related pathway analysis |
| Find out the enriched GO biological processes and KEGG pathways involved in transition from healthy to precancer to cancer |
| Tissue | Disease Stage | Enriched GO biological Processes |
| Colorectum | AD |  |
| Colorectum | SER |  |
| Colorectum | MSS |  |
| Colorectum | MSI-H |  |
| Colorectum | FAP |  |
| ∗Top 15 enriched GO BP terms are showed in the bar plot of each disease state in each tissue. Each row represents a significant GO biological process which is colored according to the -log10(p.adjust). |
| Page: 1 2 3 4 5 6 7 8 9 |
| GO ID | Tissue | Disease Stage | Description | Gene Ratio | Bg Ratio | pvalue | p.adjust | Count |
| GO:190290316 | Endometrium | AEH | regulation of supramolecular fiber organization | 83/2100 | 383/18723 | 2.20e-09 | 1.78e-07 | 83 |
| GO:004325416 | Endometrium | AEH | regulation of protein-containing complex assembly | 83/2100 | 428/18723 | 3.90e-07 | 1.63e-05 | 83 |
| GO:19907789 | Endometrium | AEH | protein localization to cell periphery | 68/2100 | 333/18723 | 6.38e-07 | 2.38e-05 | 68 |
| GO:005125816 | Endometrium | AEH | protein polymerization | 62/2100 | 297/18723 | 9.04e-07 | 3.19e-05 | 62 |
| GO:190290516 | Endometrium | AEH | positive regulation of supramolecular fiber organization | 48/2100 | 209/18723 | 9.11e-07 | 3.20e-05 | 48 |
| GO:003133416 | Endometrium | AEH | positive regulation of protein-containing complex assembly | 52/2100 | 237/18723 | 1.43e-06 | 4.60e-05 | 52 |
| GO:00016556 | Endometrium | AEH | urogenital system development | 67/2100 | 338/18723 | 2.30e-06 | 6.76e-05 | 67 |
| GO:00720015 | Endometrium | AEH | renal system development | 61/2100 | 302/18723 | 3.43e-06 | 9.24e-05 | 61 |
| GO:00481939 | Endometrium | AEH | Golgi vesicle transport | 60/2100 | 296/18723 | 3.65e-06 | 9.79e-05 | 60 |
| GO:003227116 | Endometrium | AEH | regulation of protein polymerization | 50/2100 | 233/18723 | 4.43e-06 | 1.16e-04 | 50 |
| GO:00009108 | Endometrium | AEH | cytokinesis | 40/2100 | 173/18723 | 6.01e-06 | 1.49e-04 | 40 |
| GO:005149514 | Endometrium | AEH | positive regulation of cytoskeleton organization | 47/2100 | 226/18723 | 2.00e-05 | 4.05e-04 | 47 |
| GO:00018224 | Endometrium | AEH | kidney development | 57/2100 | 293/18723 | 2.25e-05 | 4.35e-04 | 57 |
| GO:003227315 | Endometrium | AEH | positive regulation of protein polymerization | 32/2100 | 138/18723 | 4.64e-05 | 7.71e-04 | 32 |
| GO:00616403 | Endometrium | AEH | cytoskeleton-dependent cytokinesis | 24/2100 | 100/18723 | 2.27e-04 | 2.75e-03 | 24 |
| GO:00307058 | Endometrium | AEH | cytoskeleton-dependent intracellular transport | 38/2100 | 195/18723 | 4.72e-04 | 4.91e-03 | 38 |
| GO:00002813 | Endometrium | AEH | mitotic cytokinesis | 17/2100 | 71/18723 | 1.82e-03 | 1.45e-02 | 17 |
| GO:00311165 | Endometrium | AEH | positive regulation of microtubule polymerization | 10/2100 | 33/18723 | 2.51e-03 | 1.87e-02 | 10 |
| GO:00311125 | Endometrium | AEH | positive regulation of microtubule polymerization or depolymerization | 10/2100 | 37/18723 | 6.23e-03 | 3.70e-02 | 10 |
| GO:00311135 | Endometrium | AEH | regulation of microtubule polymerization | 13/2100 | 55/18723 | 6.76e-03 | 3.94e-02 | 13 |
| Page: 1 2 3 4 5 6 7 8 9 10 11 12 13 14 15 |
| Pathway ID | Tissue | Disease Stage | Description | Gene Ratio | Bg Ratio | pvalue | p.adjust | qvalue | Count |
| Page: 1 |
Top |
Cell-cell communication analysis |
| Identification of potential cell-cell interactions between two cell types and their ligand-receptor pairs for different disease states |
| Ligand | Receptor | LRpair | Pathway | Tissue | Disease Stage |
| Page: 1 |
Top |
Single-cell gene regulatory network inference analysis |
| Find out the significant the regulons (TFs) and the target genes of each regulon across cell types for different disease states |
| TF | Cell Type | Tissue | Disease Stage | Target Gene | RSS | Regulon Activity |
| ∗The dot plots of a searched regulon are shown for all cell subpopulations in each disease state of each tissue based on the regulon specific score inferred using pySCENIC and by calculating the average expression. |
| Page: 1 |
Top |
Somatic mutation of malignant transformation related genes |
| Annotation of somatic variants for genes involved in malignant transformation |
| Hugo Symbol | Variant Class | Variant Classification | dbSNP RS | HGVSc | HGVSp | HGVSp Short | SWISSPROT | BIOTYPE | SIFT | PolyPhen | Tumor Sample Barcode | Tissue | Histology | Sex | Age | Stage | Therapy Types | Drugs | Outcome |
| ARL3 | SNV | Missense_Mutation | c.412N>C | p.Glu138Gln | p.E138Q | P36405 | protein_coding | tolerated(0.06) | possibly_damaging(0.647) | TCGA-D8-A1JA-01 | Breast | breast invasive carcinoma | Female | <65 | III/IV | Chemotherapy | adriamycin | PD | |
| ARL3 | SNV | Missense_Mutation | c.153N>G | p.Phe51Leu | p.F51L | P36405 | protein_coding | deleterious(0) | possibly_damaging(0.688) | TCGA-WL-A834-01 | Cervix | cervical & endocervical cancer | Female | <65 | I/II | Chemotherapy | paclitaxel | SD | |
| ARL3 | SNV | Missense_Mutation | rs150077149 | c.395N>T | p.Thr132Ile | p.T132I | P36405 | protein_coding | deleterious(0.02) | benign(0.431) | TCGA-DM-A1HB-01 | Colorectum | colon adenocarcinoma | Male | >=65 | III/IV | Unknown | Unknown | SD |
| ARL3 | SNV | Missense_Mutation | novel | c.543N>T | p.Lys181Asn | p.K181N | P36405 | protein_coding | deleterious(0.03) | benign(0.186) | TCGA-AG-A002-01 | Colorectum | rectum adenocarcinoma | Male | <65 | I/II | Unknown | Unknown | SD |
| ARL3 | SNV | Missense_Mutation | novel | c.384N>T | p.Gln128His | p.Q128H | P36405 | protein_coding | deleterious(0.01) | probably_damaging(1) | TCGA-A5-A0G2-01 | Endometrium | uterine corpus endometrioid carcinoma | Female | <65 | III/IV | Unknown | Unknown | SD |
| ARL3 | SNV | Missense_Mutation | rs757334225 | c.52G>A | p.Val18Met | p.V18M | P36405 | protein_coding | tolerated(1) | benign(0.328) | TCGA-BG-A222-01 | Endometrium | uterine corpus endometrioid carcinoma | Female | <65 | I/II | Unknown | Unknown | SD |
| ARL3 | SNV | Missense_Mutation | rs368901451 | c.23N>A | p.Arg8His | p.R8H | P36405 | protein_coding | deleterious(0) | possibly_damaging(0.889) | TCGA-EY-A549-01 | Endometrium | uterine corpus endometrioid carcinoma | Female | >=65 | I/II | Unknown | Unknown | SD |
| ARL3 | SNV | Missense_Mutation | novel | c.359N>A | p.Pro120Gln | p.P120Q | P36405 | protein_coding | deleterious(0) | probably_damaging(0.997) | TCGA-QS-A744-01 | Endometrium | uterine corpus endometrioid carcinoma | Female | >=65 | III/IV | Chemotherapy | carboplatin | SD |
| ARL3 | SNV | Missense_Mutation | rs368901451 | c.23N>A | p.Arg8His | p.R8H | P36405 | protein_coding | deleterious(0) | possibly_damaging(0.889) | TCGA-DD-AACG-01 | Liver | liver hepatocellular carcinoma | Male | <65 | I/II | Unknown | Unknown | PD |
| ARL3 | SNV | Missense_Mutation | novel | c.197G>T | p.Trp66Leu | p.W66L | P36405 | protein_coding | deleterious(0) | probably_damaging(0.961) | TCGA-05-4396-01 | Lung | lung adenocarcinoma | Male | >=65 | III/IV | Unknown | Unknown | SD |
| Page: 1 2 |
Top |
Related drugs of malignant transformation related genes |
| Identification of chemicals and drugs interact with genes involved in malignant transfromation |
| (DGIdb 4.0) |
| Entrez ID | Symbol | Category | Interaction Types | Drug Claim Name | Drug Name | PMIDs |
| Page: 1 |

Copyright 2023-Present -The University of Texas Health Science Center at Houston |