
|
|||||
|
 | |
| |
| |
| |
| |
| |
|
Gene: ARL2BP |
Gene summary for ARL2BP |
| Gene information | Species | Human | Gene symbol | ARL2BP | Gene ID | 23568 |
| Gene name | ADP ribosylation factor like GTPase 2 binding protein | |
| Gene Alias | BART | |
| Cytomap | 16q13 | |
| Gene Type | protein-coding | GO ID | GO:0001932 | UniProtAcc | A0A024R6U9 |
Top |
Malignant transformation analysis |
| Identification of the aberrant gene expression in precancerous and cancerous lesions by comparing the gene expression of stem-like cells in diseased tissues with normal stem cells |
| Entrez ID | Symbol | Replicates | Species | Organ | Tissue | Adj P-value | Log2FC | Malignancy |
| 23568 | ARL2BP | LZE2T | Human | Esophagus | ESCC | 2.06e-02 | 4.43e-01 | 0.082 |
| 23568 | ARL2BP | LZE4T | Human | Esophagus | ESCC | 4.56e-16 | 7.30e-01 | 0.0811 |
| 23568 | ARL2BP | LZE7T | Human | Esophagus | ESCC | 2.93e-04 | 6.05e-01 | 0.0667 |
| 23568 | ARL2BP | LZE8T | Human | Esophagus | ESCC | 1.15e-06 | 1.36e-01 | 0.067 |
| 23568 | ARL2BP | LZE20T | Human | Esophagus | ESCC | 1.40e-06 | 2.52e-01 | 0.0662 |
| 23568 | ARL2BP | LZE22T | Human | Esophagus | ESCC | 8.17e-06 | 6.79e-01 | 0.068 |
| 23568 | ARL2BP | LZE24T | Human | Esophagus | ESCC | 3.88e-30 | 8.04e-01 | 0.0596 |
| 23568 | ARL2BP | P1T-E | Human | Esophagus | ESCC | 3.18e-12 | 1.02e+00 | 0.0875 |
| 23568 | ARL2BP | P2T-E | Human | Esophagus | ESCC | 9.79e-45 | 7.34e-01 | 0.1177 |
| 23568 | ARL2BP | P4T-E | Human | Esophagus | ESCC | 5.31e-46 | 1.11e+00 | 0.1323 |
| 23568 | ARL2BP | P5T-E | Human | Esophagus | ESCC | 1.47e-31 | 7.16e-01 | 0.1327 |
| 23568 | ARL2BP | P8T-E | Human | Esophagus | ESCC | 4.98e-46 | 7.72e-01 | 0.0889 |
| 23568 | ARL2BP | P9T-E | Human | Esophagus | ESCC | 1.31e-27 | 6.37e-01 | 0.1131 |
| 23568 | ARL2BP | P10T-E | Human | Esophagus | ESCC | 7.78e-29 | 6.60e-01 | 0.116 |
| 23568 | ARL2BP | P11T-E | Human | Esophagus | ESCC | 1.43e-35 | 1.26e+00 | 0.1426 |
| 23568 | ARL2BP | P12T-E | Human | Esophagus | ESCC | 3.68e-32 | 6.66e-01 | 0.1122 |
| 23568 | ARL2BP | P15T-E | Human | Esophagus | ESCC | 8.99e-29 | 7.08e-01 | 0.1149 |
| 23568 | ARL2BP | P16T-E | Human | Esophagus | ESCC | 1.27e-24 | 3.75e-01 | 0.1153 |
| 23568 | ARL2BP | P17T-E | Human | Esophagus | ESCC | 3.87e-12 | 6.62e-01 | 0.1278 |
| 23568 | ARL2BP | P19T-E | Human | Esophagus | ESCC | 5.42e-22 | 1.39e+00 | 0.1662 |
| Page: 1 2 3 4 5 6 |
| Tissue | Expression Dynamics | Abbreviation |
| Esophagus |  | ESCC: Esophageal squamous cell carcinoma |
| HGIN: High-grade intraepithelial neoplasias | ||
| LGIN: Low-grade intraepithelial neoplasias | ||
| Liver | 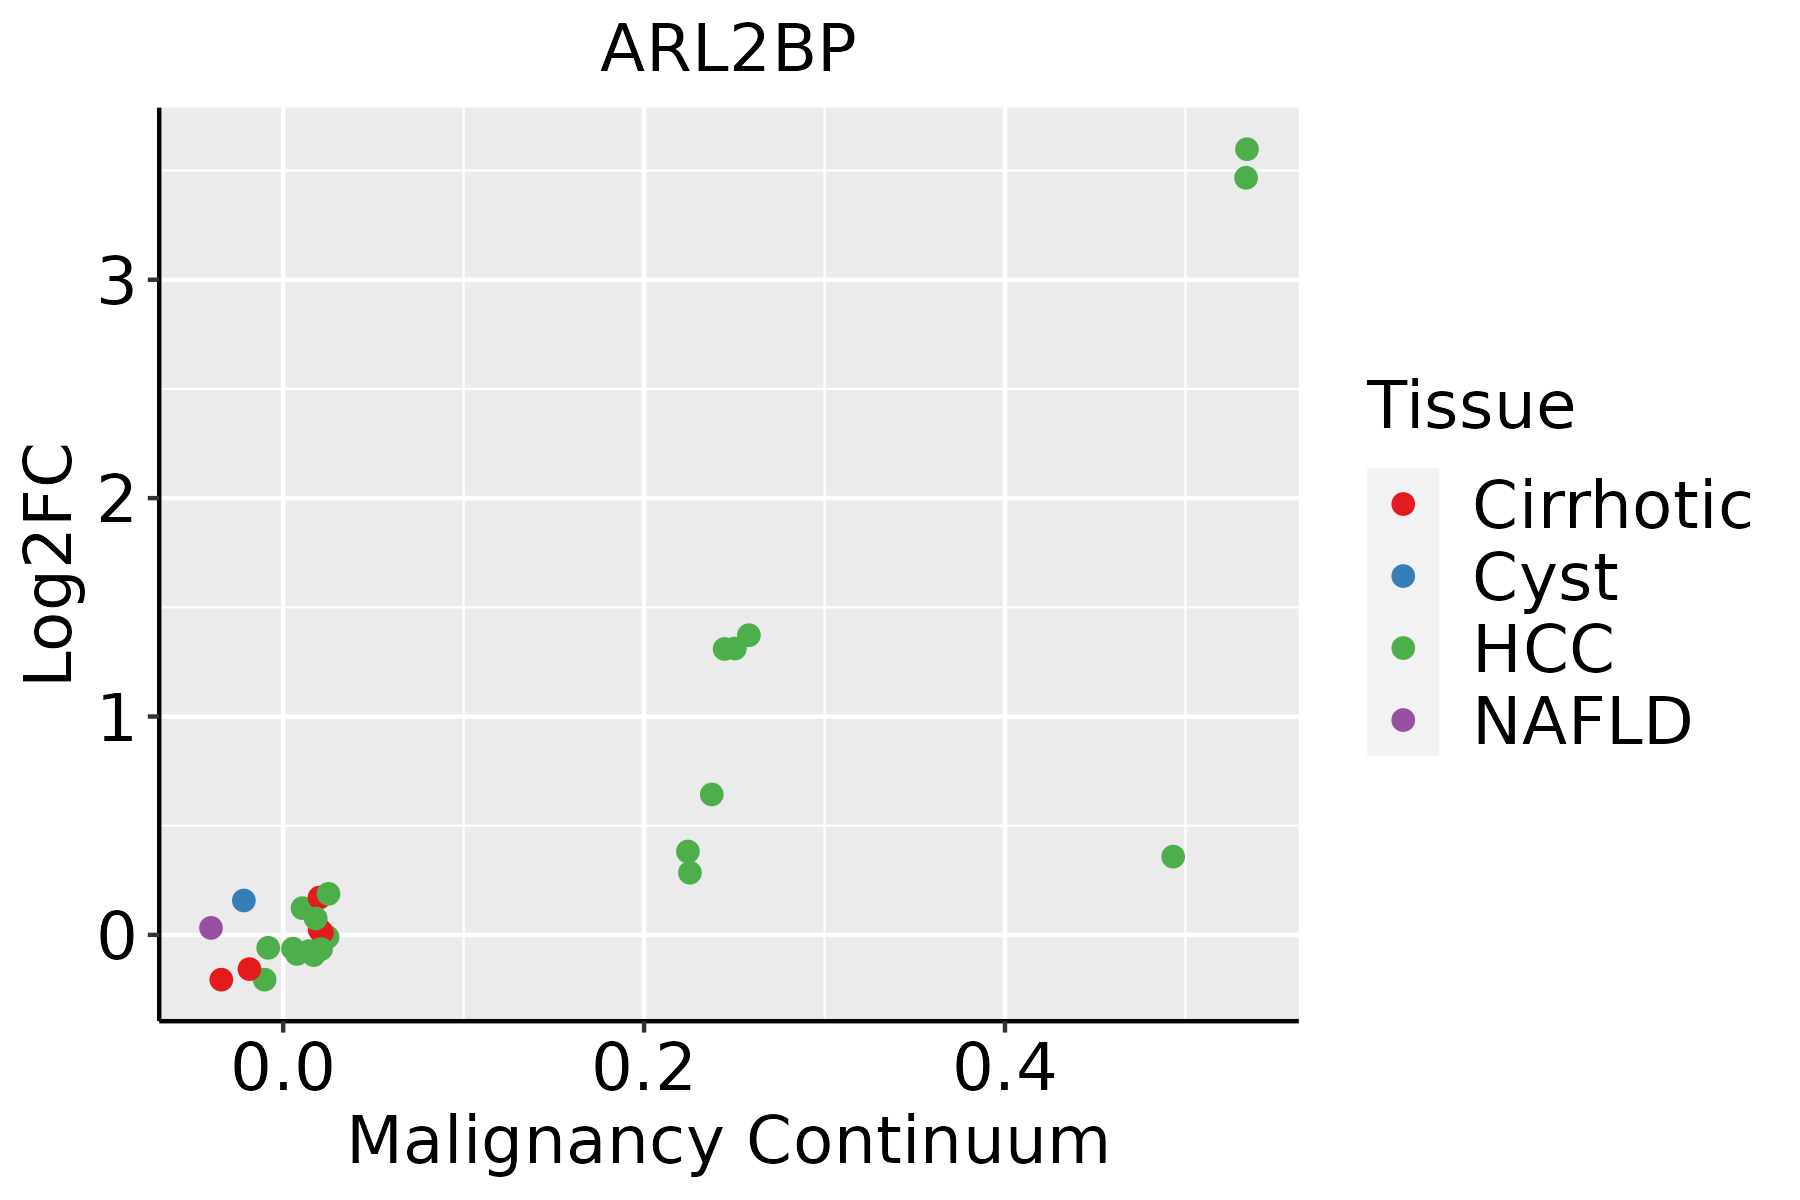 | HCC: Hepatocellular carcinoma |
| NAFLD: Non-alcoholic fatty liver disease | ||
| Oral Cavity | 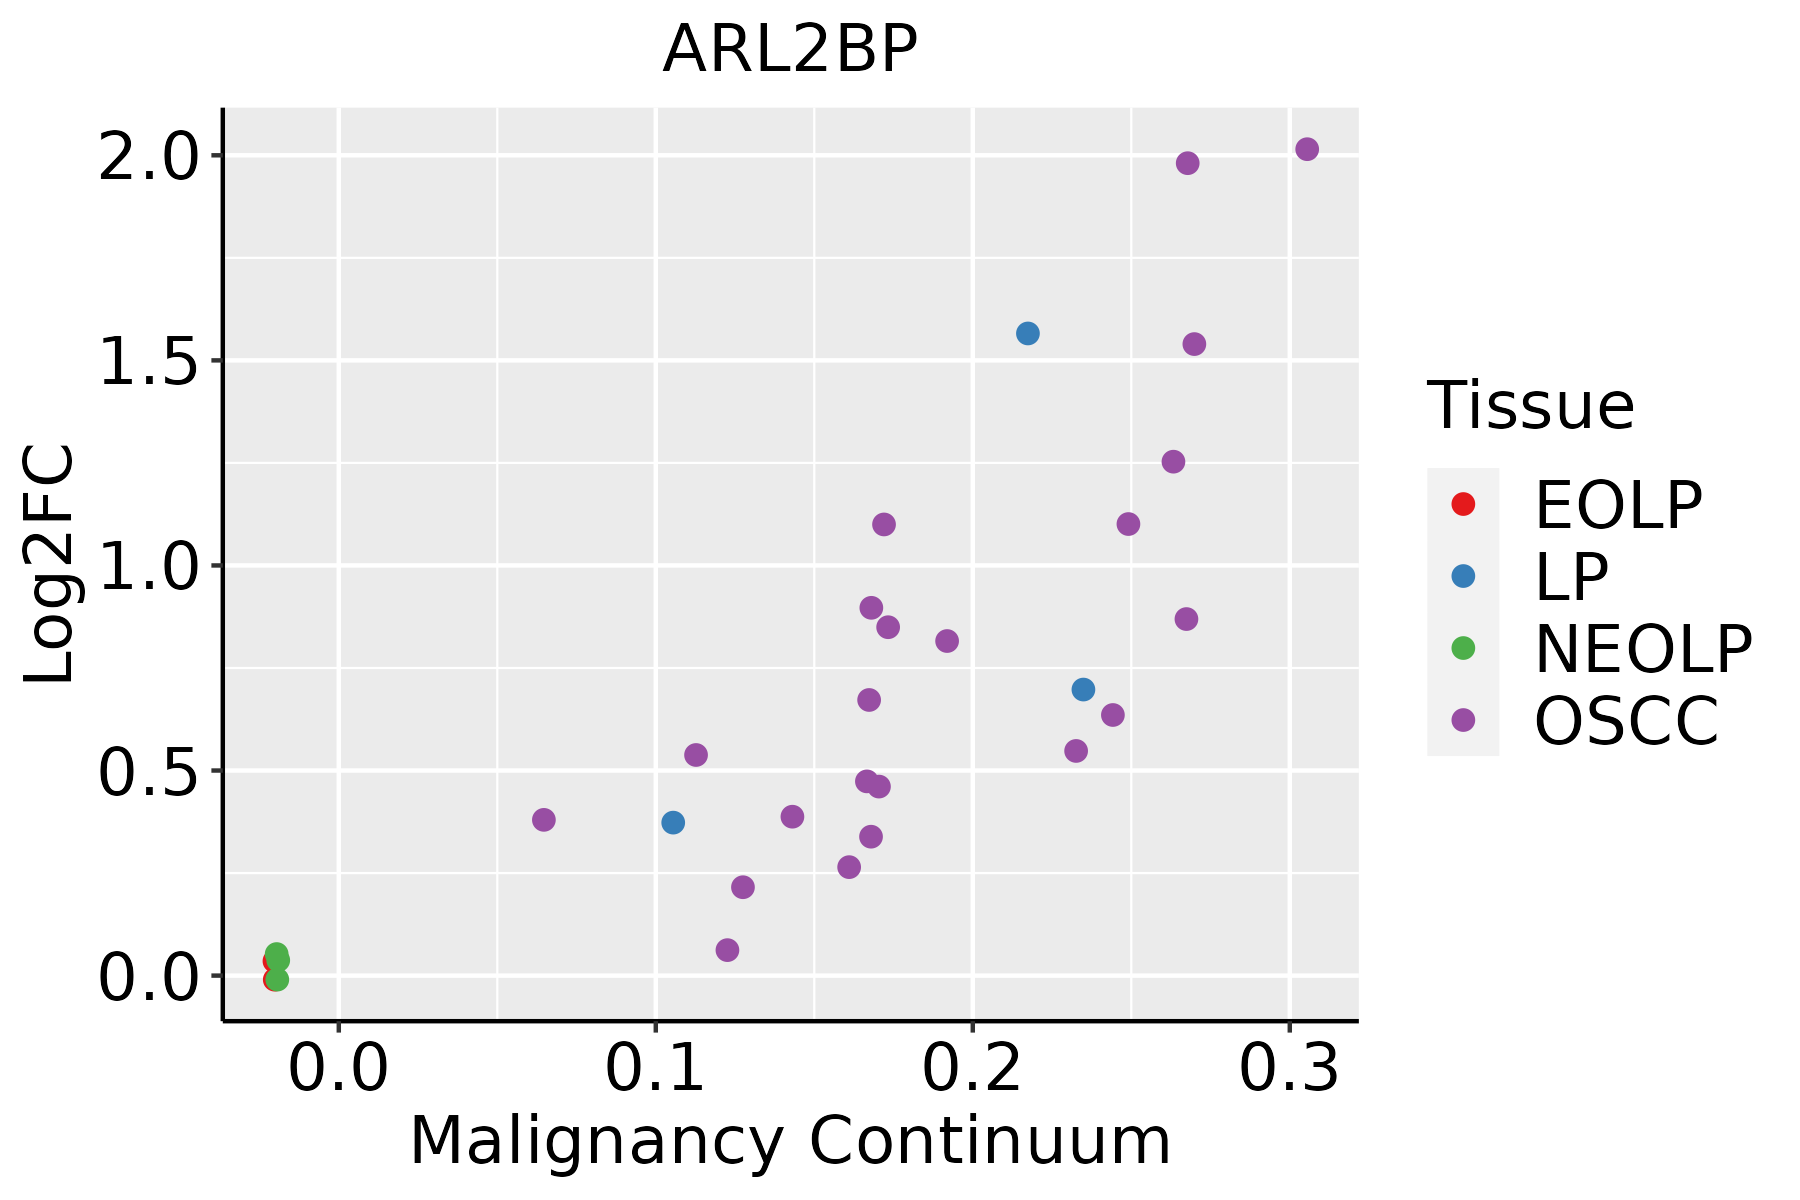 | EOLP: Erosive Oral lichen planus |
| LP: leukoplakia | ||
| NEOLP: Non-erosive oral lichen planus | ||
| OSCC: Oral squamous cell carcinoma | ||
| Skin | 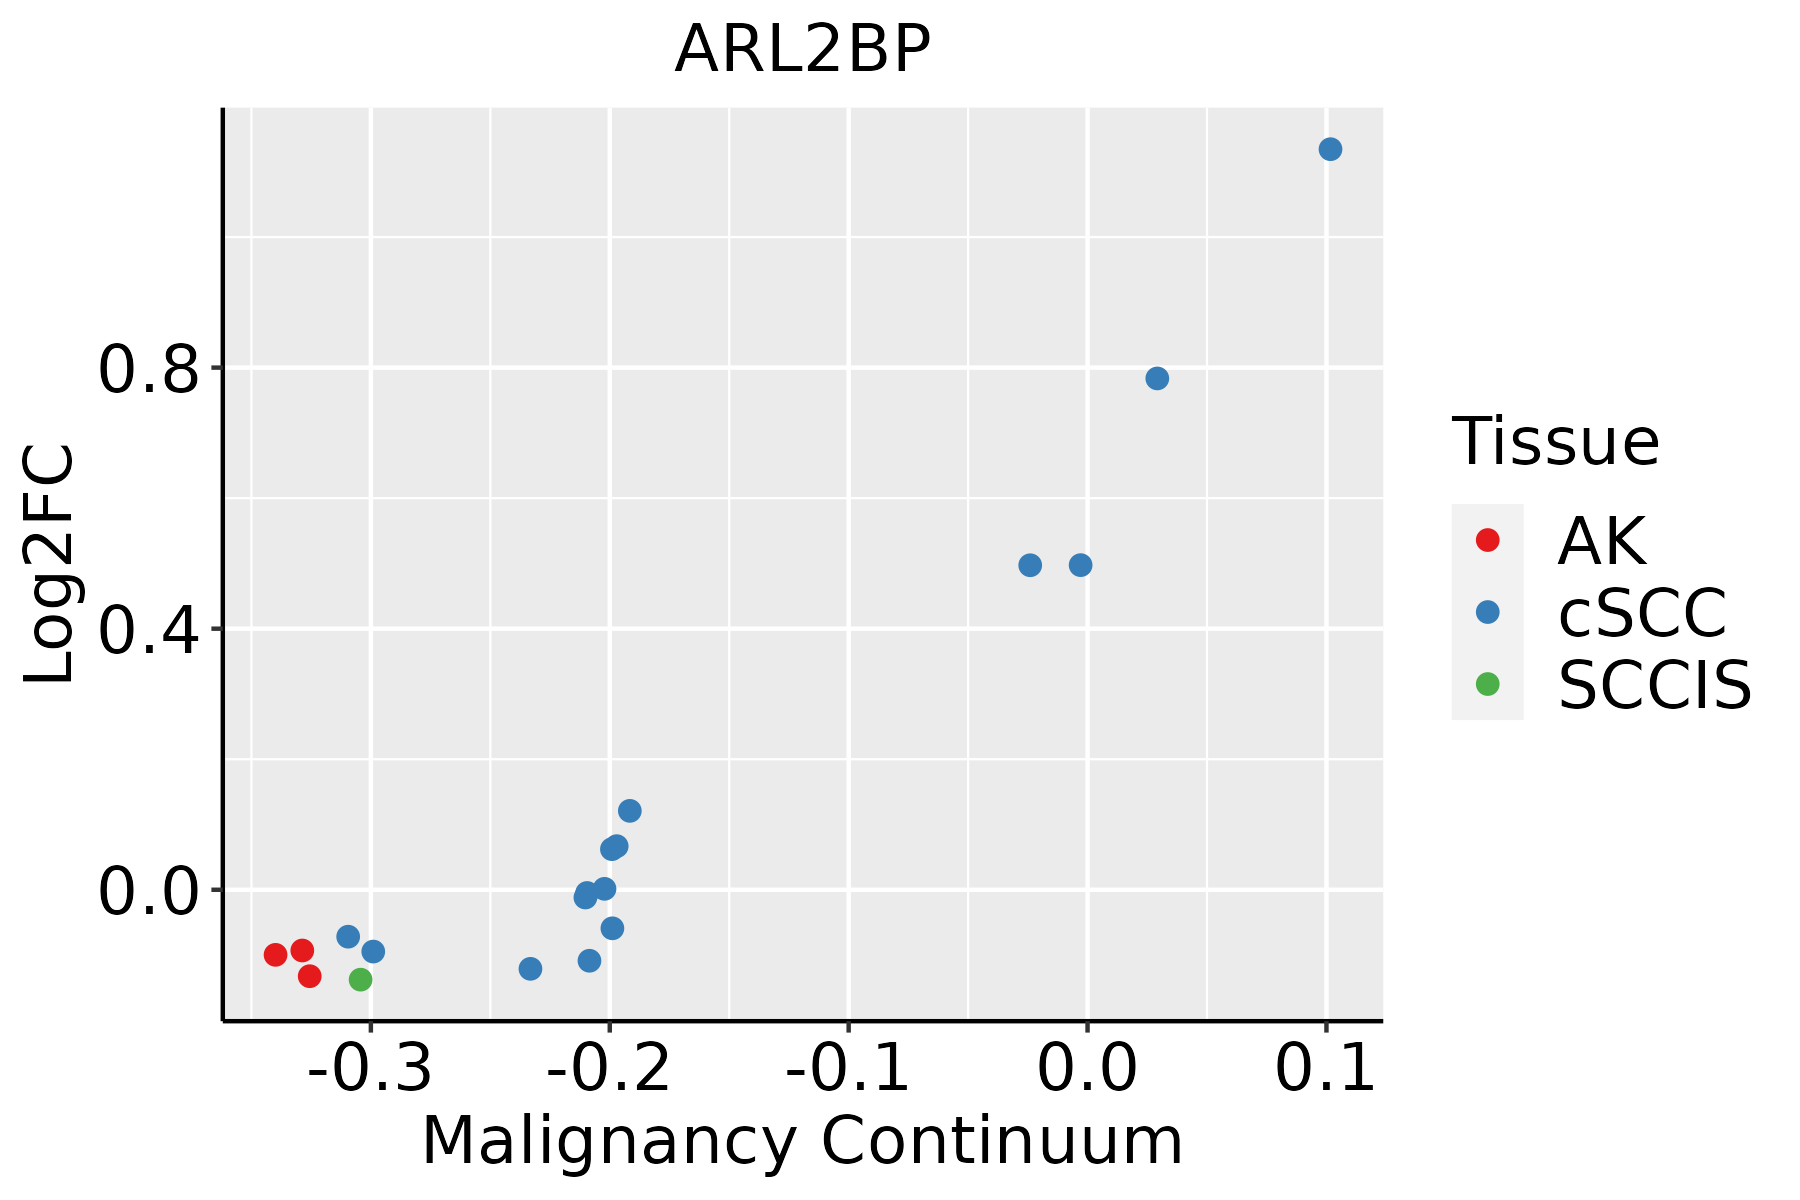 | AK: Actinic keratosis |
| cSCC: Cutaneous squamous cell carcinoma | ||
| SCCIS:squamous cell carcinoma in situ | ||
| Thyroid | 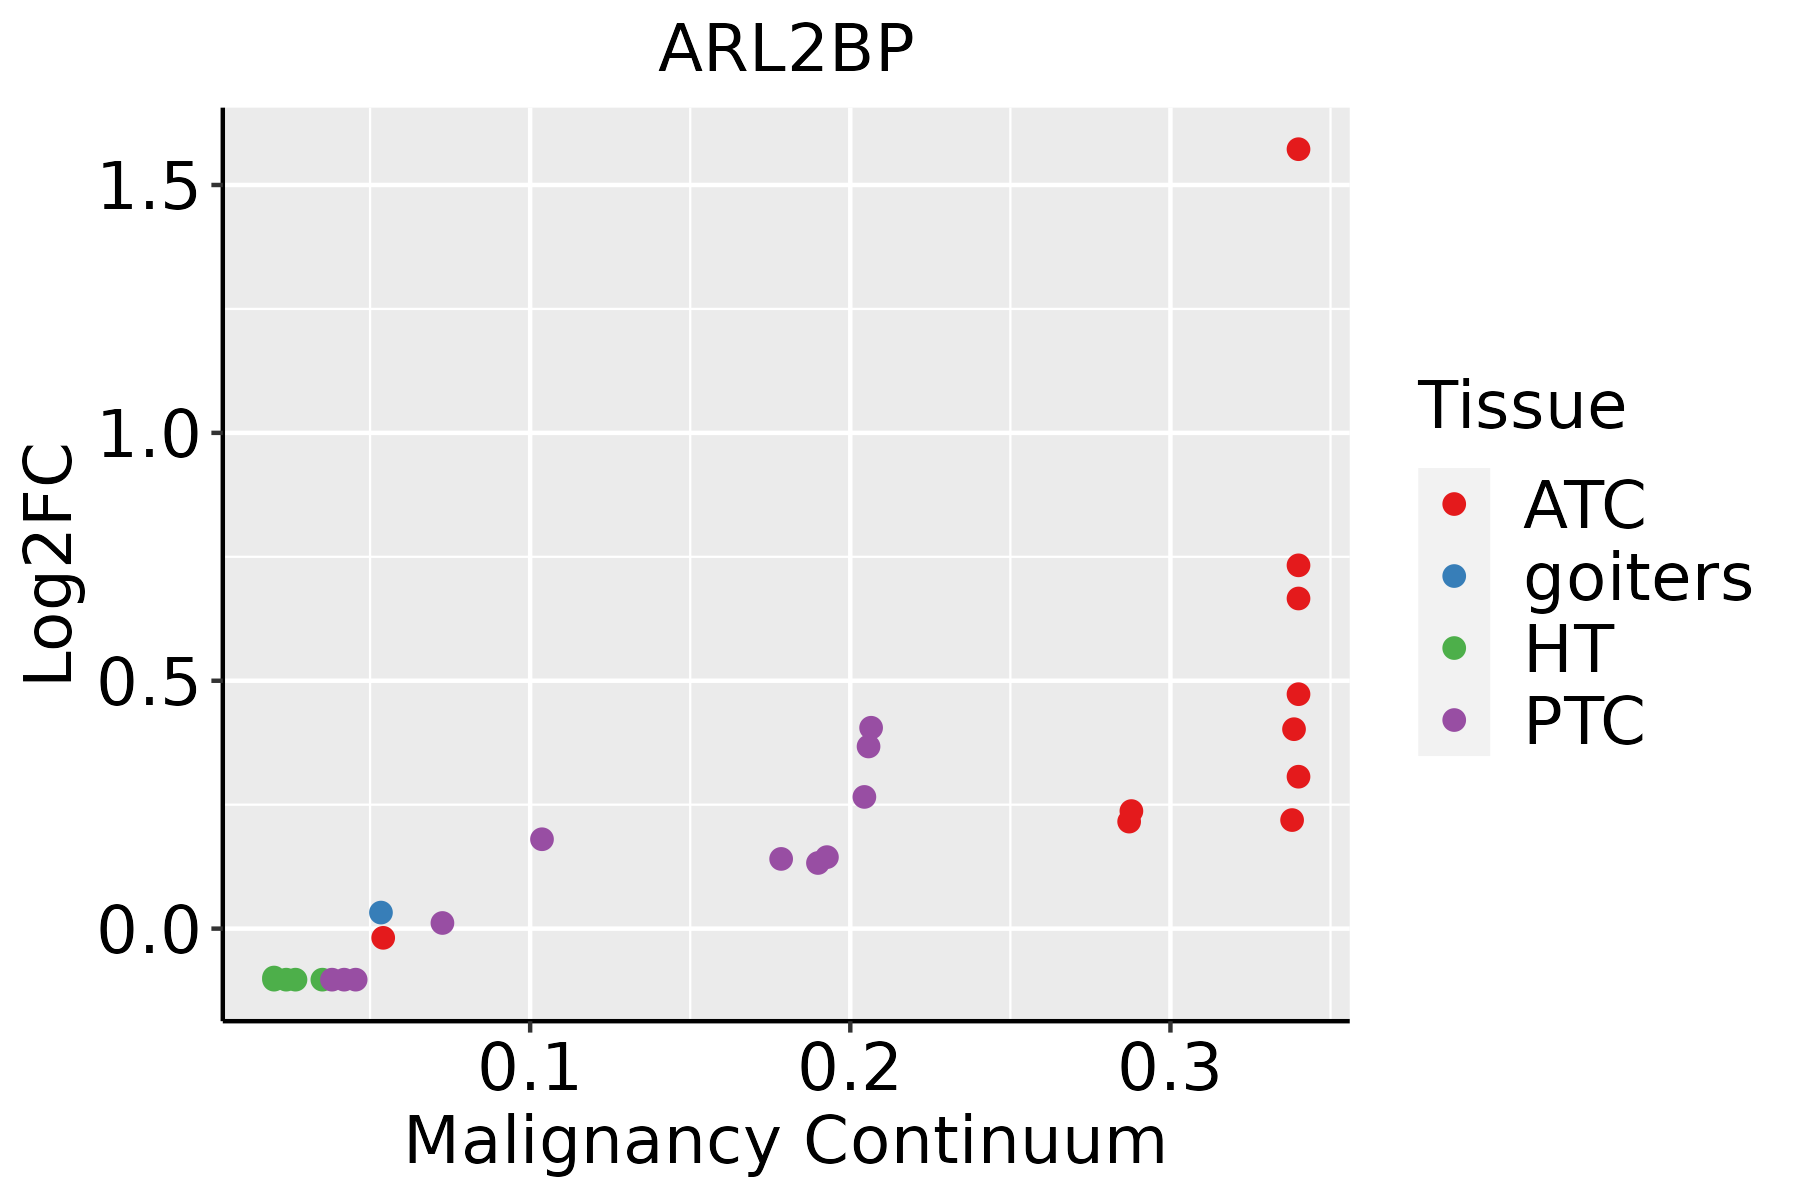 | ATC: Anaplastic thyroid cancer |
| HT: Hashimoto's thyroiditis | ||
| PTC: Papillary thyroid cancer |
| ∗log2FC in expression of this searched gene in stem-like cells from each diseased tissue sample relative to stem-like cells in normal samples in each tissue plotted against the malignancy continuum. Samples are colored based on if they are from different disease stage. |
Top |
Malignant transformation related pathway analysis |
| Find out the enriched GO biological processes and KEGG pathways involved in transition from healthy to precancer to cancer |
| Tissue | Disease Stage | Enriched GO biological Processes |
| Colorectum | AD |  |
| Colorectum | SER |  |
| Colorectum | MSS |  |
| Colorectum | MSI-H |  |
| Colorectum | FAP |  |
| ∗Top 15 enriched GO BP terms are showed in the bar plot of each disease state in each tissue. Each row represents a significant GO biological process which is colored according to the -log10(p.adjust). |
| Page: 1 2 3 4 5 6 7 8 9 |
| GO ID | Tissue | Disease Stage | Description | Gene Ratio | Bg Ratio | pvalue | p.adjust | Count |
| GO:003450418 | Esophagus | ESCC | protein localization to nucleus | 211/8552 | 290/18723 | 4.06e-21 | 6.60e-19 | 211 |
| GO:0045185111 | Esophagus | ESCC | maintenance of protein location | 71/8552 | 94/18723 | 3.41e-09 | 7.24e-08 | 71 |
| GO:0051235110 | Esophagus | ESCC | maintenance of location | 200/8552 | 327/18723 | 1.01e-08 | 2.02e-07 | 200 |
| GO:0032507110 | Esophagus | ESCC | maintenance of protein location in cell | 52/8552 | 65/18723 | 1.41e-08 | 2.77e-07 | 52 |
| GO:007259517 | Esophagus | ESCC | maintenance of protein localization in organelle | 36/8552 | 42/18723 | 8.46e-08 | 1.44e-06 | 36 |
| GO:005145712 | Esophagus | ESCC | maintenance of protein location in nucleus | 20/8552 | 23/18723 | 4.97e-05 | 3.86e-04 | 20 |
| GO:0051651111 | Esophagus | ESCC | maintenance of location in cell | 126/8552 | 214/18723 | 6.57e-05 | 5.00e-04 | 126 |
| GO:00182124 | Esophagus | ESCC | peptidyl-tyrosine modification | 202/8552 | 378/18723 | 1.34e-03 | 6.39e-03 | 202 |
| GO:00181084 | Esophagus | ESCC | peptidyl-tyrosine phosphorylation | 200/8552 | 375/18723 | 1.60e-03 | 7.45e-03 | 200 |
| GO:00507303 | Esophagus | ESCC | regulation of peptidyl-tyrosine phosphorylation | 144/8552 | 264/18723 | 2.22e-03 | 9.78e-03 | 144 |
| GO:003450411 | Liver | Cirrhotic | protein localization to nucleus | 113/4634 | 290/18723 | 5.00e-08 | 1.58e-06 | 113 |
| GO:00451857 | Liver | Cirrhotic | maintenance of protein location | 46/4634 | 94/18723 | 3.31e-07 | 7.90e-06 | 46 |
| GO:00325074 | Liver | Cirrhotic | maintenance of protein location in cell | 35/4634 | 65/18723 | 4.60e-07 | 1.05e-05 | 35 |
| GO:005123511 | Liver | Cirrhotic | maintenance of location | 117/4634 | 327/18723 | 4.78e-06 | 7.86e-05 | 117 |
| GO:00516517 | Liver | Cirrhotic | maintenance of location in cell | 76/4634 | 214/18723 | 2.66e-04 | 2.37e-03 | 76 |
| GO:00725953 | Liver | Cirrhotic | maintenance of protein localization in organelle | 21/4634 | 42/18723 | 3.57e-04 | 3.03e-03 | 21 |
| GO:003450421 | Liver | HCC | protein localization to nucleus | 194/7958 | 290/18723 | 2.84e-17 | 2.85e-15 | 194 |
| GO:005123521 | Liver | HCC | maintenance of location | 185/7958 | 327/18723 | 1.70e-07 | 3.12e-06 | 185 |
| GO:004518512 | Liver | HCC | maintenance of protein location | 61/7958 | 94/18723 | 9.61e-06 | 1.12e-04 | 61 |
| GO:005165112 | Liver | HCC | maintenance of location in cell | 119/7958 | 214/18723 | 7.11e-05 | 6.39e-04 | 119 |
| Page: 1 2 3 4 |
| Pathway ID | Tissue | Disease Stage | Description | Gene Ratio | Bg Ratio | pvalue | p.adjust | qvalue | Count |
| Page: 1 |
Top |
Cell-cell communication analysis |
| Identification of potential cell-cell interactions between two cell types and their ligand-receptor pairs for different disease states |
| Ligand | Receptor | LRpair | Pathway | Tissue | Disease Stage |
| Page: 1 |
Top |
Single-cell gene regulatory network inference analysis |
| Find out the significant the regulons (TFs) and the target genes of each regulon across cell types for different disease states |
| TF | Cell Type | Tissue | Disease Stage | Target Gene | RSS | Regulon Activity |
| ∗The dot plots of a searched regulon are shown for all cell subpopulations in each disease state of each tissue based on the regulon specific score inferred using pySCENIC and by calculating the average expression. |
| Page: 1 |
Top |
Somatic mutation of malignant transformation related genes |
| Annotation of somatic variants for genes involved in malignant transformation |
| Hugo Symbol | Variant Class | Variant Classification | dbSNP RS | HGVSc | HGVSp | HGVSp Short | SWISSPROT | BIOTYPE | SIFT | PolyPhen | Tumor Sample Barcode | Tissue | Histology | Sex | Age | Stage | Therapy Types | Drugs | Outcome |
| ARL2BP | SNV | Missense_Mutation | novel | c.328N>A | p.Asp110Asn | p.D110N | Q9Y2Y0 | protein_coding | tolerated(0.28) | benign(0.02) | TCGA-DS-A1OB-01 | Cervix | cervical & endocervical cancer | Female | <65 | I/II | Chemotherapy | carboplatin | PD |
| ARL2BP | SNV | Missense_Mutation | c.46N>A | p.Ala16Thr | p.A16T | Q9Y2Y0 | protein_coding | tolerated(0.6) | benign(0.001) | TCGA-A6-2686-01 | Colorectum | colon adenocarcinoma | Female | >=65 | I/II | Unknown | Unknown | SD | |
| ARL2BP | SNV | Missense_Mutation | c.46G>A | p.Ala16Thr | p.A16T | Q9Y2Y0 | protein_coding | tolerated(0.6) | benign(0.001) | TCGA-A6-3809-01 | Colorectum | colon adenocarcinoma | Female | >=65 | I/II | Unknown | Unknown | SD | |
| ARL2BP | SNV | Missense_Mutation | c.184T>C | p.Tyr62His | p.Y62H | Q9Y2Y0 | protein_coding | deleterious(0) | probably_damaging(0.999) | TCGA-AA-3710-01 | Colorectum | colon adenocarcinoma | Female | >=65 | I/II | Unknown | Unknown | SD | |
| ARL2BP | SNV | Missense_Mutation | c.212C>A | p.Ser71Tyr | p.S71Y | Q9Y2Y0 | protein_coding | tolerated(0.11) | benign(0.072) | TCGA-CA-6718-01 | Colorectum | colon adenocarcinoma | Male | <65 | I/II | Unknown | Unknown | PD | |
| ARL2BP | SNV | Missense_Mutation | novel | c.415N>G | p.Leu139Val | p.L139V | Q9Y2Y0 | protein_coding | deleterious(0.05) | benign(0.219) | TCGA-AG-A002-01 | Colorectum | rectum adenocarcinoma | Male | <65 | I/II | Unknown | Unknown | SD |
| ARL2BP | SNV | Missense_Mutation | c.451N>C | p.Ser151Pro | p.S151P | Q9Y2Y0 | protein_coding | tolerated(0.18) | benign(0.003) | TCGA-AP-A054-01 | Endometrium | uterine corpus endometrioid carcinoma | Female | <65 | III/IV | Chemotherapy | carboplatin | PD | |
| ARL2BP | SNV | Missense_Mutation | rs147277394 | c.132N>A | p.Phe44Leu | p.F44L | Q9Y2Y0 | protein_coding | deleterious(0) | probably_damaging(0.996) | TCGA-B5-A1MR-01 | Endometrium | uterine corpus endometrioid carcinoma | Female | >=65 | III/IV | Unknown | Unknown | SD |
| ARL2BP | SNV | Missense_Mutation | rs778187320 | c.458N>T | p.Ser153Phe | p.S153F | Q9Y2Y0 | protein_coding | deleterious(0.01) | benign(0.276) | TCGA-55-6982-01 | Lung | lung adenocarcinoma | Female | >=65 | I/II | Chemotherapy | gemzar | PD |
| ARL2BP | SNV | Missense_Mutation | c.386N>A | p.Arg129Lys | p.R129K | Q9Y2Y0 | protein_coding | tolerated(0.45) | benign(0.027) | TCGA-55-7903-01 | Lung | lung adenocarcinoma | Male | <65 | I/II | Unknown | Unknown | SD |
| Page: 1 2 |
Top |
Related drugs of malignant transformation related genes |
| Identification of chemicals and drugs interact with genes involved in malignant transfromation |
| (DGIdb 4.0) |
| Entrez ID | Symbol | Category | Interaction Types | Drug Claim Name | Drug Name | PMIDs |
| Page: 1 |

Copyright 2023-Present -The University of Texas Health Science Center at Houston |