
|
|||||
|
 | |
| |
| |
| |
| |
| |
|
Gene: ARL17B |
Gene summary for ARL17B |
| Gene information | Species | Human | Gene symbol | ARL17B | Gene ID | 100506084 |
| Gene name | ADP ribosylation factor like GTPase 17B | |
| Gene Alias | ARL17 | |
| Cytomap | 17q21.31 | |
| Gene Type | protein-coding | GO ID | GO:0006810 | UniProtAcc | A8K0M5 |
Top |
Malignant transformation analysis |
| Identification of the aberrant gene expression in precancerous and cancerous lesions by comparing the gene expression of stem-like cells in diseased tissues with normal stem cells |
| Entrez ID | Symbol | Replicates | Species | Organ | Tissue | Adj P-value | Log2FC | Malignancy |
| 100506084 | ARL17B | HTA11_78_2000001011 | Human | Colorectum | AD | 1.99e-13 | 7.47e-01 | -0.1088 |
| 100506084 | ARL17B | HTA11_347_2000001011 | Human | Colorectum | AD | 1.03e-06 | 3.92e-01 | -0.1954 |
| 100506084 | ARL17B | HTA11_411_2000001011 | Human | Colorectum | SER | 1.31e-04 | 8.84e-01 | -0.2602 |
| 100506084 | ARL17B | HTA11_2112_2000001011 | Human | Colorectum | SER | 6.05e-04 | 8.57e-01 | -0.2196 |
| 100506084 | ARL17B | HTA11_3361_2000001011 | Human | Colorectum | AD | 3.24e-24 | 1.05e+00 | -0.1207 |
| 100506084 | ARL17B | HTA11_866_2000001011 | Human | Colorectum | AD | 2.33e-43 | 9.49e-01 | -0.1001 |
| 100506084 | ARL17B | HTA11_1391_2000001011 | Human | Colorectum | AD | 3.54e-08 | 5.18e-01 | -0.059 |
| 100506084 | ARL17B | HTA11_9341_2000001011 | Human | Colorectum | SER | 2.49e-02 | 7.67e-01 | -0.00410000000000005 |
| 100506084 | ARL17B | HTA11_866_3004761011 | Human | Colorectum | AD | 1.70e-07 | 4.75e-01 | 0.096 |
| 100506084 | ARL17B | HTA11_4255_2000001011 | Human | Colorectum | SER | 8.40e-12 | 8.89e-01 | 0.0446 |
| 100506084 | ARL17B | HTA11_9408_2000001011 | Human | Colorectum | AD | 4.08e-05 | 7.95e-01 | 0.0451 |
| 100506084 | ARL17B | HTA11_8622_2000001021 | Human | Colorectum | SER | 3.56e-09 | 5.85e-01 | 0.0528 |
| 100506084 | ARL17B | HTA11_7696_3000711011 | Human | Colorectum | AD | 1.55e-30 | 8.47e-01 | 0.0674 |
| 100506084 | ARL17B | HTA11_99999974143_84620 | Human | Colorectum | MSS | 1.23e-35 | 9.41e-01 | 0.3005 |
| 100506084 | ARL17B | A002-C-201 | Human | Colorectum | FAP | 2.45e-02 | -1.23e-01 | 0.0324 |
| 100506084 | ARL17B | A002-C-205 | Human | Colorectum | FAP | 5.52e-03 | -1.34e-01 | -0.1236 |
| 100506084 | ARL17B | A014-C-108 | Human | Colorectum | FAP | 3.49e-05 | 5.19e-01 | -0.124 |
| 100506084 | ARL17B | A002-C-114 | Human | Colorectum | FAP | 1.87e-02 | -1.45e-01 | -0.1561 |
| 100506084 | ARL17B | A015-C-202 | Human | Colorectum | FAP | 4.04e-31 | 8.14e-01 | -0.0849 |
| 100506084 | ARL17B | CRC-3-11773 | Human | Colorectum | CRC | 4.18e-09 | 4.78e-01 | 0.2564 |
| Page: 1 |
| Tissue | Expression Dynamics | Abbreviation |
| Colorectum (GSE201348) |  | FAP: Familial adenomatous polyposis |
| CRC: Colorectal cancer | ||
| Colorectum (HTA11) | 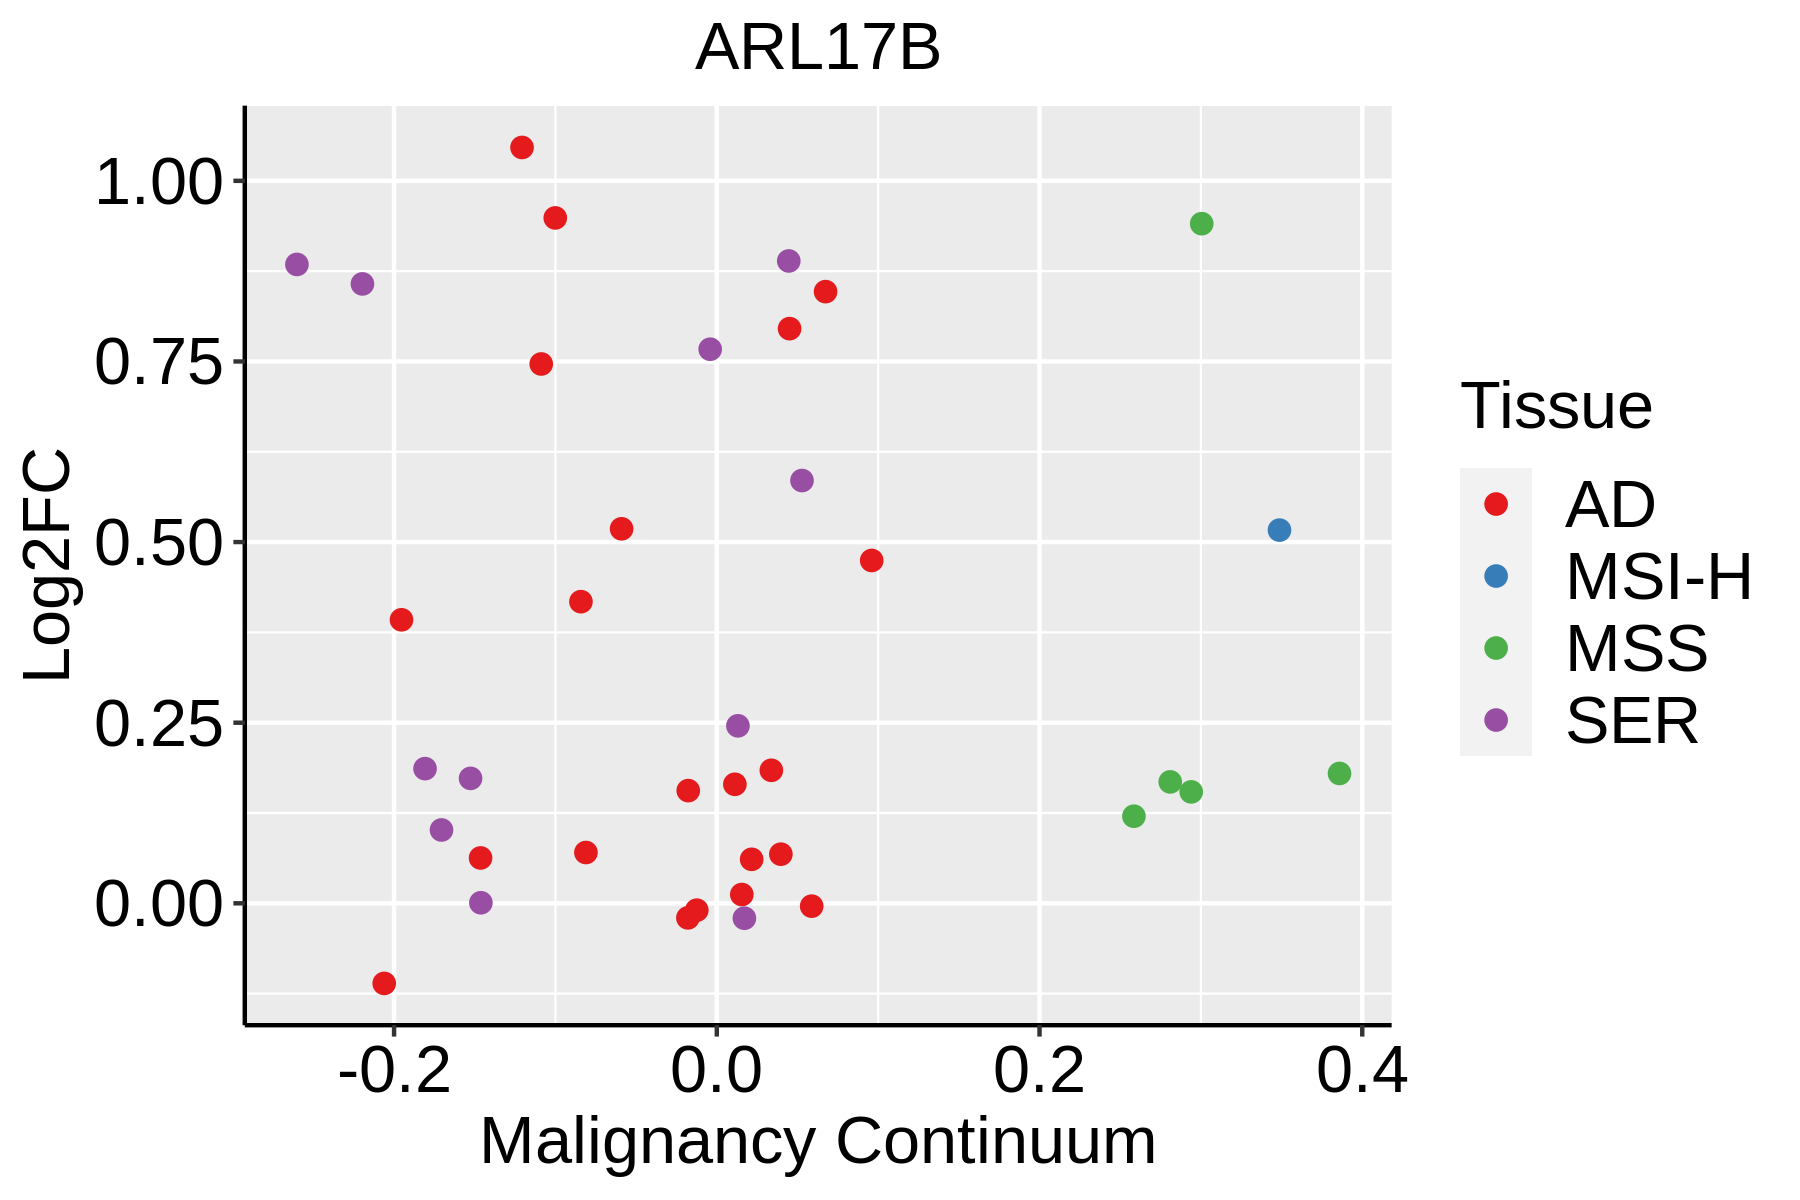 | AD: Adenomas |
| SER: Sessile serrated lesions | ||
| MSI-H: Microsatellite-high colorectal cancer | ||
| MSS: Microsatellite stable colorectal cancer |
| ∗log2FC in expression of this searched gene in stem-like cells from each diseased tissue sample relative to stem-like cells in normal samples in each tissue plotted against the malignancy continuum. Samples are colored based on if they are from different disease stage. |
Top |
Malignant transformation related pathway analysis |
| Find out the enriched GO biological processes and KEGG pathways involved in transition from healthy to precancer to cancer |
| Tissue | Disease Stage | Enriched GO biological Processes |
| Colorectum | AD |  |
| Colorectum | SER |  |
| Colorectum | MSS |  |
| Colorectum | MSI-H |  |
| Colorectum | FAP |  |
| ∗Top 15 enriched GO BP terms are showed in the bar plot of each disease state in each tissue. Each row represents a significant GO biological process which is colored according to the -log10(p.adjust). |
| Page: 1 2 3 4 5 6 7 8 9 |
| GO ID | Tissue | Disease Stage | Description | Gene Ratio | Bg Ratio | pvalue | p.adjust | Count |
| Page: 1 |
| Pathway ID | Tissue | Disease Stage | Description | Gene Ratio | Bg Ratio | pvalue | p.adjust | qvalue | Count |
| Page: 1 |
Top |
Cell-cell communication analysis |
| Identification of potential cell-cell interactions between two cell types and their ligand-receptor pairs for different disease states |
| Ligand | Receptor | LRpair | Pathway | Tissue | Disease Stage |
| Page: 1 |
Top |
Single-cell gene regulatory network inference analysis |
| Find out the significant the regulons (TFs) and the target genes of each regulon across cell types for different disease states |
| TF | Cell Type | Tissue | Disease Stage | Target Gene | RSS | Regulon Activity |
| ∗The dot plots of a searched regulon are shown for all cell subpopulations in each disease state of each tissue based on the regulon specific score inferred using pySCENIC and by calculating the average expression. |
| Page: 1 |
Top |
Somatic mutation of malignant transformation related genes |
| Annotation of somatic variants for genes involved in malignant transformation |
| Hugo Symbol | Variant Class | Variant Classification | dbSNP RS | HGVSc | HGVSp | HGVSp Short | SWISSPROT | BIOTYPE | SIFT | PolyPhen | Tumor Sample Barcode | Tissue | Histology | Sex | Age | Stage | Therapy Types | Drugs | Outcome |
| ARL17B | insertion | Frame_Shift_Ins | novel | c.245_246insT | p.Gln83ProfsTer27 | p.Q83Pfs*27 | Q8IVW1 | protein_coding | TCGA-DF-A2KY-01 | Endometrium | uterine corpus endometrioid carcinoma | Female | <65 | III/IV | Chemotherapy | carboplatin | SD |
| Page: 1 |
Top |
Related drugs of malignant transformation related genes |
| Identification of chemicals and drugs interact with genes involved in malignant transfromation |
| (DGIdb 4.0) |
| Entrez ID | Symbol | Category | Interaction Types | Drug Claim Name | Drug Name | PMIDs |
| Page: 1 |

Copyright 2023-Present -The University of Texas Health Science Center at Houston |