
|
|||||
|
 | |
| |
| |
| |
| |
| |
|
Gene: ARL15 |
Gene summary for ARL15 |
| Gene information | Species | Human | Gene symbol | ARL15 | Gene ID | 54622 |
| Gene name | ADP ribosylation factor like GTPase 15 | |
| Gene Alias | ARFRP2 | |
| Cytomap | 5q11.2 | |
| Gene Type | protein-coding | GO ID | GO:0008150 | UniProtAcc | Q9NXU5 |
Top |
Malignant transformation analysis |
| Identification of the aberrant gene expression in precancerous and cancerous lesions by comparing the gene expression of stem-like cells in diseased tissues with normal stem cells |
| Entrez ID | Symbol | Replicates | Species | Organ | Tissue | Adj P-value | Log2FC | Malignancy |
| 54622 | ARL15 | CCI_1 | Human | Cervix | CC | 2.86e-15 | 8.28e-01 | 0.528 |
| 54622 | ARL15 | CCI_2 | Human | Cervix | CC | 9.72e-15 | 1.57e+00 | 0.5249 |
| 54622 | ARL15 | CCI_3 | Human | Cervix | CC | 4.60e-28 | 1.32e+00 | 0.516 |
| 54622 | ARL15 | HTA11_3410_2000001011 | Human | Colorectum | AD | 7.22e-05 | -2.98e-01 | 0.0155 |
| 54622 | ARL15 | HTA11_347_2000001011 | Human | Colorectum | AD | 6.99e-19 | 8.23e-01 | -0.1954 |
| 54622 | ARL15 | HTA11_9341_2000001011 | Human | Colorectum | SER | 5.63e-08 | -5.98e-01 | -0.00410000000000005 |
| 54622 | ARL15 | HTA11_8622_2000001021 | Human | Colorectum | SER | 4.45e-03 | -5.52e-01 | 0.0528 |
| 54622 | ARL15 | HTA11_11156_2000001011 | Human | Colorectum | AD | 3.93e-05 | -8.11e-01 | 0.0397 |
| 54622 | ARL15 | HTA11_99999970781_79442 | Human | Colorectum | MSS | 5.72e-10 | -4.46e-01 | 0.294 |
| 54622 | ARL15 | HTA11_99999965062_69753 | Human | Colorectum | MSI-H | 2.18e-09 | 7.56e-01 | 0.3487 |
| 54622 | ARL15 | HTA11_99999971662_82457 | Human | Colorectum | MSS | 8.40e-05 | -3.00e-01 | 0.3859 |
| 54622 | ARL15 | HTA11_99999974143_84620 | Human | Colorectum | MSS | 1.39e-28 | -7.73e-01 | 0.3005 |
| 54622 | ARL15 | A002-C-010 | Human | Colorectum | FAP | 2.17e-07 | 1.06e-01 | 0.242 |
| 54622 | ARL15 | A015-C-203 | Human | Colorectum | FAP | 3.38e-33 | -6.95e-01 | -0.1294 |
| 54622 | ARL15 | A015-C-204 | Human | Colorectum | FAP | 7.31e-10 | -5.76e-01 | -0.0228 |
| 54622 | ARL15 | A014-C-040 | Human | Colorectum | FAP | 3.78e-02 | -2.35e-01 | -0.1184 |
| 54622 | ARL15 | A002-C-201 | Human | Colorectum | FAP | 8.35e-11 | -4.50e-01 | 0.0324 |
| 54622 | ARL15 | A001-C-119 | Human | Colorectum | FAP | 8.42e-16 | -7.67e-01 | -0.1557 |
| 54622 | ARL15 | A001-C-108 | Human | Colorectum | FAP | 2.44e-22 | -5.99e-01 | -0.0272 |
| 54622 | ARL15 | A002-C-205 | Human | Colorectum | FAP | 9.13e-32 | -7.40e-01 | -0.1236 |
| Page: 1 2 3 4 5 6 7 8 9 10 |
| Tissue | Expression Dynamics | Abbreviation |
| Cervix |  | CC: Cervix cancer |
| HSIL_HPV: HPV-infected high-grade squamous intraepithelial lesions | ||
| N_HPV: HPV-infected normal cervix | ||
| Colorectum (GSE201348) |  | FAP: Familial adenomatous polyposis |
| CRC: Colorectal cancer | ||
| Colorectum (HTA11) |  | AD: Adenomas |
| SER: Sessile serrated lesions | ||
| MSI-H: Microsatellite-high colorectal cancer | ||
| MSS: Microsatellite stable colorectal cancer | ||
| Endometrium | 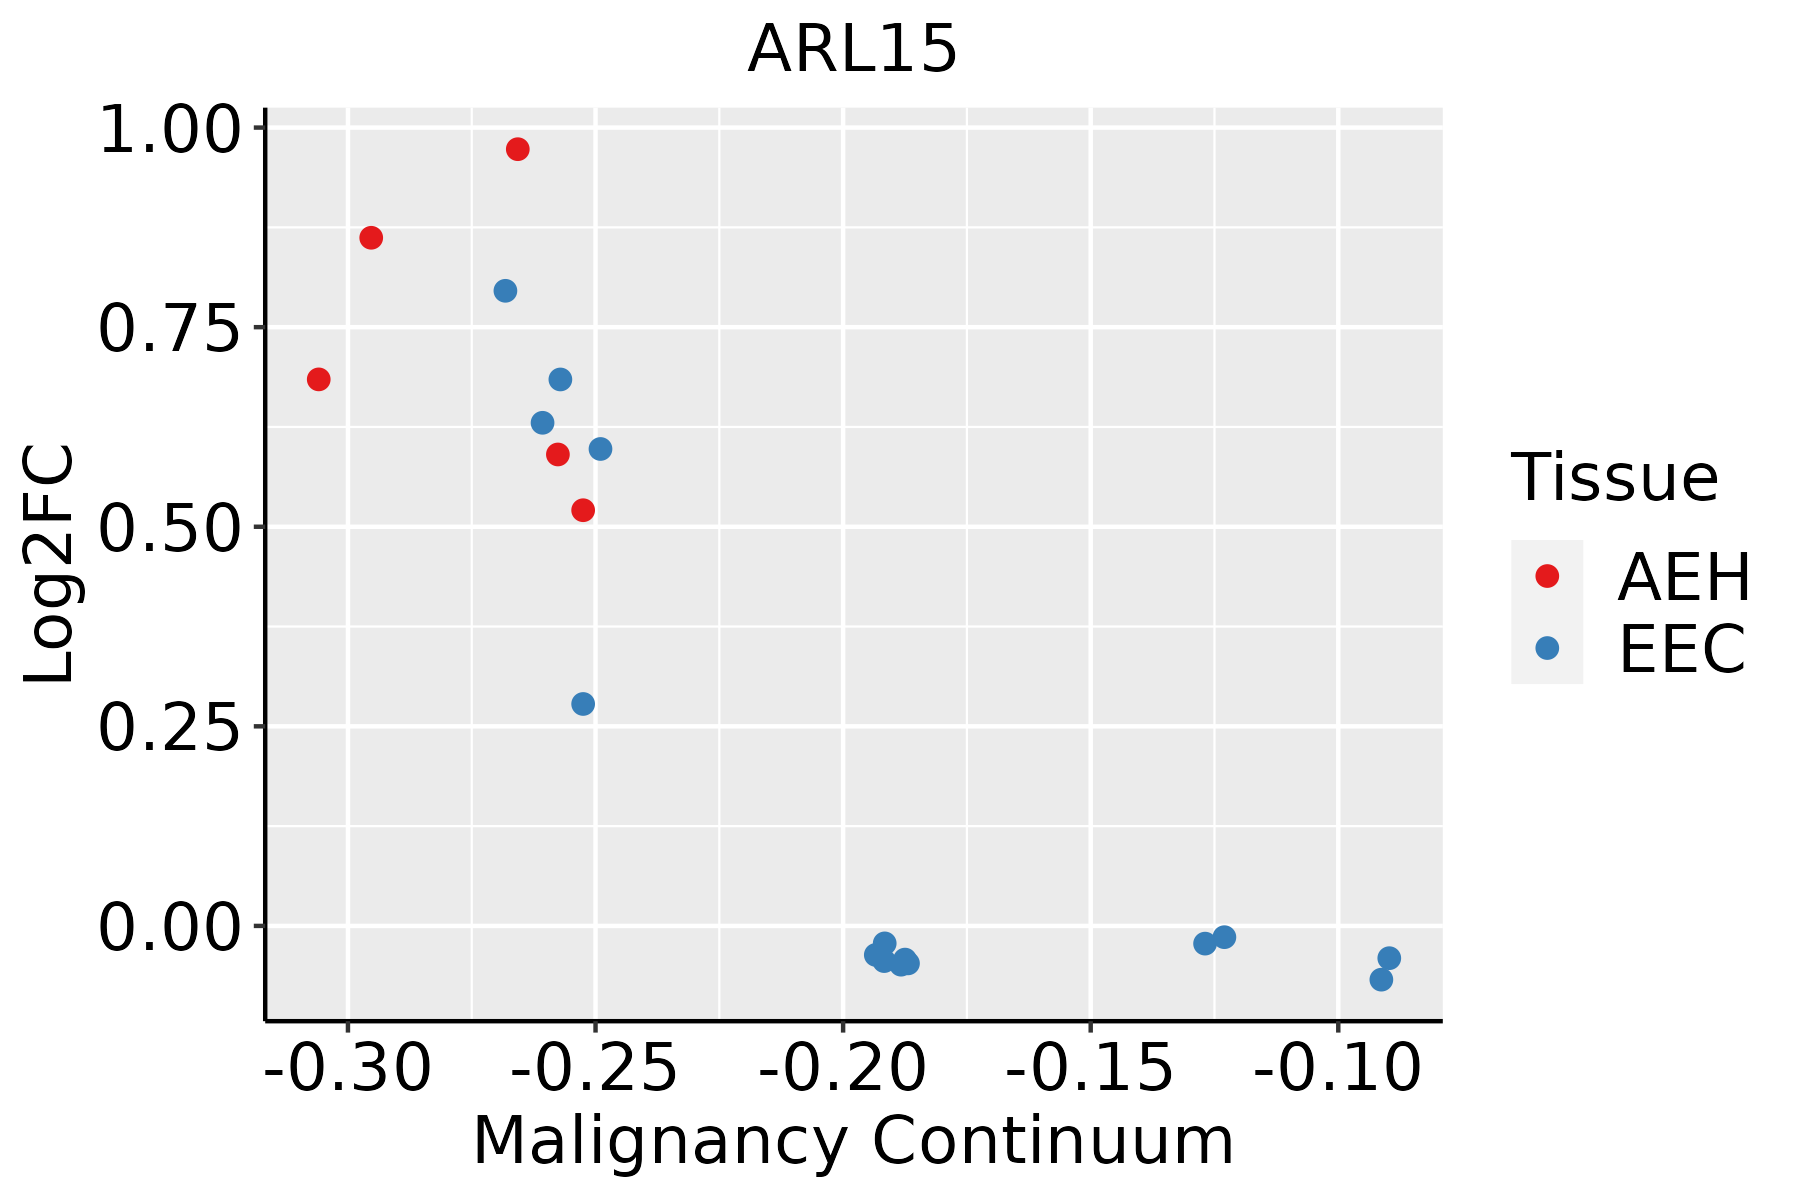 | AEH: Atypical endometrial hyperplasia |
| EEC: Endometrioid Cancer | ||
| Esophagus | 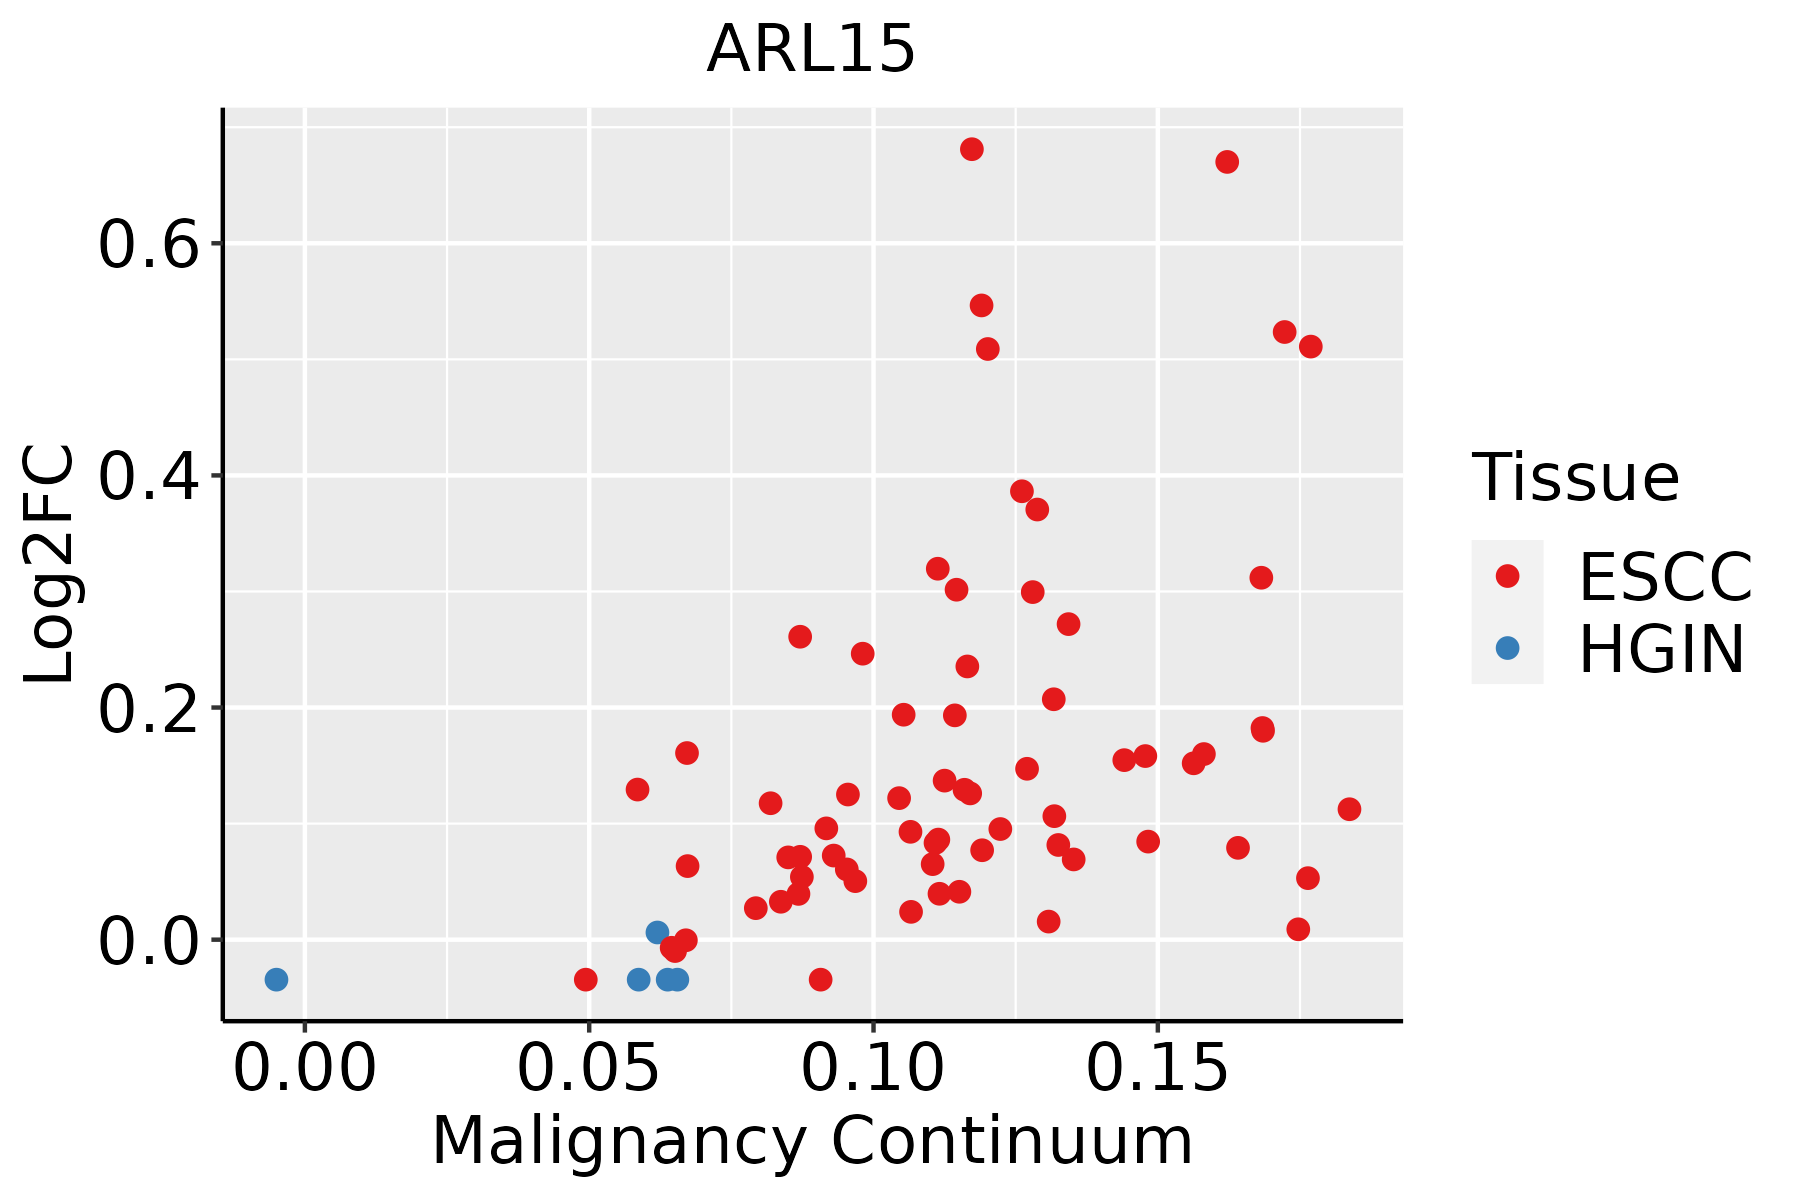 | ESCC: Esophageal squamous cell carcinoma |
| HGIN: High-grade intraepithelial neoplasias | ||
| LGIN: Low-grade intraepithelial neoplasias | ||
| GC | 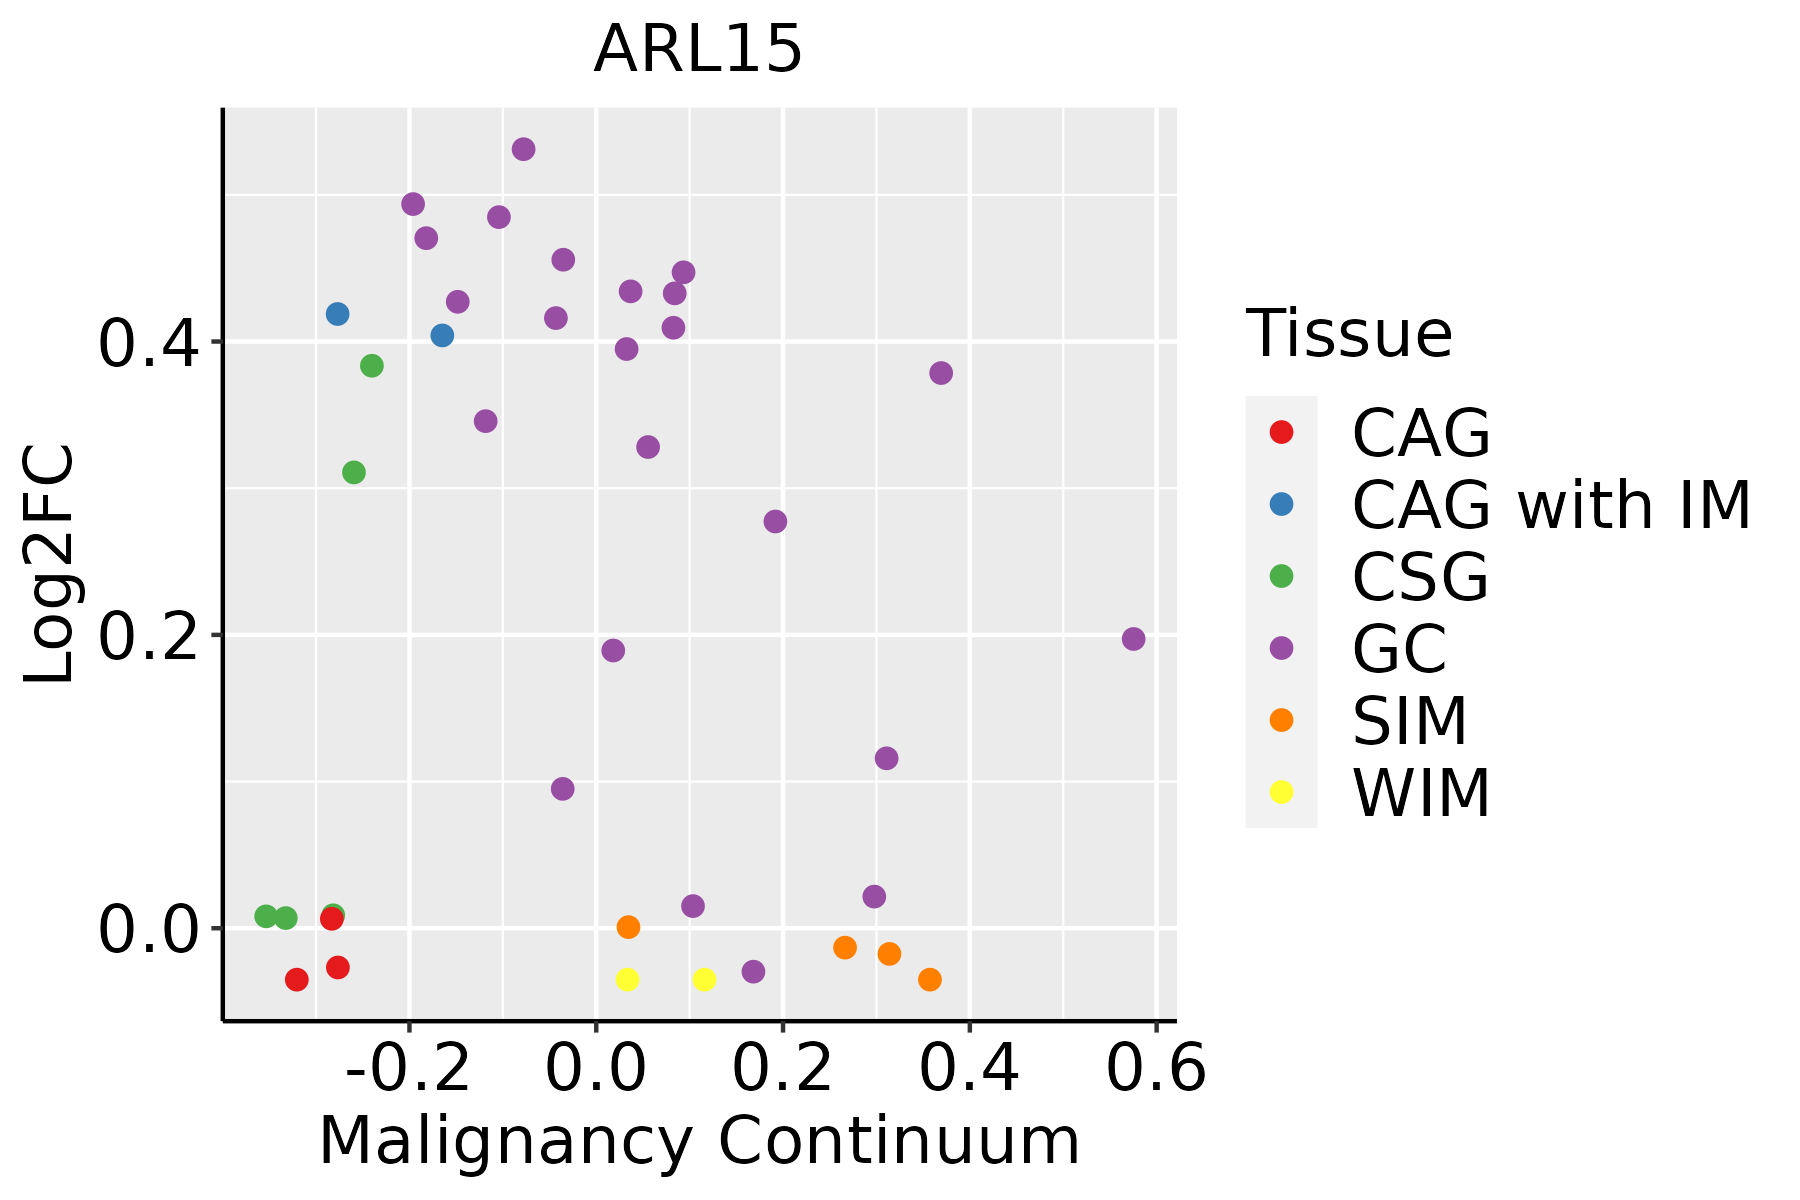 | CAG: Chronic atrophic gastritis |
| CAG with IM: Chronic atrophic gastritis with intestinal metaplasia | ||
| CSG: Chronic superficial gastritis | ||
| GC: Gastric cancer | ||
| SIM: Severe intestinal metaplasia | ||
| WIM: Wild intestinal metaplasia | ||
| Liver |  | HCC: Hepatocellular carcinoma |
| NAFLD: Non-alcoholic fatty liver disease | ||
| Lung | 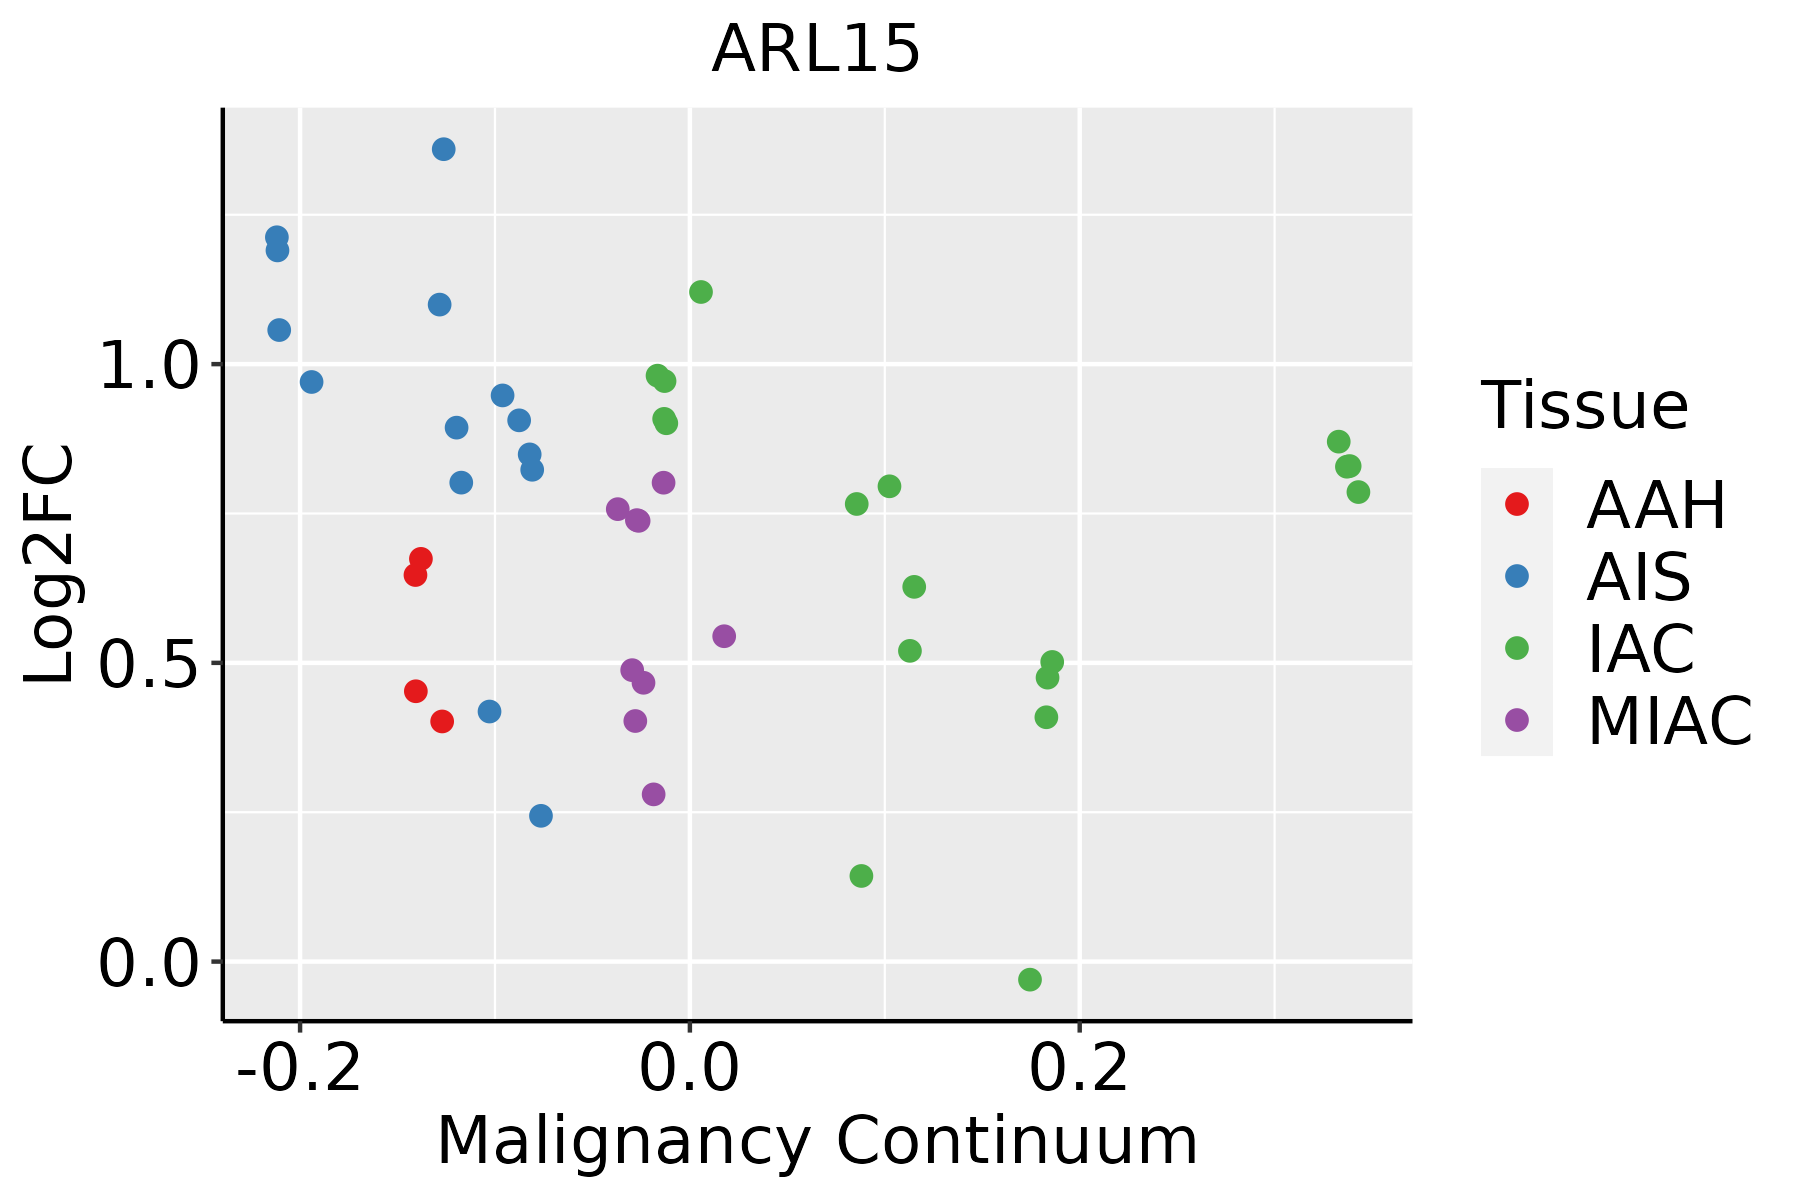 | AAH: Atypical adenomatous hyperplasia |
| AIS: Adenocarcinoma in situ | ||
| IAC: Invasive lung adenocarcinoma | ||
| MIA: Minimally invasive adenocarcinoma | ||
| Oral Cavity |  | EOLP: Erosive Oral lichen planus |
| LP: leukoplakia | ||
| NEOLP: Non-erosive oral lichen planus | ||
| OSCC: Oral squamous cell carcinoma | ||
| Prostate | 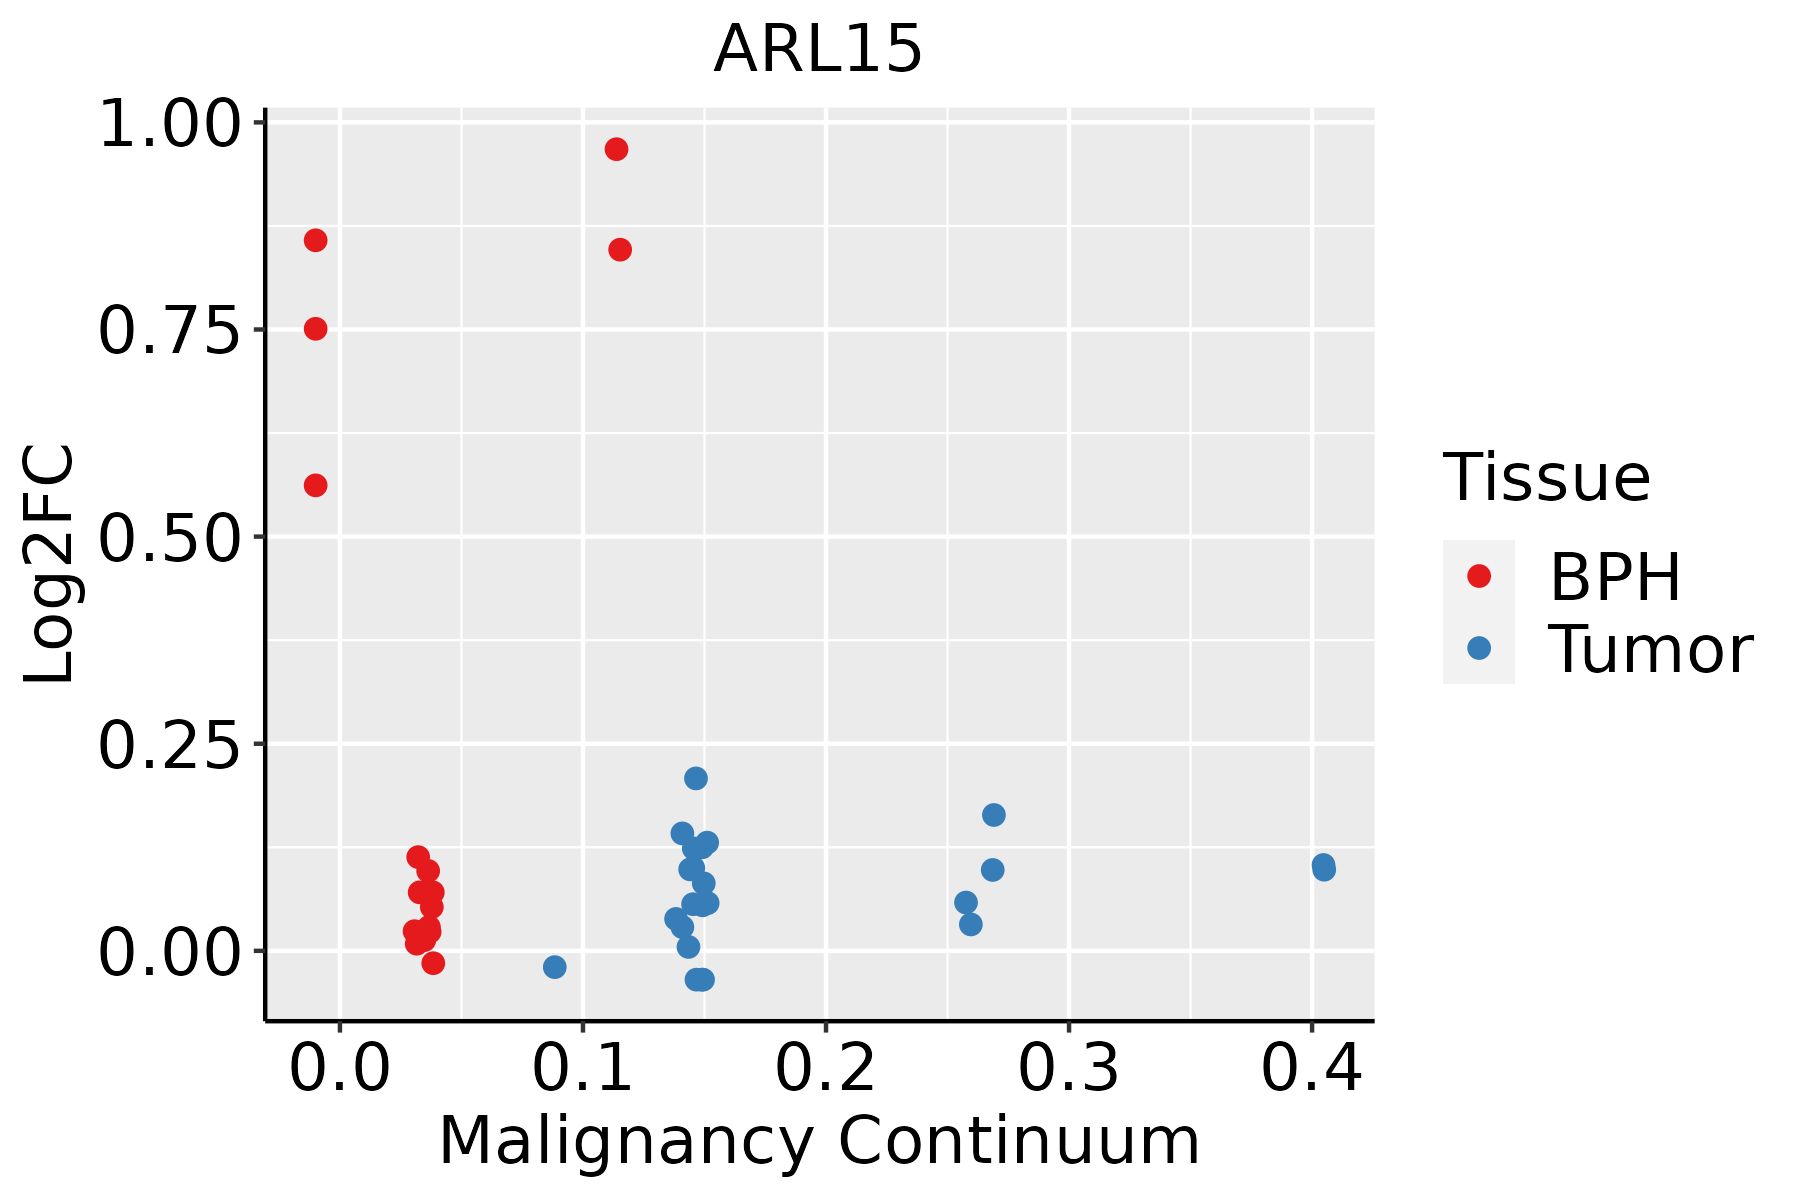 | BPH: Benign Prostatic Hyperplasia |
| Skin | 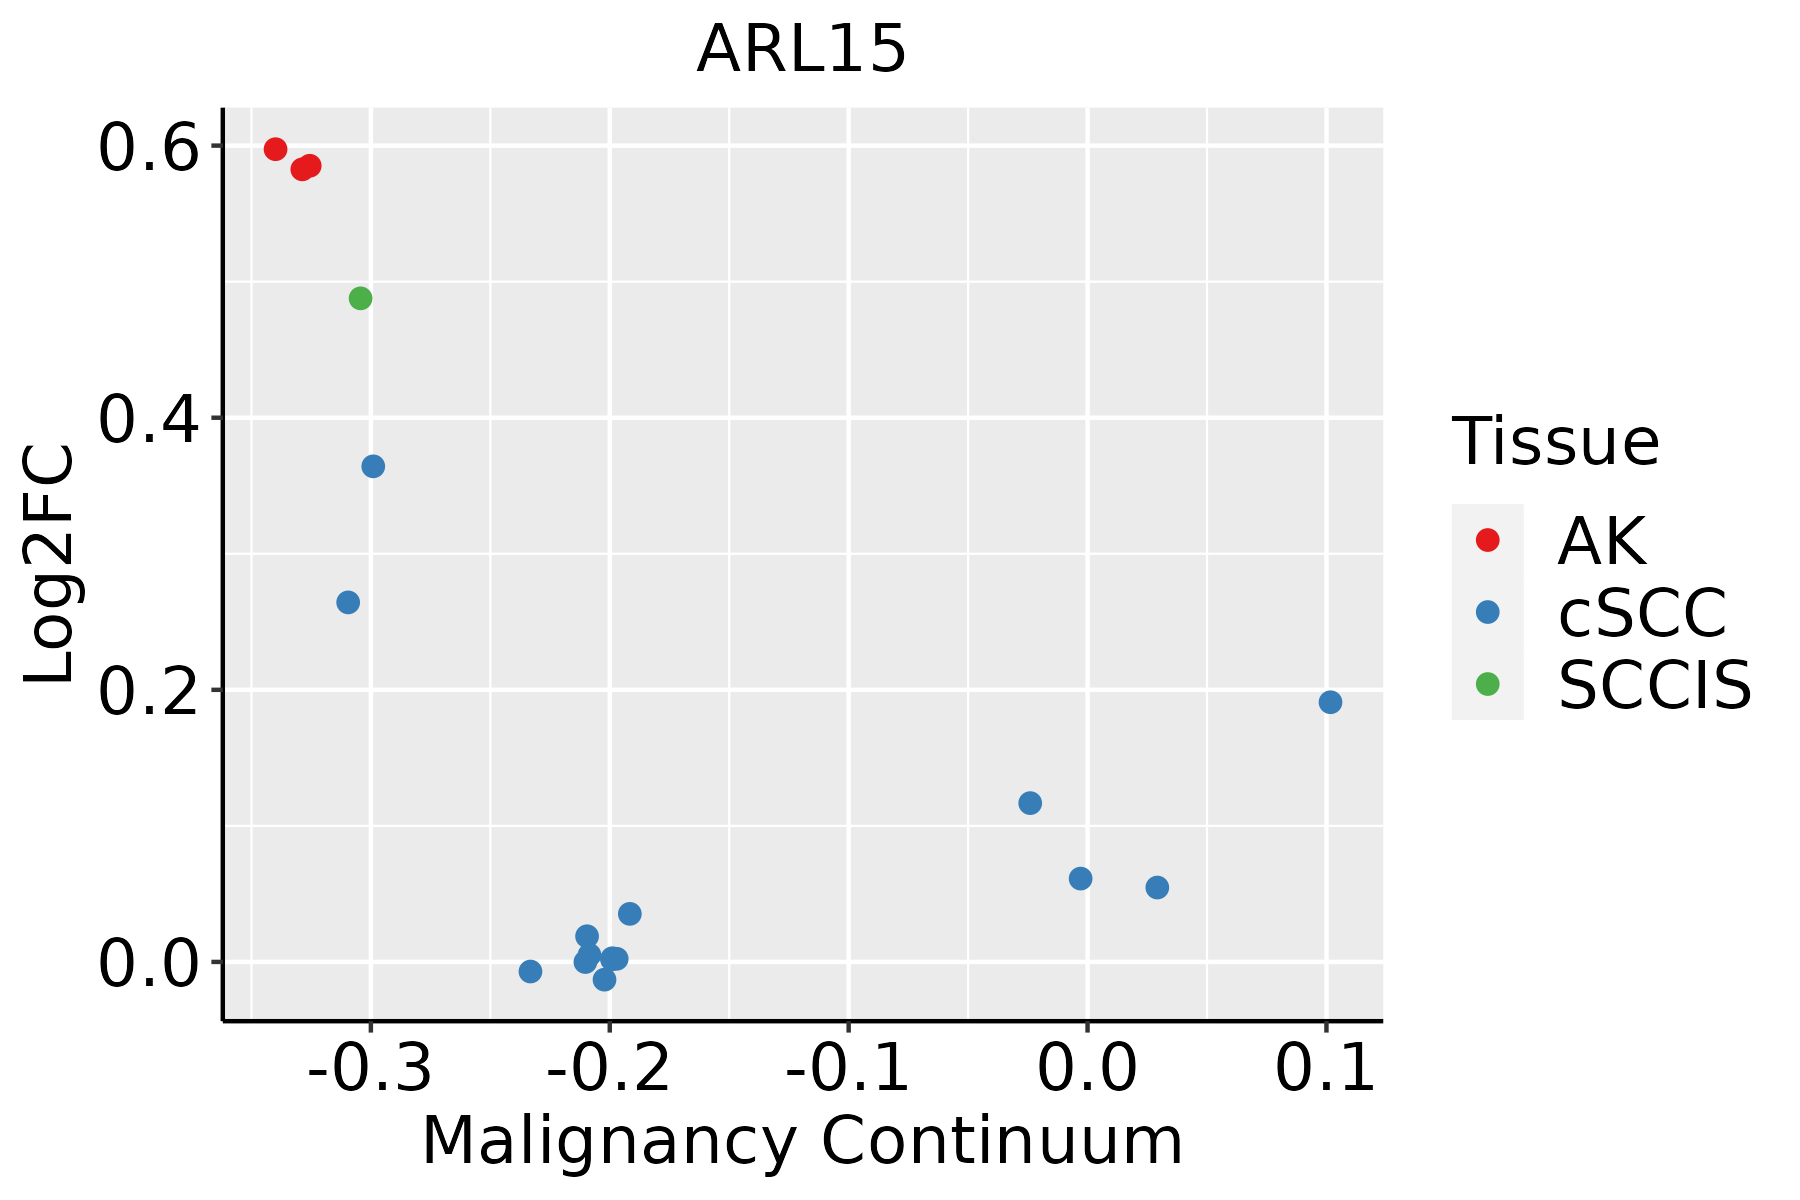 | AK: Actinic keratosis |
| cSCC: Cutaneous squamous cell carcinoma | ||
| SCCIS:squamous cell carcinoma in situ | ||
| Thyroid |  | ATC: Anaplastic thyroid cancer |
| HT: Hashimoto's thyroiditis | ||
| PTC: Papillary thyroid cancer |
| ∗log2FC in expression of this searched gene in stem-like cells from each diseased tissue sample relative to stem-like cells in normal samples in each tissue plotted against the malignancy continuum. Samples are colored based on if they are from different disease stage. |
Top |
Malignant transformation related pathway analysis |
| Find out the enriched GO biological processes and KEGG pathways involved in transition from healthy to precancer to cancer |
| Tissue | Disease Stage | Enriched GO biological Processes |
| Colorectum | AD |  |
| Colorectum | SER |  |
| Colorectum | MSS |  |
| Colorectum | MSI-H |  |
| Colorectum | FAP |  |
| ∗Top 15 enriched GO BP terms are showed in the bar plot of each disease state in each tissue. Each row represents a significant GO biological process which is colored according to the -log10(p.adjust). |
| Page: 1 2 3 4 5 6 7 8 9 |
| GO ID | Tissue | Disease Stage | Description | Gene Ratio | Bg Ratio | pvalue | p.adjust | Count |
| Page: 1 |
| Pathway ID | Tissue | Disease Stage | Description | Gene Ratio | Bg Ratio | pvalue | p.adjust | qvalue | Count |
| Page: 1 |
Top |
Cell-cell communication analysis |
| Identification of potential cell-cell interactions between two cell types and their ligand-receptor pairs for different disease states |
| Ligand | Receptor | LRpair | Pathway | Tissue | Disease Stage |
| Page: 1 |
Top |
Single-cell gene regulatory network inference analysis |
| Find out the significant the regulons (TFs) and the target genes of each regulon across cell types for different disease states |
| TF | Cell Type | Tissue | Disease Stage | Target Gene | RSS | Regulon Activity |
| ∗The dot plots of a searched regulon are shown for all cell subpopulations in each disease state of each tissue based on the regulon specific score inferred using pySCENIC and by calculating the average expression. |
| Page: 1 |
Top |
Somatic mutation of malignant transformation related genes |
| Annotation of somatic variants for genes involved in malignant transformation |
| Hugo Symbol | Variant Class | Variant Classification | dbSNP RS | HGVSc | HGVSp | HGVSp Short | SWISSPROT | BIOTYPE | SIFT | PolyPhen | Tumor Sample Barcode | Tissue | Histology | Sex | Age | Stage | Therapy Types | Drugs | Outcome |
| ARL15 | SNV | Missense_Mutation | c.113N>C | p.Ile38Thr | p.I38T | Q9NXU5 | protein_coding | deleterious(0) | probably_damaging(0.986) | TCGA-AO-A128-01 | Breast | breast invasive carcinoma | Female | <65 | I/II | Chemotherapy | doxorubicin | SD | |
| ARL15 | SNV | Missense_Mutation | c.417N>G | p.Ile139Met | p.I139M | Q9NXU5 | protein_coding | deleterious(0.02) | probably_damaging(0.93) | TCGA-AA-3672-01 | Colorectum | colon adenocarcinoma | Female | >=65 | III/IV | Unknown | Unknown | SD | |
| ARL15 | deletion | Frame_Shift_Del | c.591delA | p.Asp198ThrfsTer5 | p.D198Tfs*5 | Q9NXU5 | protein_coding | TCGA-CK-4951-01 | Colorectum | colon adenocarcinoma | Female | >=65 | I/II | Unknown | Unknown | PD | |||
| ARL15 | SNV | Missense_Mutation | novel | c.40G>T | p.Asp14Tyr | p.D14Y | Q9NXU5 | protein_coding | tolerated_low_confidence(0.08) | benign(0.135) | TCGA-A5-A1OF-01 | Endometrium | uterine corpus endometrioid carcinoma | Female | <65 | I/II | Unknown | Unknown | SD |
| ARL15 | SNV | Missense_Mutation | c.244N>A | p.Glu82Lys | p.E82K | Q9NXU5 | protein_coding | deleterious(0) | probably_damaging(0.999) | TCGA-AP-A059-01 | Endometrium | uterine corpus endometrioid carcinoma | Female | >=65 | I/II | Unknown | Unknown | SD | |
| ARL15 | SNV | Missense_Mutation | c.272N>G | p.Lys91Arg | p.K91R | Q9NXU5 | protein_coding | tolerated(0.22) | possibly_damaging(0.526) | TCGA-AX-A05Z-01 | Endometrium | uterine corpus endometrioid carcinoma | Female | <65 | III/IV | Chemotherapy | adriamycin | SD | |
| ARL15 | SNV | Missense_Mutation | rs370435144 | c.284N>A | p.Arg95His | p.R95H | Q9NXU5 | protein_coding | tolerated(0.17) | benign(0.359) | TCGA-AX-A0J1-01 | Endometrium | uterine corpus endometrioid carcinoma | Female | >=65 | I/II | Unknown | Unknown | SD |
| ARL15 | SNV | Missense_Mutation | novel | c.40G>A | p.Asp14Asn | p.D14N | Q9NXU5 | protein_coding | tolerated_low_confidence(0.09) | benign(0) | TCGA-B5-A3FA-01 | Endometrium | uterine corpus endometrioid carcinoma | Female | >=65 | I/II | Unknown | Unknown | SD |
| ARL15 | SNV | Missense_Mutation | rs200968142 | c.172G>A | p.Asp58Asn | p.D58N | Q9NXU5 | protein_coding | deleterious(0.02) | possibly_damaging(0.819) | TCGA-D1-A103-01 | Endometrium | uterine corpus endometrioid carcinoma | Female | >=65 | I/II | Unknown | Unknown | SD |
| ARL15 | SNV | Missense_Mutation | novel | c.455T>C | p.Val152Ala | p.V152A | Q9NXU5 | protein_coding | tolerated(0.53) | benign(0.007) | TCGA-D1-A175-01 | Endometrium | uterine corpus endometrioid carcinoma | Female | <65 | I/II | Chemotherapy | paclitaxel | SD |
| Page: 1 2 |
Top |
Related drugs of malignant transformation related genes |
| Identification of chemicals and drugs interact with genes involved in malignant transfromation |
| (DGIdb 4.0) |
| Entrez ID | Symbol | Category | Interaction Types | Drug Claim Name | Drug Name | PMIDs |
| Page: 1 |

Copyright 2023-Present -The University of Texas Health Science Center at Houston |