
|
|||||
|
 | |
| |
| |
| |
| |
| |
|
Gene: ARL13B |
Gene summary for ARL13B |
| Gene information | Species | Human | Gene symbol | ARL13B | Gene ID | 200894 |
| Gene name | ADP ribosylation factor like GTPase 13B | |
| Gene Alias | ARL2L1 | |
| Cytomap | 3q11.1-q11.2 | |
| Gene Type | protein-coding | GO ID | GO:0000902 | UniProtAcc | Q3SXY8 |
Top |
Malignant transformation analysis |
| Identification of the aberrant gene expression in precancerous and cancerous lesions by comparing the gene expression of stem-like cells in diseased tissues with normal stem cells |
| Entrez ID | Symbol | Replicates | Species | Organ | Tissue | Adj P-value | Log2FC | Malignancy |
| 200894 | ARL13B | LZE2T | Human | Esophagus | ESCC | 1.73e-04 | 4.33e-01 | 0.082 |
| 200894 | ARL13B | LZE4T | Human | Esophagus | ESCC | 1.84e-08 | 2.99e-01 | 0.0811 |
| 200894 | ARL13B | LZE7T | Human | Esophagus | ESCC | 2.83e-05 | 1.85e-01 | 0.0667 |
| 200894 | ARL13B | LZE22D1 | Human | Esophagus | HGIN | 2.36e-02 | 1.38e-01 | 0.0595 |
| 200894 | ARL13B | LZE24T | Human | Esophagus | ESCC | 3.31e-13 | 4.75e-01 | 0.0596 |
| 200894 | ARL13B | P1T-E | Human | Esophagus | ESCC | 9.24e-05 | 4.44e-01 | 0.0875 |
| 200894 | ARL13B | P2T-E | Human | Esophagus | ESCC | 8.41e-24 | 3.47e-01 | 0.1177 |
| 200894 | ARL13B | P4T-E | Human | Esophagus | ESCC | 2.71e-46 | 1.01e+00 | 0.1323 |
| 200894 | ARL13B | P5T-E | Human | Esophagus | ESCC | 1.94e-27 | 5.26e-01 | 0.1327 |
| 200894 | ARL13B | P8T-E | Human | Esophagus | ESCC | 2.23e-29 | 5.05e-01 | 0.0889 |
| 200894 | ARL13B | P9T-E | Human | Esophagus | ESCC | 4.65e-17 | 4.24e-01 | 0.1131 |
| 200894 | ARL13B | P10T-E | Human | Esophagus | ESCC | 1.22e-53 | 9.86e-01 | 0.116 |
| 200894 | ARL13B | P11T-E | Human | Esophagus | ESCC | 3.12e-22 | 1.06e+00 | 0.1426 |
| 200894 | ARL13B | P12T-E | Human | Esophagus | ESCC | 1.62e-19 | 4.67e-01 | 0.1122 |
| 200894 | ARL13B | P15T-E | Human | Esophagus | ESCC | 8.35e-12 | 1.38e-01 | 0.1149 |
| 200894 | ARL13B | P16T-E | Human | Esophagus | ESCC | 1.82e-30 | 7.36e-01 | 0.1153 |
| 200894 | ARL13B | P17T-E | Human | Esophagus | ESCC | 5.31e-06 | 3.61e-01 | 0.1278 |
| 200894 | ARL13B | P19T-E | Human | Esophagus | ESCC | 2.09e-03 | 5.42e-01 | 0.1662 |
| 200894 | ARL13B | P20T-E | Human | Esophagus | ESCC | 7.77e-15 | 2.66e-01 | 0.1124 |
| 200894 | ARL13B | P21T-E | Human | Esophagus | ESCC | 4.91e-16 | 4.26e-01 | 0.1617 |
| Page: 1 2 3 4 5 |
| Tissue | Expression Dynamics | Abbreviation |
| Esophagus | 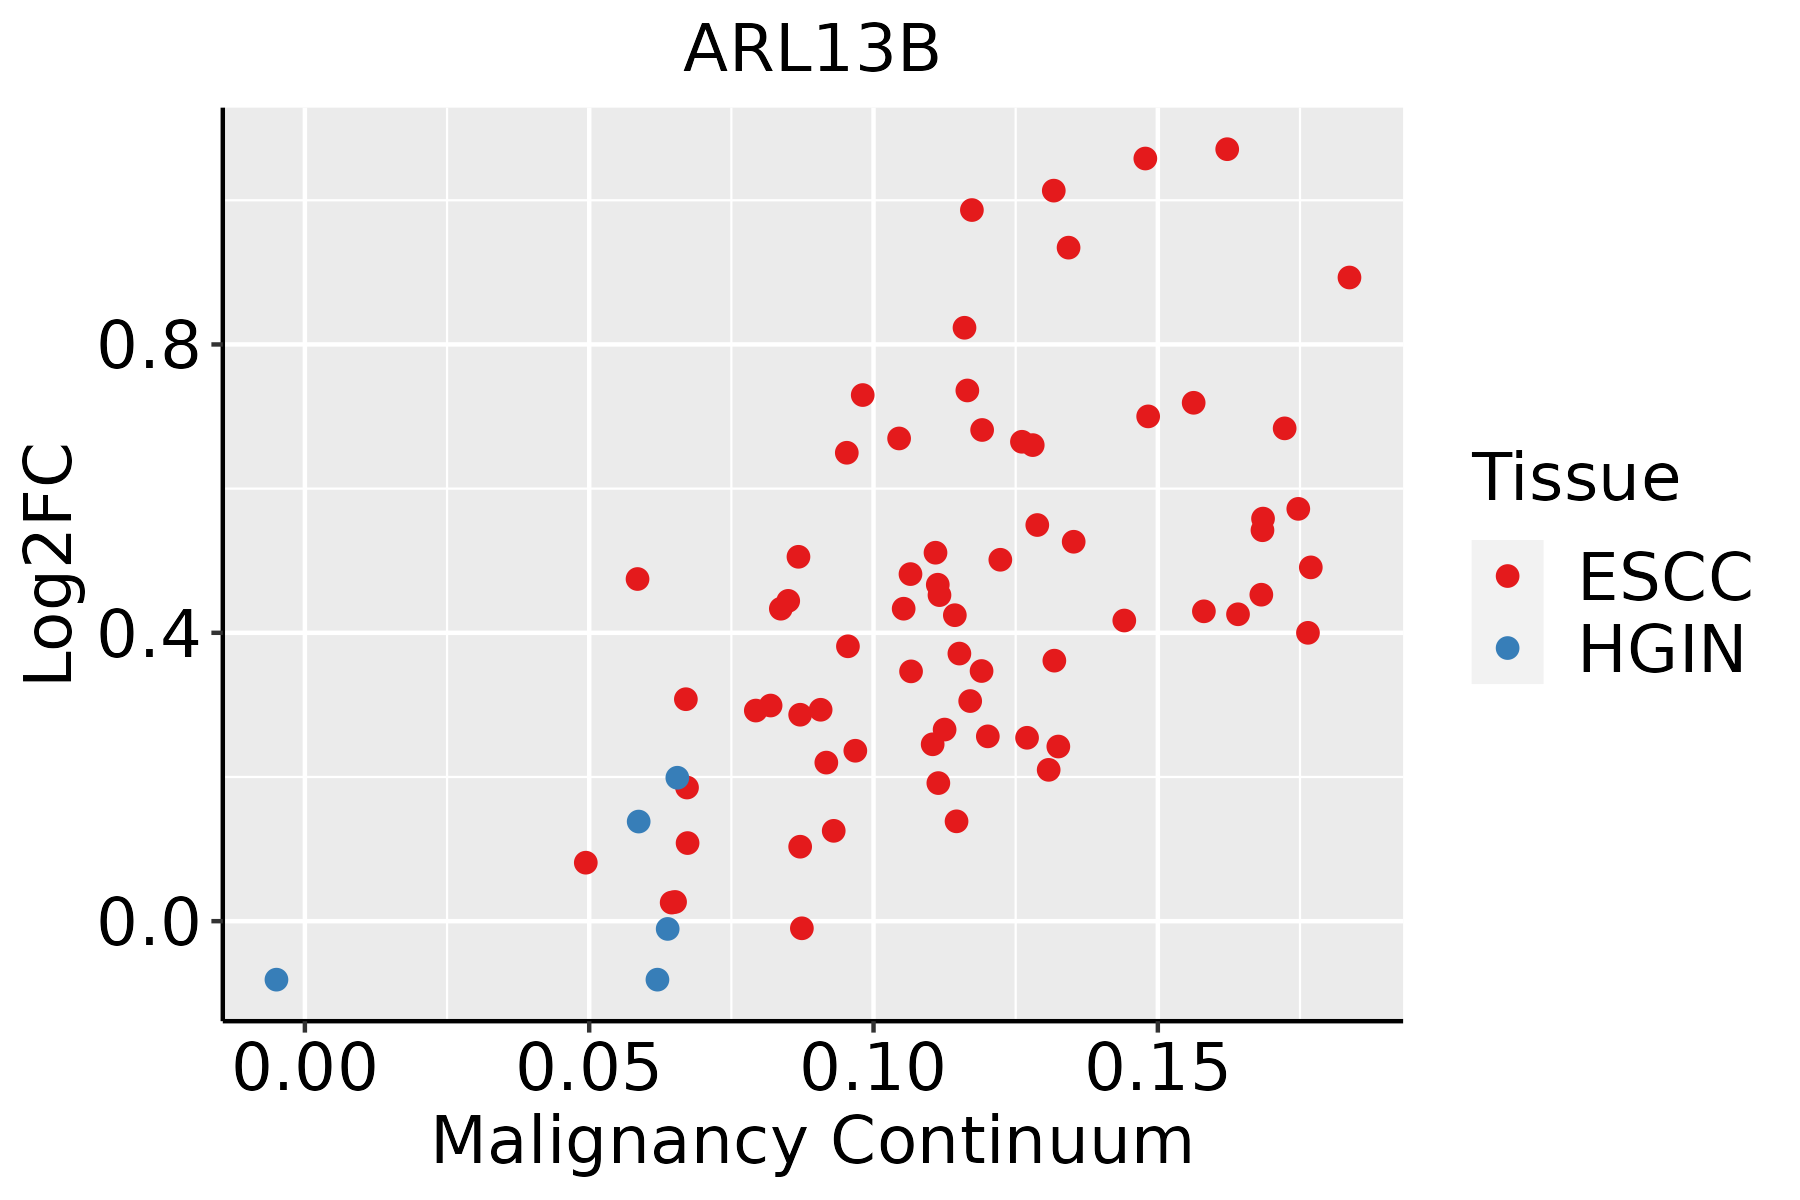 | ESCC: Esophageal squamous cell carcinoma |
| HGIN: High-grade intraepithelial neoplasias | ||
| LGIN: Low-grade intraepithelial neoplasias | ||
| Lung |  | AAH: Atypical adenomatous hyperplasia |
| AIS: Adenocarcinoma in situ | ||
| IAC: Invasive lung adenocarcinoma | ||
| MIA: Minimally invasive adenocarcinoma | ||
| Oral Cavity |  | EOLP: Erosive Oral lichen planus |
| LP: leukoplakia | ||
| NEOLP: Non-erosive oral lichen planus | ||
| OSCC: Oral squamous cell carcinoma | ||
| Thyroid |  | ATC: Anaplastic thyroid cancer |
| HT: Hashimoto's thyroiditis | ||
| PTC: Papillary thyroid cancer |
| ∗log2FC in expression of this searched gene in stem-like cells from each diseased tissue sample relative to stem-like cells in normal samples in each tissue plotted against the malignancy continuum. Samples are colored based on if they are from different disease stage. |
Top |
Malignant transformation related pathway analysis |
| Find out the enriched GO biological processes and KEGG pathways involved in transition from healthy to precancer to cancer |
| Tissue | Disease Stage | Enriched GO biological Processes |
| Colorectum | AD |  |
| Colorectum | SER |  |
| Colorectum | MSS |  |
| Colorectum | MSI-H |  |
| Colorectum | FAP |  |
| ∗Top 15 enriched GO BP terms are showed in the bar plot of each disease state in each tissue. Each row represents a significant GO biological process which is colored according to the -log10(p.adjust). |
| Page: 1 2 3 4 5 6 7 8 9 |
| GO ID | Tissue | Disease Stage | Description | Gene Ratio | Bg Ratio | pvalue | p.adjust | Count |
| GO:199077818 | Esophagus | HGIN | protein localization to cell periphery | 71/2587 | 333/18723 | 1.05e-04 | 2.24e-03 | 71 |
| GO:199077819 | Esophagus | ESCC | protein localization to cell periphery | 217/8552 | 333/18723 | 4.08e-13 | 1.88e-11 | 217 |
| GO:00219159 | Esophagus | ESCC | neural tube development | 101/8552 | 152/18723 | 1.78e-07 | 2.79e-06 | 101 |
| GO:006056210 | Esophagus | ESCC | epithelial tube morphogenesis | 187/8552 | 325/18723 | 9.95e-06 | 9.44e-05 | 187 |
| GO:001003827 | Esophagus | ESCC | response to metal ion | 208/8552 | 373/18723 | 5.02e-05 | 3.90e-04 | 208 |
| GO:00485687 | Esophagus | ESCC | embryonic organ development | 228/8552 | 427/18723 | 7.28e-04 | 3.79e-03 | 228 |
| GO:19055153 | Esophagus | ESCC | non-motile cilium assembly | 39/8552 | 61/18723 | 3.08e-03 | 1.28e-02 | 39 |
| GO:19907787 | Lung | IAC | protein localization to cell periphery | 66/2061 | 333/18723 | 1.44e-06 | 7.22e-05 | 66 |
| GO:00605624 | Lung | IAC | epithelial tube morphogenesis | 63/2061 | 325/18723 | 5.28e-06 | 2.07e-04 | 63 |
| GO:1905515 | Lung | IAC | non-motile cilium assembly | 16/2061 | 61/18723 | 7.09e-04 | 9.50e-03 | 16 |
| GO:00100388 | Lung | IAC | response to metal ion | 61/2061 | 373/18723 | 1.02e-03 | 1.22e-02 | 61 |
| GO:00309002 | Lung | IAC | forebrain development | 61/2061 | 379/18723 | 1.52e-03 | 1.61e-02 | 61 |
| GO:0060271 | Lung | IAC | cilium assembly | 55/2061 | 337/18723 | 1.84e-03 | 1.88e-02 | 55 |
| GO:00219155 | Lung | IAC | neural tube development | 29/2061 | 152/18723 | 2.19e-03 | 2.15e-02 | 29 |
| GO:0044782 | Lung | IAC | cilium organization | 58/2061 | 368/18723 | 3.15e-03 | 2.75e-02 | 58 |
| GO:00485684 | Lung | IAC | embryonic organ development | 64/2061 | 427/18723 | 6.46e-03 | 4.59e-02 | 64 |
| GO:0022029 | Lung | IAC | telencephalon cell migration | 13/2061 | 56/18723 | 6.78e-03 | 4.73e-02 | 13 |
| GO:199077812 | Lung | AIS | protein localization to cell periphery | 64/1849 | 333/18723 | 1.42e-07 | 1.48e-05 | 64 |
| GO:006056211 | Lung | AIS | epithelial tube morphogenesis | 57/1849 | 325/18723 | 1.27e-05 | 4.78e-04 | 57 |
| GO:001003813 | Lung | AIS | response to metal ion | 57/1849 | 373/18723 | 5.80e-04 | 9.01e-03 | 57 |
| Page: 1 2 3 |
| Pathway ID | Tissue | Disease Stage | Description | Gene Ratio | Bg Ratio | pvalue | p.adjust | qvalue | Count |
| Page: 1 |
Top |
Cell-cell communication analysis |
| Identification of potential cell-cell interactions between two cell types and their ligand-receptor pairs for different disease states |
| Ligand | Receptor | LRpair | Pathway | Tissue | Disease Stage |
| Page: 1 |
Top |
Single-cell gene regulatory network inference analysis |
| Find out the significant the regulons (TFs) and the target genes of each regulon across cell types for different disease states |
| TF | Cell Type | Tissue | Disease Stage | Target Gene | RSS | Regulon Activity |
| ∗The dot plots of a searched regulon are shown for all cell subpopulations in each disease state of each tissue based on the regulon specific score inferred using pySCENIC and by calculating the average expression. |
| Page: 1 |
Top |
Somatic mutation of malignant transformation related genes |
| Annotation of somatic variants for genes involved in malignant transformation |
| Hugo Symbol | Variant Class | Variant Classification | dbSNP RS | HGVSc | HGVSp | HGVSp Short | SWISSPROT | BIOTYPE | SIFT | PolyPhen | Tumor Sample Barcode | Tissue | Histology | Sex | Age | Stage | Therapy Types | Drugs | Outcome |
| ARL13B | SNV | Missense_Mutation | c.685G>C | p.Glu229Gln | p.E229Q | Q3SXY8 | protein_coding | deleterious(0.03) | benign(0.169) | TCGA-AR-A251-01 | Breast | breast invasive carcinoma | Female | <65 | III/IV | Chemotherapy | doxorubicin | SD | |
| ARL13B | SNV | Missense_Mutation | novel | c.693N>T | p.Lys231Asn | p.K231N | Q3SXY8 | protein_coding | deleterious(0.03) | benign(0.007) | TCGA-DG-A2KJ-01 | Cervix | cervical & endocervical cancer | Female | <65 | III/IV | Chemotherapy | cisplatin | SD |
| ARL13B | SNV | Missense_Mutation | c.761N>T | p.Thr254Met | p.T254M | Q3SXY8 | protein_coding | tolerated(0.13) | benign(0.001) | TCGA-A6-A565-01 | Colorectum | colon adenocarcinoma | Female | <65 | III/IV | Unspecific | 5FU | PD | |
| ARL13B | SNV | Missense_Mutation | c.16G>A | p.Ala6Thr | p.A6T | Q3SXY8 | protein_coding | tolerated(0.08) | benign(0.011) | TCGA-AA-3672-01 | Colorectum | colon adenocarcinoma | Female | >=65 | III/IV | Unknown | Unknown | SD | |
| ARL13B | SNV | Missense_Mutation | c.897N>C | p.Glu299Asp | p.E299D | Q3SXY8 | protein_coding | tolerated(0.78) | benign(0.005) | TCGA-AA-3837-01 | Colorectum | colon adenocarcinoma | Male | >=65 | I/II | Unknown | Unknown | SD | |
| ARL13B | SNV | Missense_Mutation | novel | c.362N>T | p.Ser121Leu | p.S121L | Q3SXY8 | protein_coding | deleterious(0) | possibly_damaging(0.557) | TCGA-CA-6717-01 | Colorectum | colon adenocarcinoma | Male | <65 | I/II | Chemotherapy | oxaliplatin | CR |
| ARL13B | SNV | Missense_Mutation | novel | c.656N>T | p.Arg219Ile | p.R219I | Q3SXY8 | protein_coding | deleterious(0) | probably_damaging(0.947) | TCGA-CA-6717-01 | Colorectum | colon adenocarcinoma | Male | <65 | I/II | Chemotherapy | oxaliplatin | CR |
| ARL13B | SNV | Missense_Mutation | c.1187N>G | p.Pro396Arg | p.P396R | Q3SXY8 | protein_coding | deleterious(0) | possibly_damaging(0.844) | TCGA-D5-6535-01 | Colorectum | colon adenocarcinoma | Female | >=65 | III/IV | Unknown | Unknown | SD | |
| ARL13B | SNV | Missense_Mutation | c.761C>T | p.Thr254Met | p.T254M | Q3SXY8 | protein_coding | tolerated(0.13) | benign(0.001) | TCGA-NH-A50V-01 | Colorectum | colon adenocarcinoma | Male | >=65 | III/IV | Chemotherapy | fluorouracil | CR | |
| ARL13B | SNV | Missense_Mutation | c.253N>C | p.Tyr85His | p.Y85H | Q3SXY8 | protein_coding | deleterious(0.04) | probably_damaging(0.94) | TCGA-NH-A5IV-01 | Colorectum | colon adenocarcinoma | Female | >=65 | I/II | Unknown | Unknown | SD |
| Page: 1 2 3 4 5 6 |
Top |
Related drugs of malignant transformation related genes |
| Identification of chemicals and drugs interact with genes involved in malignant transfromation |
| (DGIdb 4.0) |
| Entrez ID | Symbol | Category | Interaction Types | Drug Claim Name | Drug Name | PMIDs |
| Page: 1 |

Copyright 2023-Present -The University of Texas Health Science Center at Houston |