
|
|||||
|
 | |
| |
| |
| |
| |
| |
|
Gene: ARL1 |
Gene summary for ARL1 |
| Gene information | Species | Human | Gene symbol | ARL1 | Gene ID | 400 |
| Gene name | ADP ribosylation factor like GTPase 1 | |
| Gene Alias | ARFL1 | |
| Cytomap | 12q23.2 | |
| Gene Type | protein-coding | GO ID | GO:0006810 | UniProtAcc | P40616 |
Top |
Malignant transformation analysis |
| Identification of the aberrant gene expression in precancerous and cancerous lesions by comparing the gene expression of stem-like cells in diseased tissues with normal stem cells |
| Entrez ID | Symbol | Replicates | Species | Organ | Tissue | Adj P-value | Log2FC | Malignancy |
| 400 | ARL1 | HTA11_78_2000001011 | Human | Colorectum | AD | 1.51e-03 | 2.79e-01 | -0.1088 |
| 400 | ARL1 | HTA11_347_2000001011 | Human | Colorectum | AD | 1.86e-17 | 4.46e-01 | -0.1954 |
| 400 | ARL1 | HTA11_1391_2000001011 | Human | Colorectum | AD | 5.28e-06 | 2.96e-01 | -0.059 |
| 400 | ARL1 | HTA11_866_3004761011 | Human | Colorectum | AD | 5.29e-03 | 1.19e-01 | 0.096 |
| 400 | ARL1 | HTA11_99999970781_79442 | Human | Colorectum | MSS | 9.66e-09 | 3.58e-01 | 0.294 |
| 400 | ARL1 | HTA11_99999965062_69753 | Human | Colorectum | MSI-H | 1.05e-03 | 8.77e-01 | 0.3487 |
| 400 | ARL1 | HTA11_99999965104_69814 | Human | Colorectum | MSS | 2.03e-06 | 3.51e-01 | 0.281 |
| 400 | ARL1 | HTA11_99999971662_82457 | Human | Colorectum | MSS | 1.25e-04 | 2.93e-01 | 0.3859 |
| 400 | ARL1 | AEH-subject1 | Human | Endometrium | AEH | 2.04e-06 | -2.63e-01 | -0.3059 |
| 400 | ARL1 | AEH-subject2 | Human | Endometrium | AEH | 2.12e-13 | -3.54e-01 | -0.2525 |
| 400 | ARL1 | AEH-subject3 | Human | Endometrium | AEH | 2.36e-03 | -2.54e-01 | -0.2576 |
| 400 | ARL1 | AEH-subject4 | Human | Endometrium | AEH | 8.44e-06 | -2.61e-01 | -0.2657 |
| 400 | ARL1 | EEC-subject1 | Human | Endometrium | EEC | 1.73e-07 | -3.04e-01 | -0.2682 |
| 400 | ARL1 | EEC-subject2 | Human | Endometrium | EEC | 1.14e-14 | -4.05e-01 | -0.2607 |
| 400 | ARL1 | EEC-subject3 | Human | Endometrium | EEC | 3.89e-35 | -3.52e-01 | -0.2525 |
| 400 | ARL1 | EEC-subject5 | Human | Endometrium | EEC | 9.24e-04 | -1.79e-01 | -0.249 |
| 400 | ARL1 | GSM6177620_NYU_UCEC1_lib1_lib1 | Human | Endometrium | EEC | 3.35e-29 | -2.05e-01 | -0.1869 |
| 400 | ARL1 | GSM6177620_NYU_UCEC1_lib2_lib2 | Human | Endometrium | EEC | 5.95e-26 | -2.95e-01 | -0.1875 |
| 400 | ARL1 | GSM6177620_NYU_UCEC1_lib3_lib3 | Human | Endometrium | EEC | 1.56e-35 | -3.11e-01 | -0.1883 |
| 400 | ARL1 | GSM6177621_NYU_UCEC2_lib1_lib1 | Human | Endometrium | EEC | 1.25e-18 | -9.85e-02 | -0.1934 |
| Page: 1 2 3 4 5 6 7 8 9 |
| Tissue | Expression Dynamics | Abbreviation |
| Colorectum (GSE201348) |  | FAP: Familial adenomatous polyposis |
| CRC: Colorectal cancer | ||
| Colorectum (HTA11) |  | AD: Adenomas |
| SER: Sessile serrated lesions | ||
| MSI-H: Microsatellite-high colorectal cancer | ||
| MSS: Microsatellite stable colorectal cancer | ||
| Endometrium | 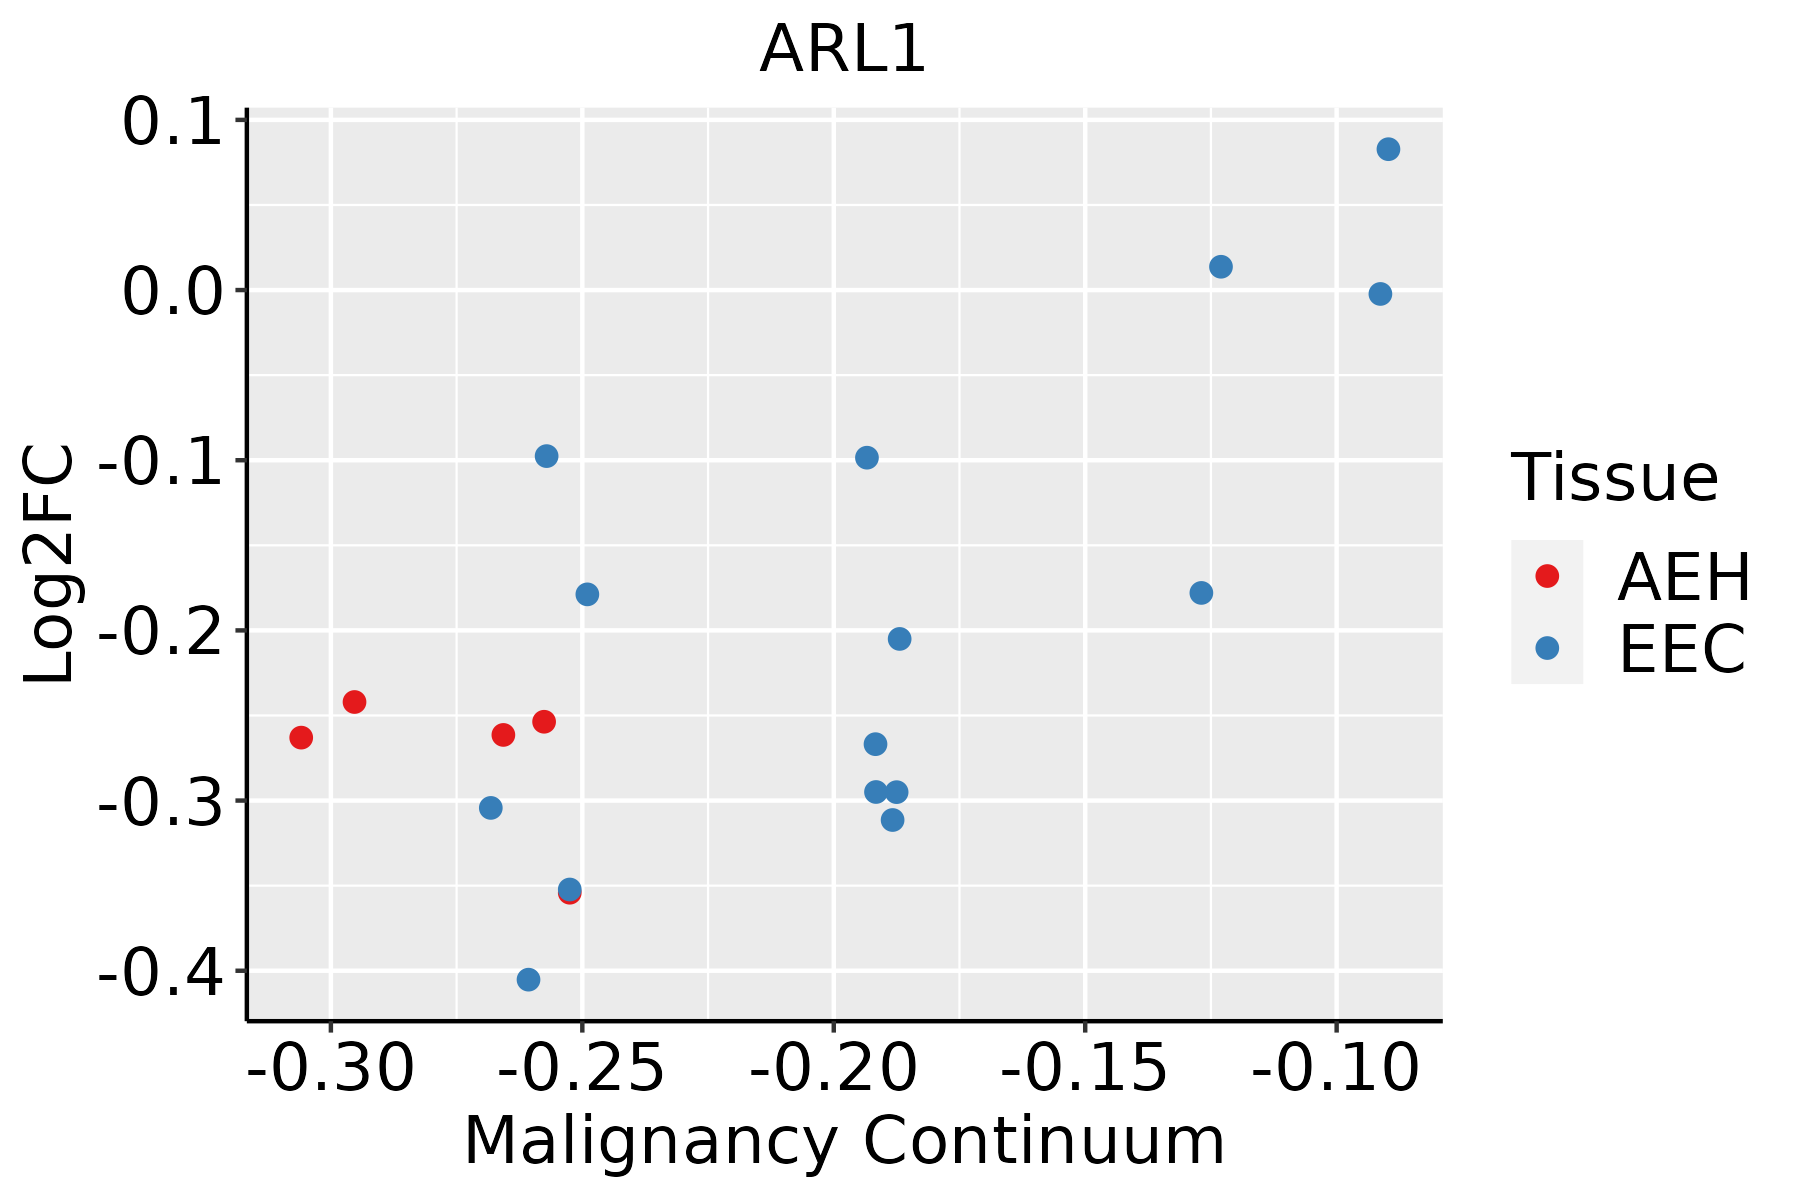 | AEH: Atypical endometrial hyperplasia |
| EEC: Endometrioid Cancer | ||
| Esophagus |  | ESCC: Esophageal squamous cell carcinoma |
| HGIN: High-grade intraepithelial neoplasias | ||
| LGIN: Low-grade intraepithelial neoplasias | ||
| Liver | 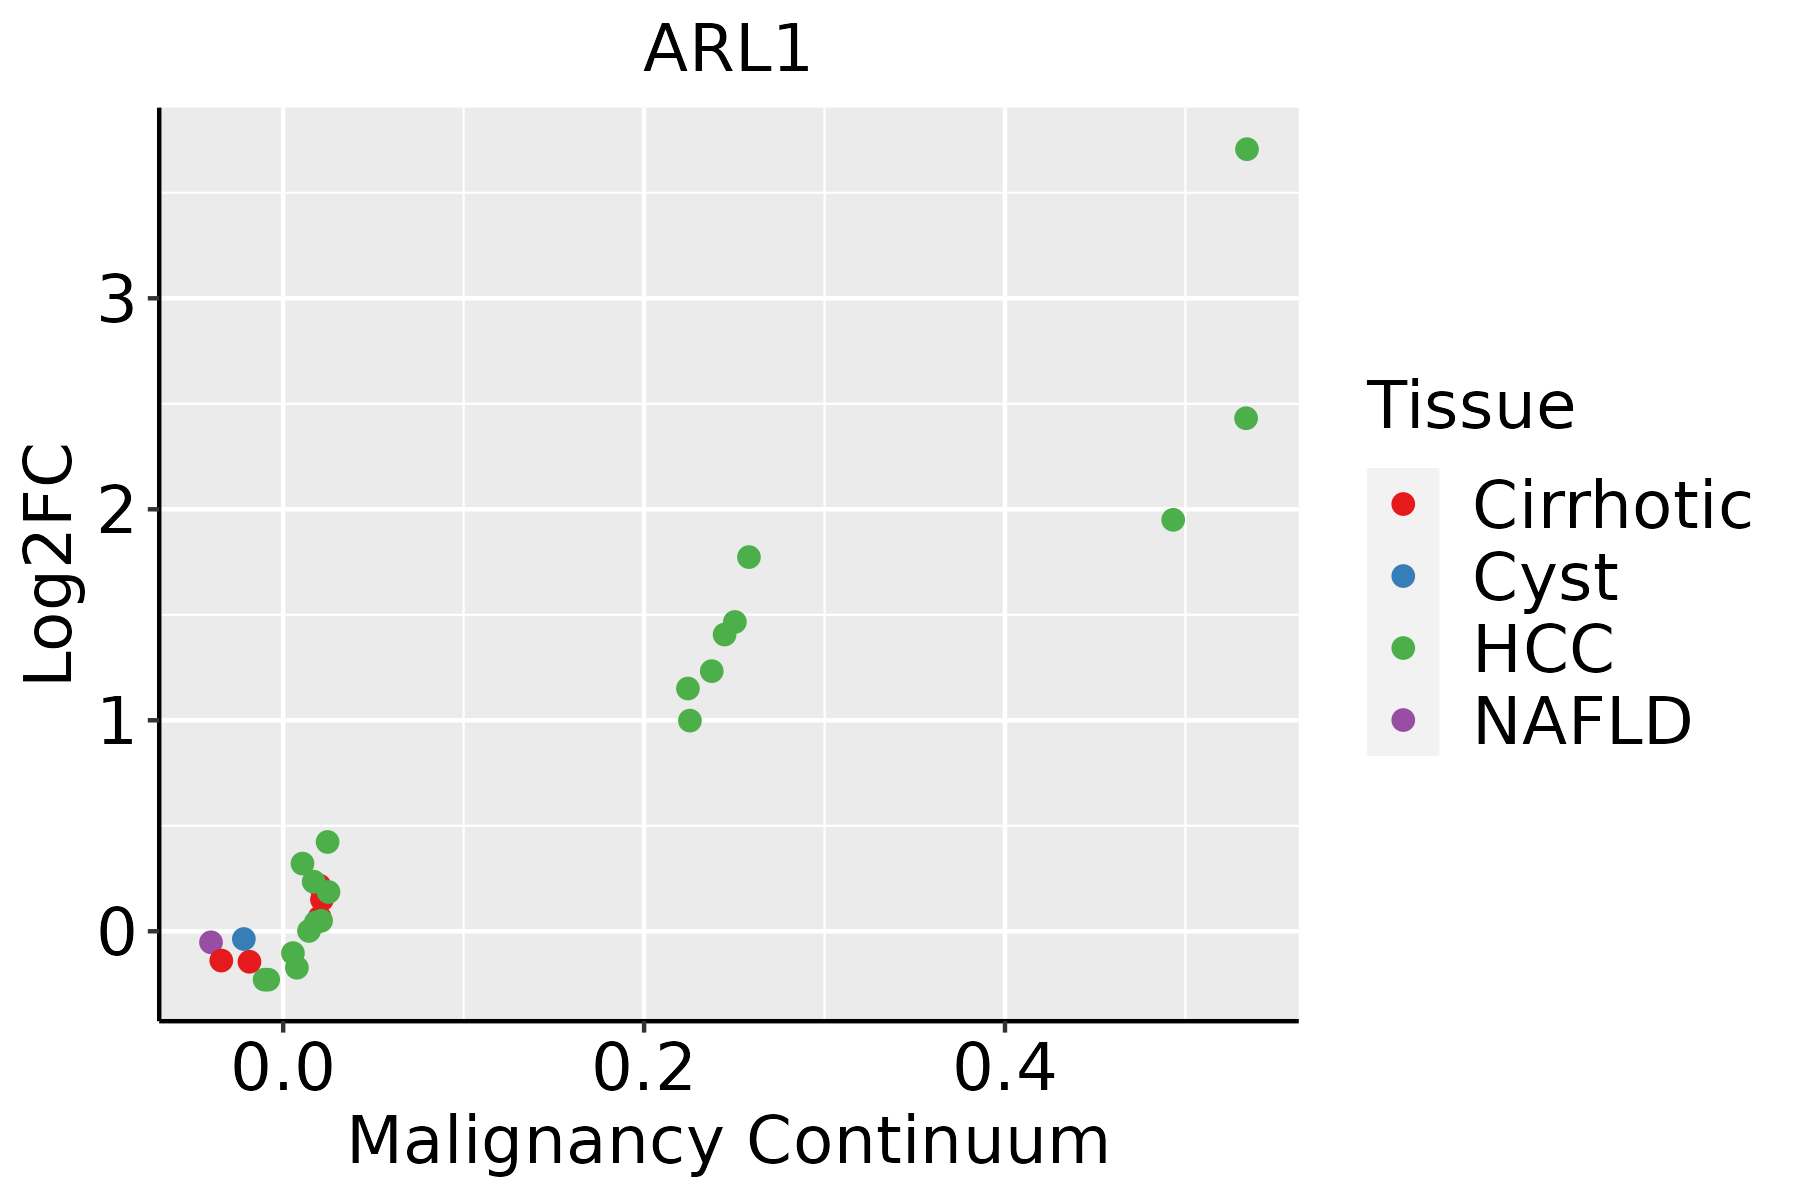 | HCC: Hepatocellular carcinoma |
| NAFLD: Non-alcoholic fatty liver disease | ||
| Oral Cavity | 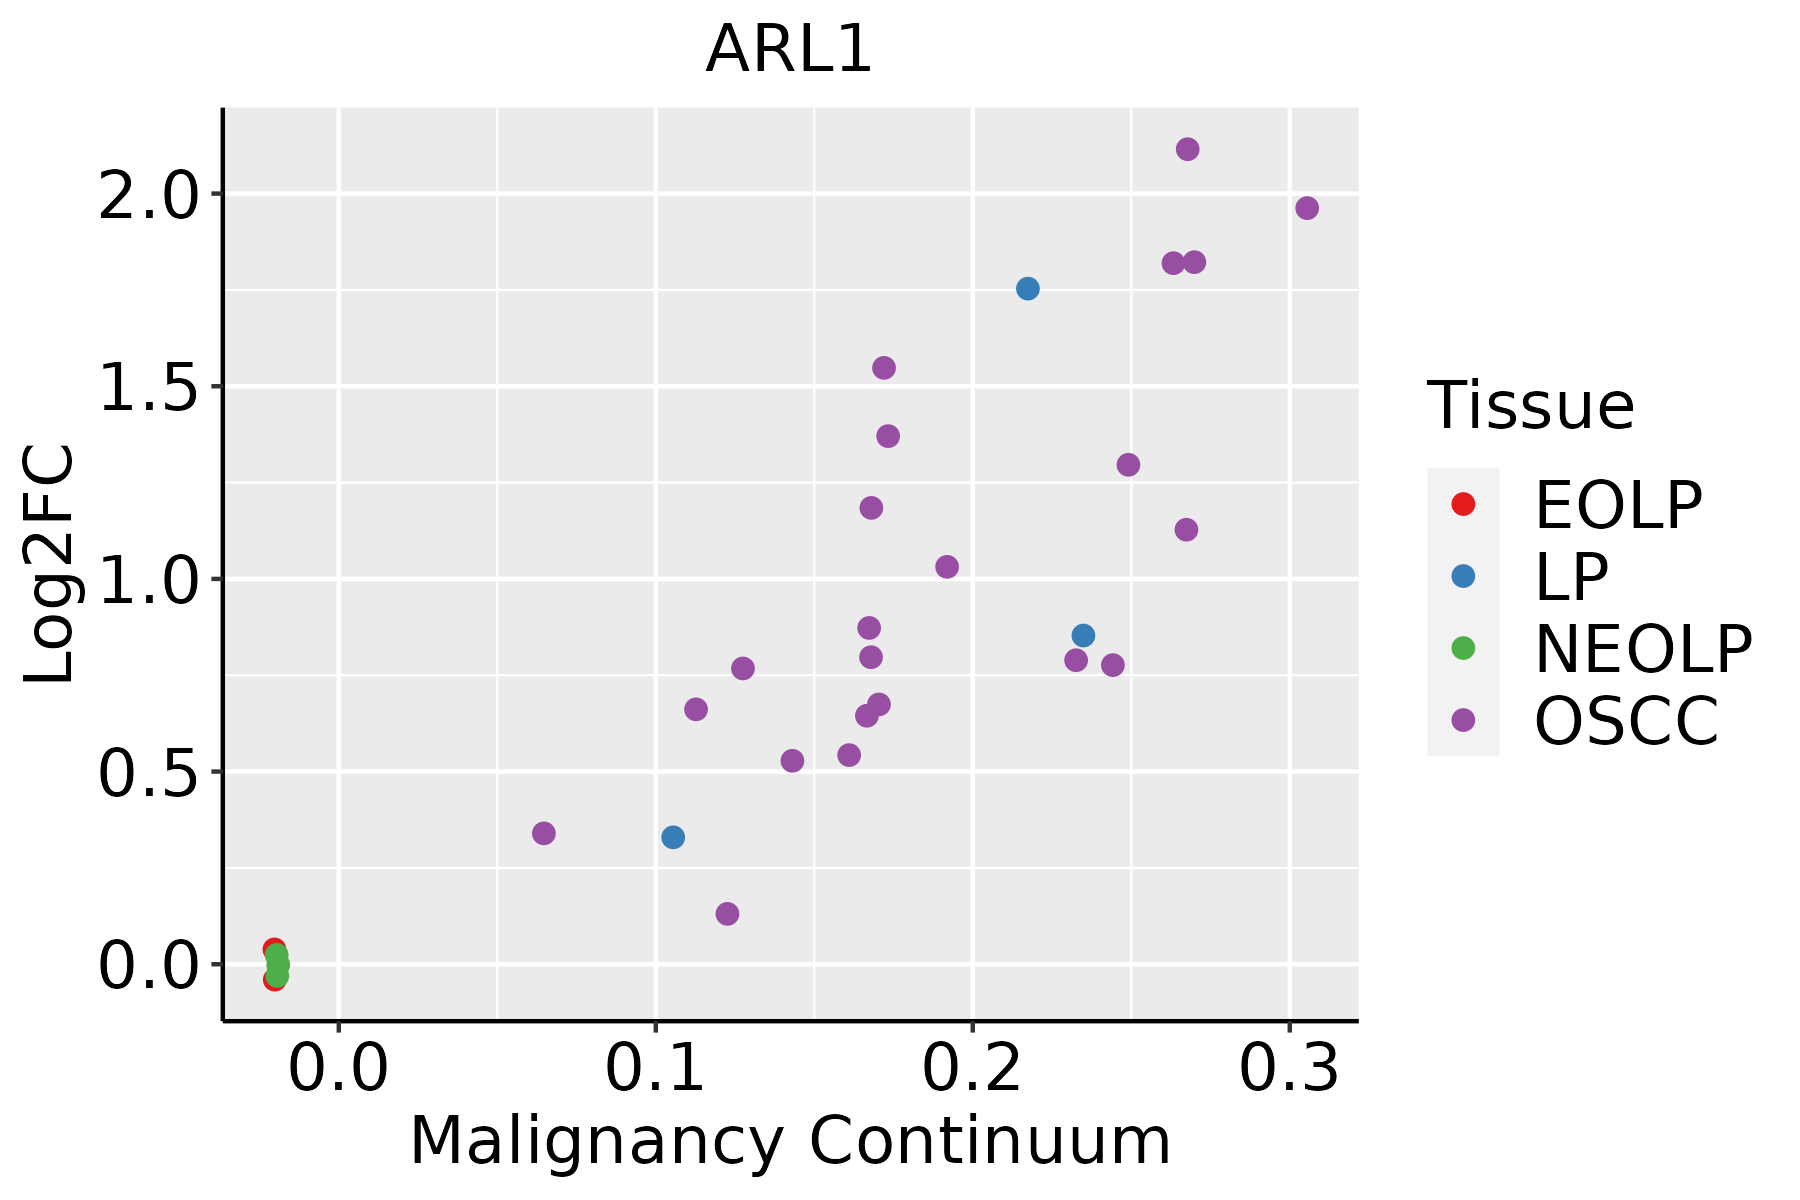 | EOLP: Erosive Oral lichen planus |
| LP: leukoplakia | ||
| NEOLP: Non-erosive oral lichen planus | ||
| OSCC: Oral squamous cell carcinoma | ||
| Prostate |  | BPH: Benign Prostatic Hyperplasia |
| Skin | 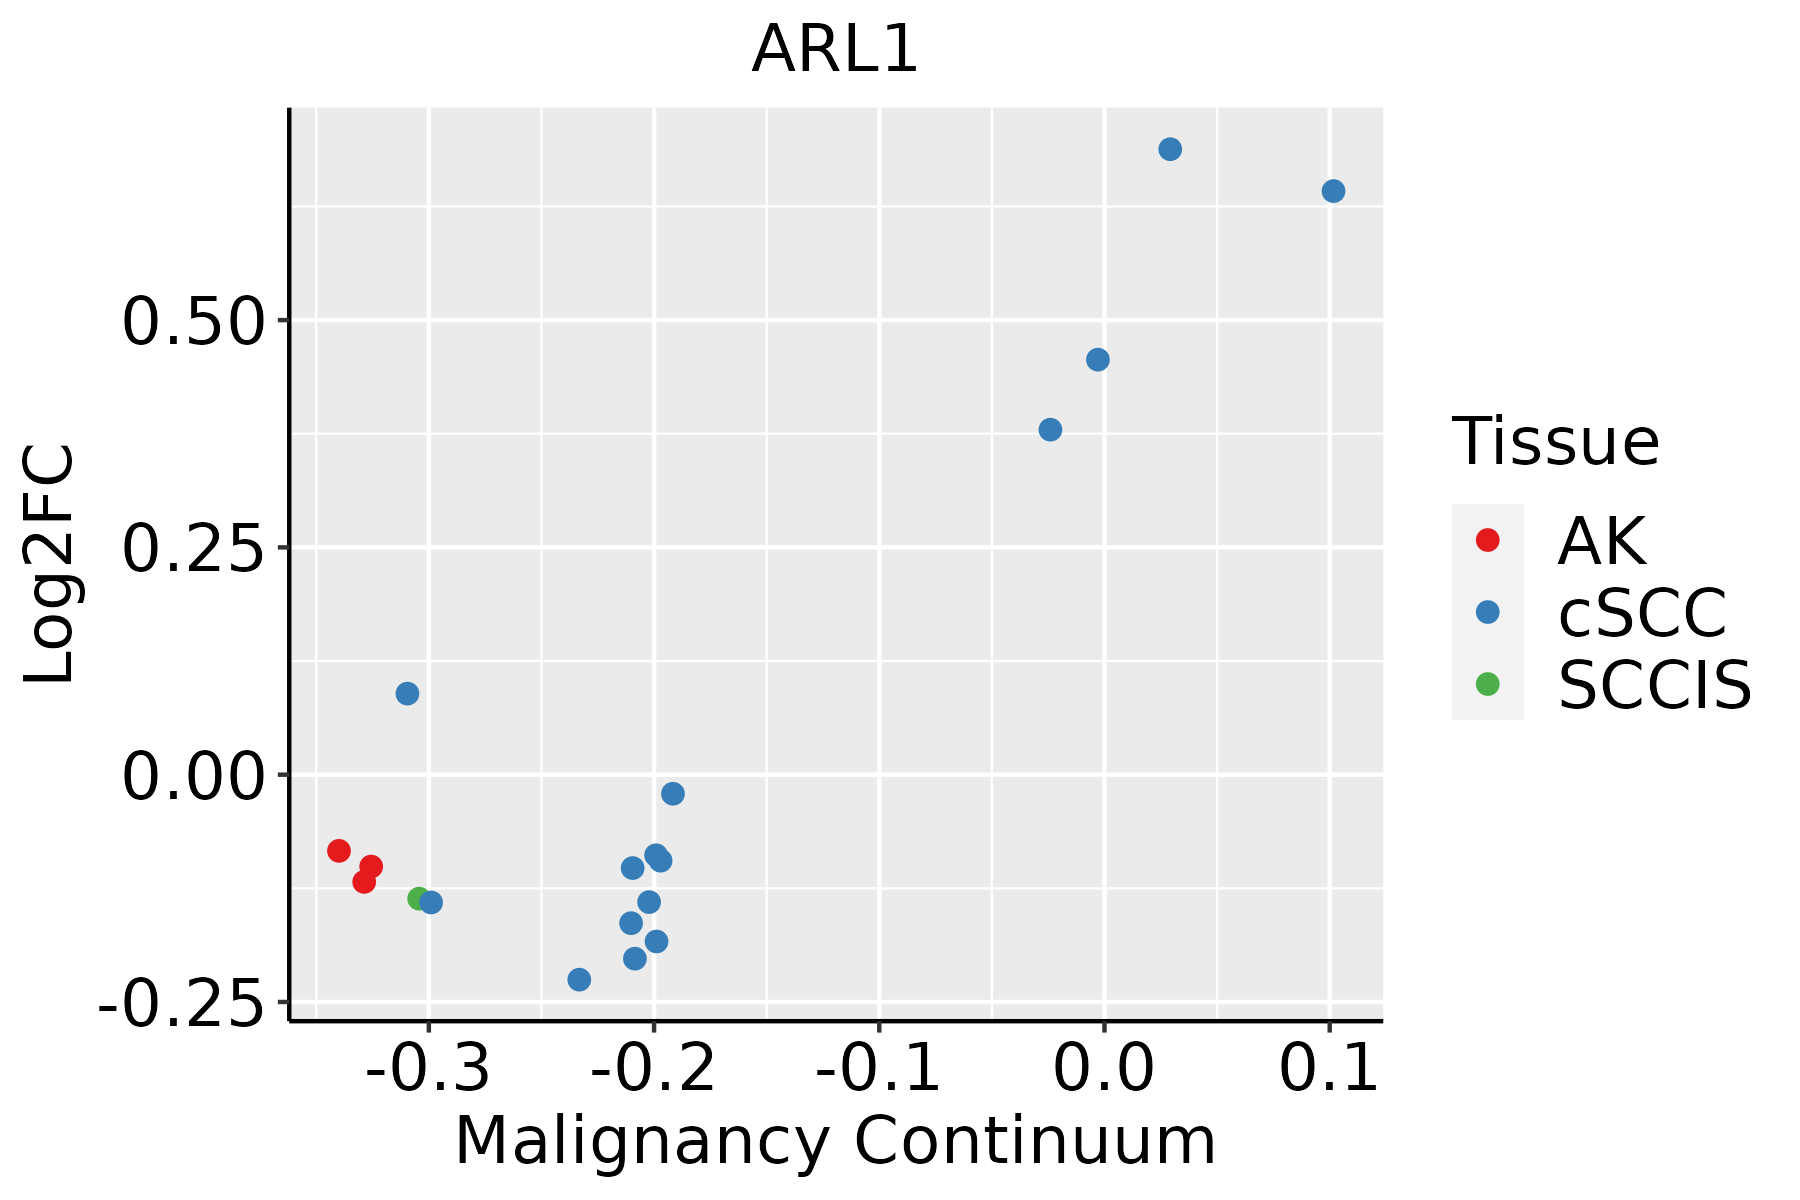 | AK: Actinic keratosis |
| cSCC: Cutaneous squamous cell carcinoma | ||
| SCCIS:squamous cell carcinoma in situ | ||
| Thyroid | 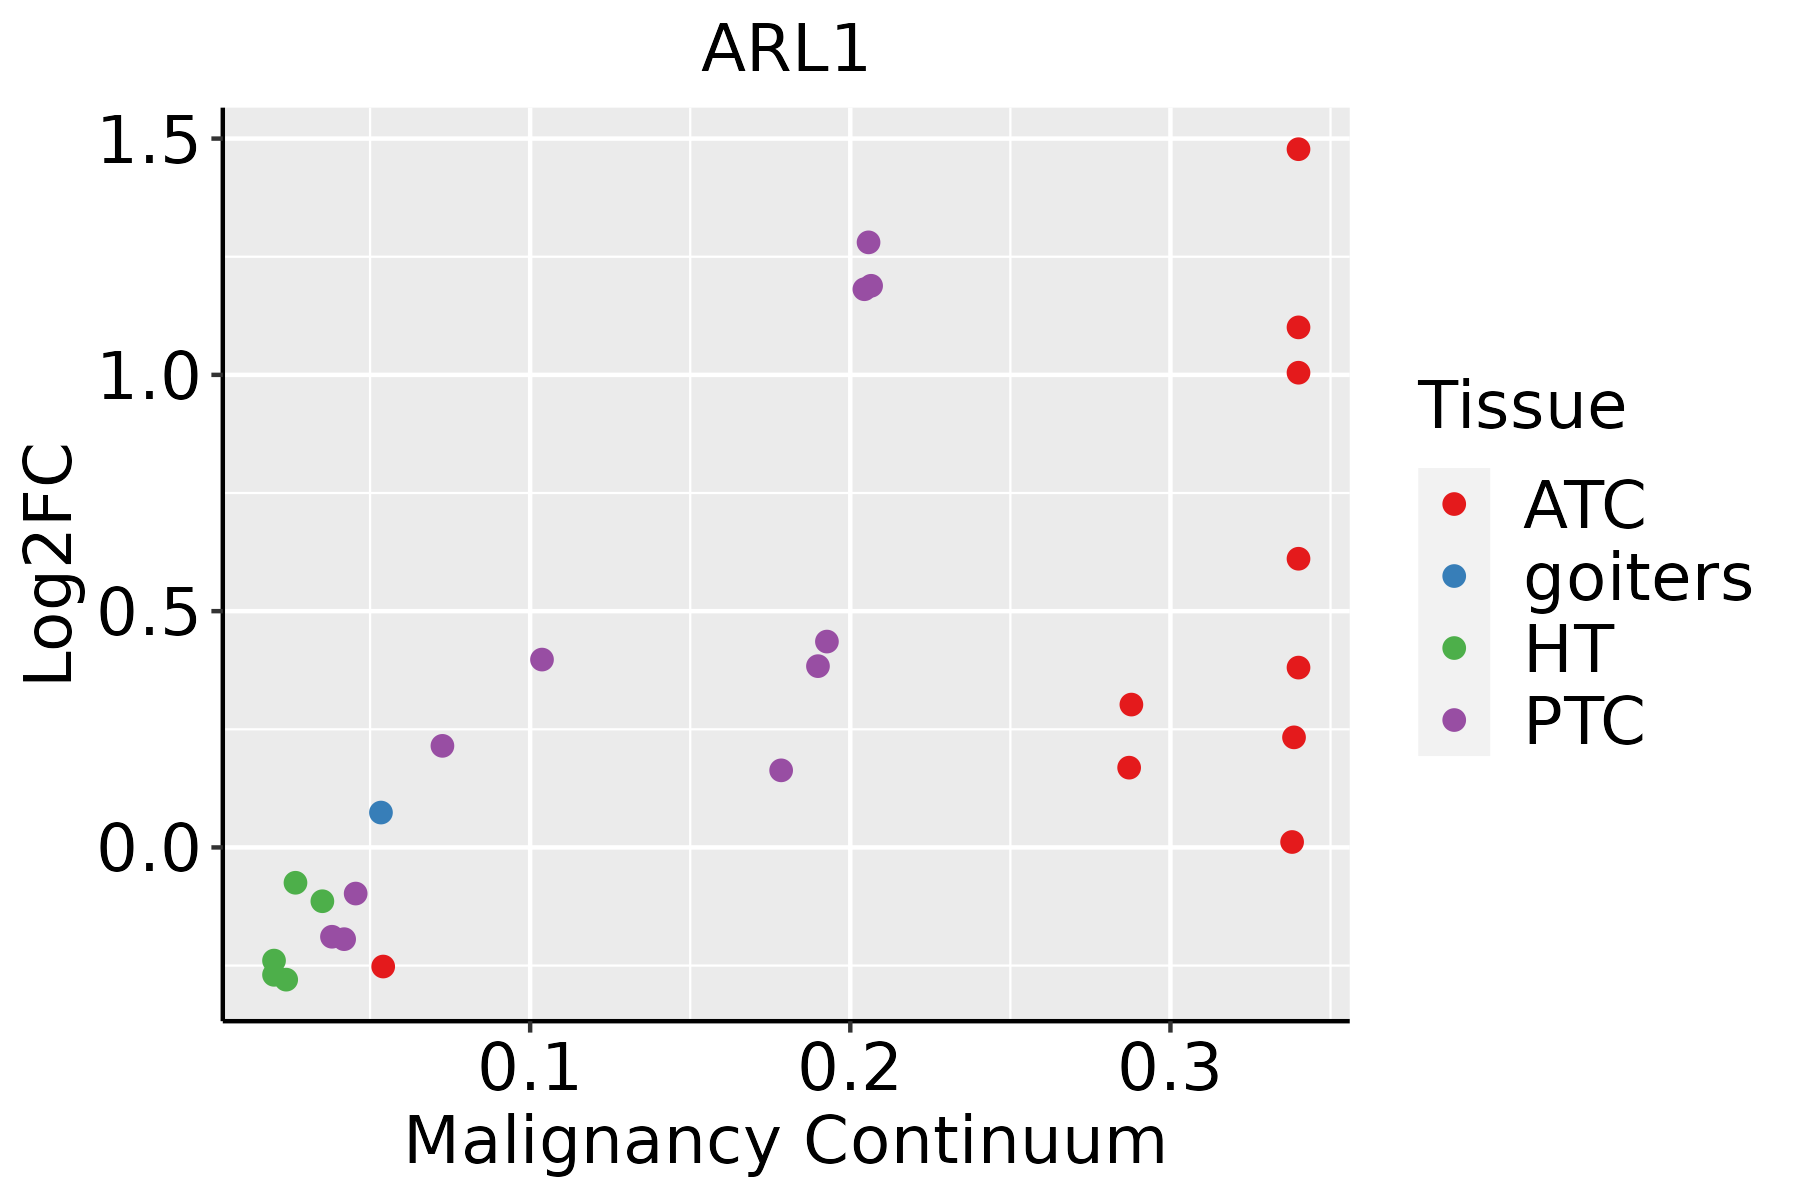 | ATC: Anaplastic thyroid cancer |
| HT: Hashimoto's thyroiditis | ||
| PTC: Papillary thyroid cancer |
| ∗log2FC in expression of this searched gene in stem-like cells from each diseased tissue sample relative to stem-like cells in normal samples in each tissue plotted against the malignancy continuum. Samples are colored based on if they are from different disease stage. |
Top |
Malignant transformation related pathway analysis |
| Find out the enriched GO biological processes and KEGG pathways involved in transition from healthy to precancer to cancer |
| Tissue | Disease Stage | Enriched GO biological Processes |
| Colorectum | AD |  |
| Colorectum | SER |  |
| Colorectum | MSS |  |
| Colorectum | MSI-H |  |
| Colorectum | FAP |  |
| ∗Top 15 enriched GO BP terms are showed in the bar plot of each disease state in each tissue. Each row represents a significant GO biological process which is colored according to the -log10(p.adjust). |
| Page: 1 2 3 4 5 6 7 8 9 |
| GO ID | Tissue | Disease Stage | Description | Gene Ratio | Bg Ratio | pvalue | p.adjust | Count |
| GO:0048193 | Colorectum | AD | Golgi vesicle transport | 109/3918 | 296/18723 | 1.80e-10 | 1.68e-08 | 109 |
| GO:0016197 | Colorectum | AD | endosomal transport | 90/3918 | 230/18723 | 1.88e-10 | 1.73e-08 | 90 |
| GO:0016482 | Colorectum | AD | cytosolic transport | 68/3918 | 168/18723 | 6.00e-09 | 3.72e-07 | 68 |
| GO:0042147 | Colorectum | AD | retrograde transport, endosome to Golgi | 37/3918 | 91/18723 | 1.46e-05 | 3.14e-04 | 37 |
| GO:0034067 | Colorectum | AD | protein localization to Golgi apparatus | 14/3918 | 29/18723 | 9.40e-04 | 8.92e-03 | 14 |
| GO:00481932 | Colorectum | MSS | Golgi vesicle transport | 101/3467 | 296/18723 | 9.09e-11 | 9.77e-09 | 101 |
| GO:00161972 | Colorectum | MSS | endosomal transport | 79/3467 | 230/18723 | 7.04e-09 | 4.39e-07 | 79 |
| GO:00164822 | Colorectum | MSS | cytosolic transport | 59/3467 | 168/18723 | 2.29e-07 | 9.79e-06 | 59 |
| GO:00421471 | Colorectum | MSS | retrograde transport, endosome to Golgi | 33/3467 | 91/18723 | 4.78e-05 | 8.71e-04 | 33 |
| GO:00481933 | Colorectum | MSI-H | Golgi vesicle transport | 39/1319 | 296/18723 | 1.17e-04 | 3.51e-03 | 39 |
| GO:00481939 | Endometrium | AEH | Golgi vesicle transport | 60/2100 | 296/18723 | 3.65e-06 | 9.79e-05 | 60 |
| GO:00070305 | Endometrium | AEH | Golgi organization | 32/2100 | 157/18723 | 5.73e-04 | 5.69e-03 | 32 |
| GO:004819313 | Endometrium | EEC | Golgi vesicle transport | 60/2168 | 296/18723 | 9.91e-06 | 2.17e-04 | 60 |
| GO:000703012 | Endometrium | EEC | Golgi organization | 32/2168 | 157/18723 | 9.87e-04 | 8.76e-03 | 32 |
| GO:00601911 | Endometrium | EEC | regulation of lipase activity | 19/2168 | 91/18723 | 7.46e-03 | 4.19e-02 | 19 |
| GO:004819317 | Esophagus | HGIN | Golgi vesicle transport | 83/2587 | 296/18723 | 8.59e-11 | 8.89e-09 | 83 |
| GO:001619710 | Esophagus | HGIN | endosomal transport | 57/2587 | 230/18723 | 5.74e-06 | 1.81e-04 | 57 |
| GO:199077818 | Esophagus | HGIN | protein localization to cell periphery | 71/2587 | 333/18723 | 1.05e-04 | 2.24e-03 | 71 |
| GO:004819318 | Esophagus | ESCC | Golgi vesicle transport | 231/8552 | 296/18723 | 1.82e-30 | 9.63e-28 | 231 |
| GO:001619715 | Esophagus | ESCC | endosomal transport | 168/8552 | 230/18723 | 2.28e-17 | 1.93e-15 | 168 |
| Page: 1 2 3 4 5 6 7 |
| Pathway ID | Tissue | Disease Stage | Description | Gene Ratio | Bg Ratio | pvalue | p.adjust | qvalue | Count |
| Page: 1 |
Top |
Cell-cell communication analysis |
| Identification of potential cell-cell interactions between two cell types and their ligand-receptor pairs for different disease states |
| Ligand | Receptor | LRpair | Pathway | Tissue | Disease Stage |
| Page: 1 |
Top |
Single-cell gene regulatory network inference analysis |
| Find out the significant the regulons (TFs) and the target genes of each regulon across cell types for different disease states |
| TF | Cell Type | Tissue | Disease Stage | Target Gene | RSS | Regulon Activity |
| ∗The dot plots of a searched regulon are shown for all cell subpopulations in each disease state of each tissue based on the regulon specific score inferred using pySCENIC and by calculating the average expression. |
| Page: 1 |
Top |
Somatic mutation of malignant transformation related genes |
| Annotation of somatic variants for genes involved in malignant transformation |
| Hugo Symbol | Variant Class | Variant Classification | dbSNP RS | HGVSc | HGVSp | HGVSp Short | SWISSPROT | BIOTYPE | SIFT | PolyPhen | Tumor Sample Barcode | Tissue | Histology | Sex | Age | Stage | Therapy Types | Drugs | Outcome |
| ARL1 | SNV | Missense_Mutation | novel | c.508N>G | p.Met170Val | p.M170V | P40616 | protein_coding | deleterious(0) | benign(0.013) | TCGA-A7-A0DA-01 | Breast | breast invasive carcinoma | Female | <65 | I/II | Chemotherapy | adriamycin | SD |
| ARL1 | SNV | Missense_Mutation | novel | c.256N>T | p.Asp86Tyr | p.D86Y | P40616 | protein_coding | deleterious(0) | probably_damaging(0.981) | TCGA-2W-A8YY-01 | Cervix | cervical & endocervical cancer | Female | <65 | I/II | Chemotherapy | cisplatin | CR |
| ARL1 | SNV | Missense_Mutation | novel | c.509T>C | p.Met170Thr | p.M170T | P40616 | protein_coding | deleterious(0) | possibly_damaging(0.887) | TCGA-VS-A9U6-01 | Cervix | cervical & endocervical cancer | Female | <65 | I/II | Chemotherapy | cisplatin | PD |
| ARL1 | SNV | Missense_Mutation | c.494N>A | p.Gly165Asp | p.G165D | P40616 | protein_coding | deleterious(0) | probably_damaging(1) | TCGA-AA-A010-01 | Colorectum | colon adenocarcinoma | Female | <65 | I/II | Chemotherapy | folinic | CR | |
| ARL1 | SNV | Missense_Mutation | c.56N>A | p.Arg19Lys | p.R19K | P40616 | protein_coding | deleterious(0.01) | probably_damaging(1) | TCGA-AG-A002-01 | Colorectum | rectum adenocarcinoma | Male | <65 | I/II | Unknown | Unknown | SD | |
| ARL1 | SNV | Missense_Mutation | c.296G>A | p.Arg99Gln | p.R99Q | P40616 | protein_coding | deleterious(0) | probably_damaging(0.999) | TCGA-EI-6917-01 | Colorectum | rectum adenocarcinoma | Male | <65 | III/IV | Chemotherapy | 5fluorouracil+oxaciplatina+l-folinian | SD | |
| ARL1 | SNV | Missense_Mutation | c.175A>G | p.Lys59Glu | p.K59E | P40616 | protein_coding | deleterious(0.02) | benign(0.055) | TCGA-EI-6917-01 | Colorectum | rectum adenocarcinoma | Male | <65 | III/IV | Chemotherapy | 5fluorouracil+oxaciplatina+l-folinian | SD | |
| ARL1 | insertion | In_Frame_Ins | novel | c.517_518insATGCCAATAATCATA | p.Leu173delinsTyrAlaAsnAsnHisIle | p.L173delinsYANNHI | P40616 | protein_coding | TCGA-AM-5820-01 | Colorectum | colon adenocarcinoma | Female | <65 | I/II | Unknown | Unknown | SD | ||
| ARL1 | SNV | Missense_Mutation | novel | c.263N>C | p.Val88Ala | p.V88A | P40616 | protein_coding | deleterious(0) | possibly_damaging(0.854) | TCGA-A5-A0G1-01 | Endometrium | uterine corpus endometrioid carcinoma | Female | >=65 | I/II | Unknown | Unknown | SD |
| ARL1 | SNV | Missense_Mutation | novel | c.298A>C | p.Ile100Leu | p.I100L | P40616 | protein_coding | tolerated(0.58) | benign(0.007) | TCGA-A5-A0G2-01 | Endometrium | uterine corpus endometrioid carcinoma | Female | <65 | III/IV | Unknown | Unknown | SD |
| Page: 1 2 |
Top |
Related drugs of malignant transformation related genes |
| Identification of chemicals and drugs interact with genes involved in malignant transfromation |
| (DGIdb 4.0) |
| Entrez ID | Symbol | Category | Interaction Types | Drug Claim Name | Drug Name | PMIDs |
| Page: 1 |

Copyright 2023-Present -The University of Texas Health Science Center at Houston |