
|
|||||
|
 | |
| |
| |
| |
| |
| |
|
Gene: ARID5A |
Gene summary for ARID5A |
| Gene information | Species | Human | Gene symbol | ARID5A | Gene ID | 10865 |
| Gene name | AT-rich interaction domain 5A | |
| Gene Alias | MRF-1 | |
| Cytomap | 2q11.2 | |
| Gene Type | protein-coding | GO ID | GO:0000122 | UniProtAcc | Q03989 |
Top |
Malignant transformation analysis |
| Identification of the aberrant gene expression in precancerous and cancerous lesions by comparing the gene expression of stem-like cells in diseased tissues with normal stem cells |
| Entrez ID | Symbol | Replicates | Species | Organ | Tissue | Adj P-value | Log2FC | Malignancy |
| 10865 | ARID5A | GSM4909281 | Human | Breast | IDC | 1.80e-03 | -2.47e-01 | 0.21 |
| 10865 | ARID5A | GSM4909286 | Human | Breast | IDC | 2.03e-04 | -2.47e-01 | 0.1081 |
| 10865 | ARID5A | GSM4909290 | Human | Breast | IDC | 1.16e-07 | -3.04e-01 | 0.2096 |
| 10865 | ARID5A | GSM4909293 | Human | Breast | IDC | 3.97e-05 | -1.84e-01 | 0.1581 |
| 10865 | ARID5A | GSM4909294 | Human | Breast | IDC | 4.65e-05 | -2.30e-01 | 0.2022 |
| 10865 | ARID5A | GSM4909296 | Human | Breast | IDC | 6.25e-11 | -2.88e-01 | 0.1524 |
| 10865 | ARID5A | GSM4909299 | Human | Breast | IDC | 1.57e-05 | 4.28e-01 | 0.035 |
| 10865 | ARID5A | GSM4909300 | Human | Breast | IDC | 6.90e-08 | 5.81e-01 | 0.0334 |
| 10865 | ARID5A | GSM4909301 | Human | Breast | IDC | 2.17e-03 | -2.26e-01 | 0.1577 |
| 10865 | ARID5A | GSM4909304 | Human | Breast | IDC | 1.23e-14 | -3.00e-01 | 0.1636 |
| 10865 | ARID5A | GSM4909305 | Human | Breast | IDC | 5.87e-12 | 5.79e-01 | 0.0436 |
| 10865 | ARID5A | GSM4909311 | Human | Breast | IDC | 4.03e-13 | -1.87e-01 | 0.1534 |
| 10865 | ARID5A | GSM4909312 | Human | Breast | IDC | 3.24e-05 | -1.95e-01 | 0.1552 |
| 10865 | ARID5A | GSM4909313 | Human | Breast | IDC | 1.13e-04 | 3.61e-01 | 0.0391 |
| 10865 | ARID5A | GSM4909315 | Human | Breast | IDC | 7.88e-05 | -2.72e-01 | 0.21 |
| 10865 | ARID5A | GSM4909319 | Human | Breast | IDC | 2.50e-10 | -2.96e-01 | 0.1563 |
| 10865 | ARID5A | GSM4909320 | Human | Breast | IDC | 6.39e-04 | -3.09e-01 | 0.1575 |
| 10865 | ARID5A | GSM4909321 | Human | Breast | IDC | 7.16e-11 | -2.93e-01 | 0.1559 |
| 10865 | ARID5A | brca3 | Human | Breast | Precancer | 2.66e-04 | 1.93e-01 | -0.0263 |
| 10865 | ARID5A | NCCBC14 | Human | Breast | DCIS | 2.52e-02 | -2.11e-01 | 0.2021 |
| Page: 1 2 3 4 5 |
| Tissue | Expression Dynamics | Abbreviation |
| Breast | 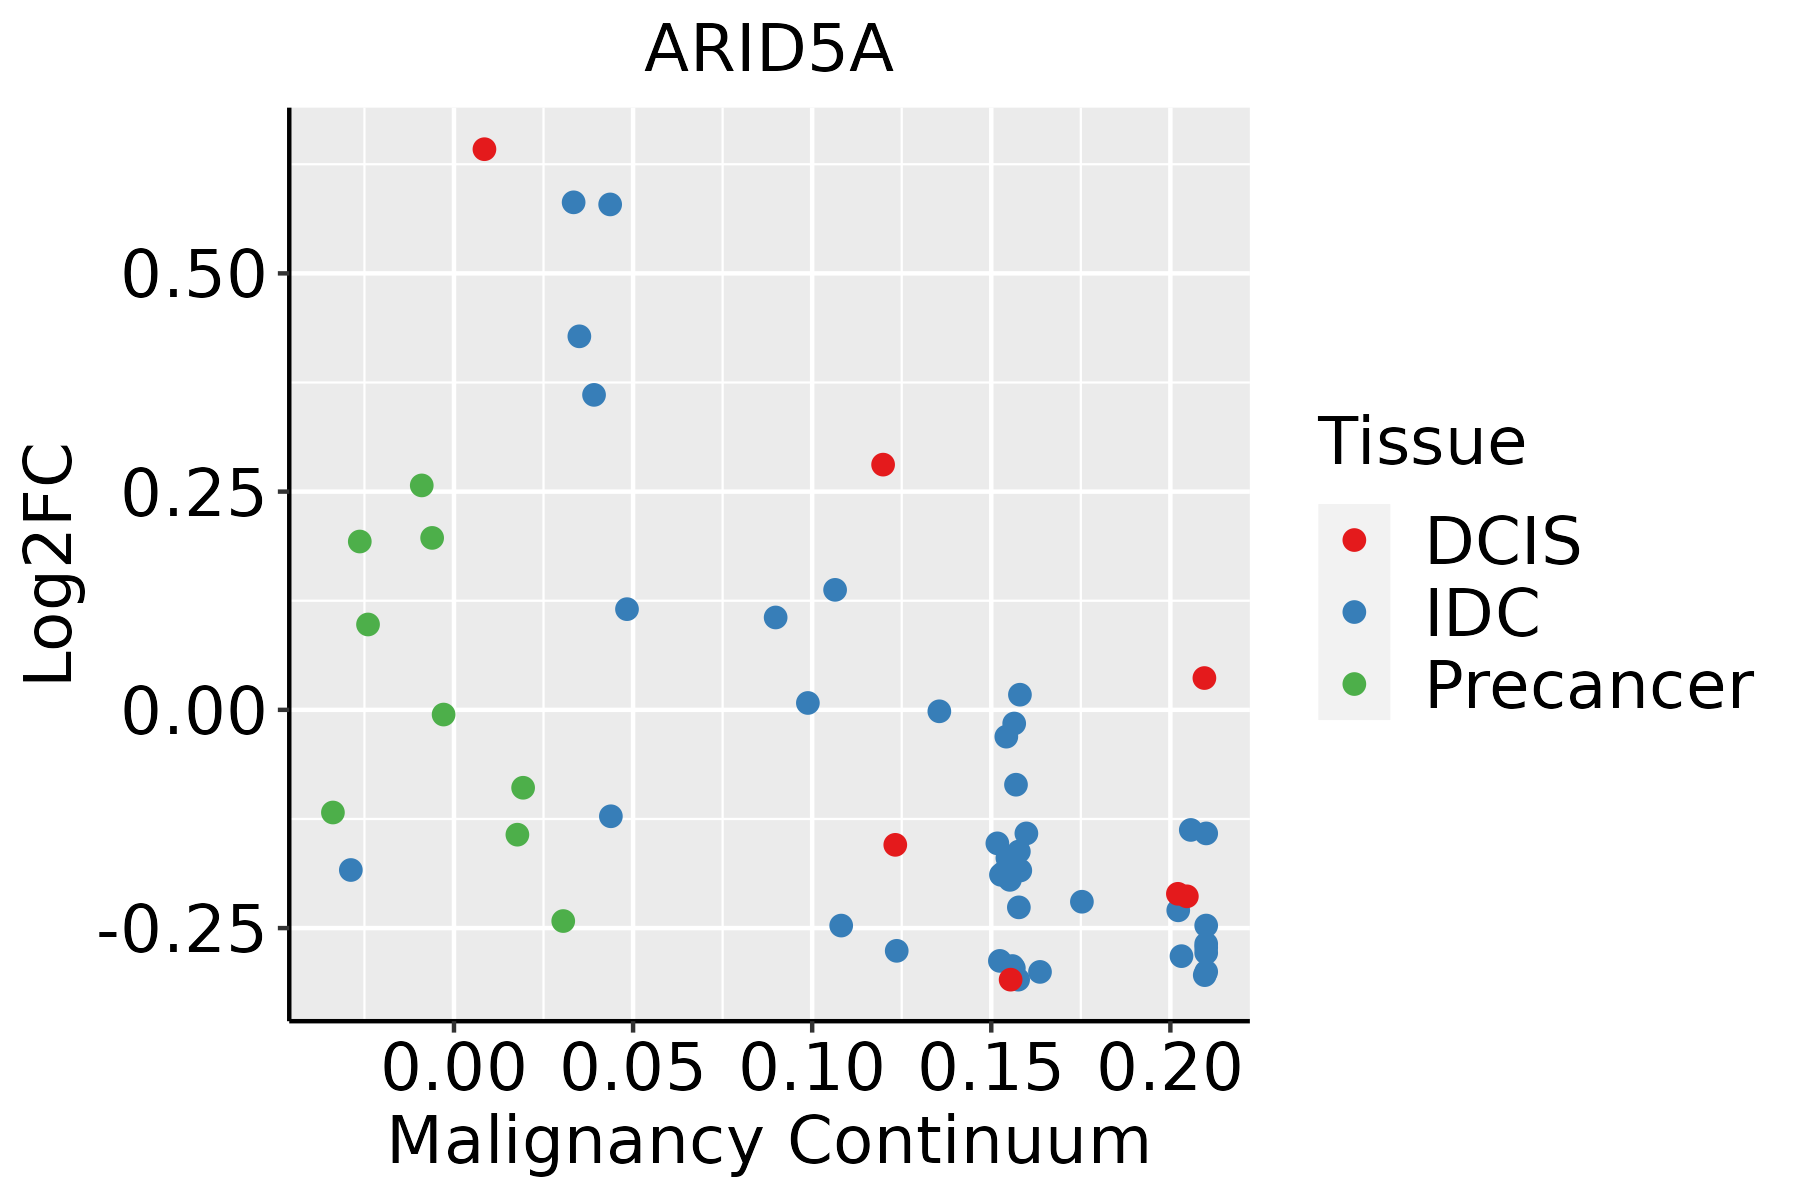 | IDC: Invasive ductal carcinoma |
| DCIS: Ductal carcinoma in situ | ||
| Precancer(BRCA1-mut): Precancerous lesion from BRCA1 mutation carriers | ||
| Esophagus | 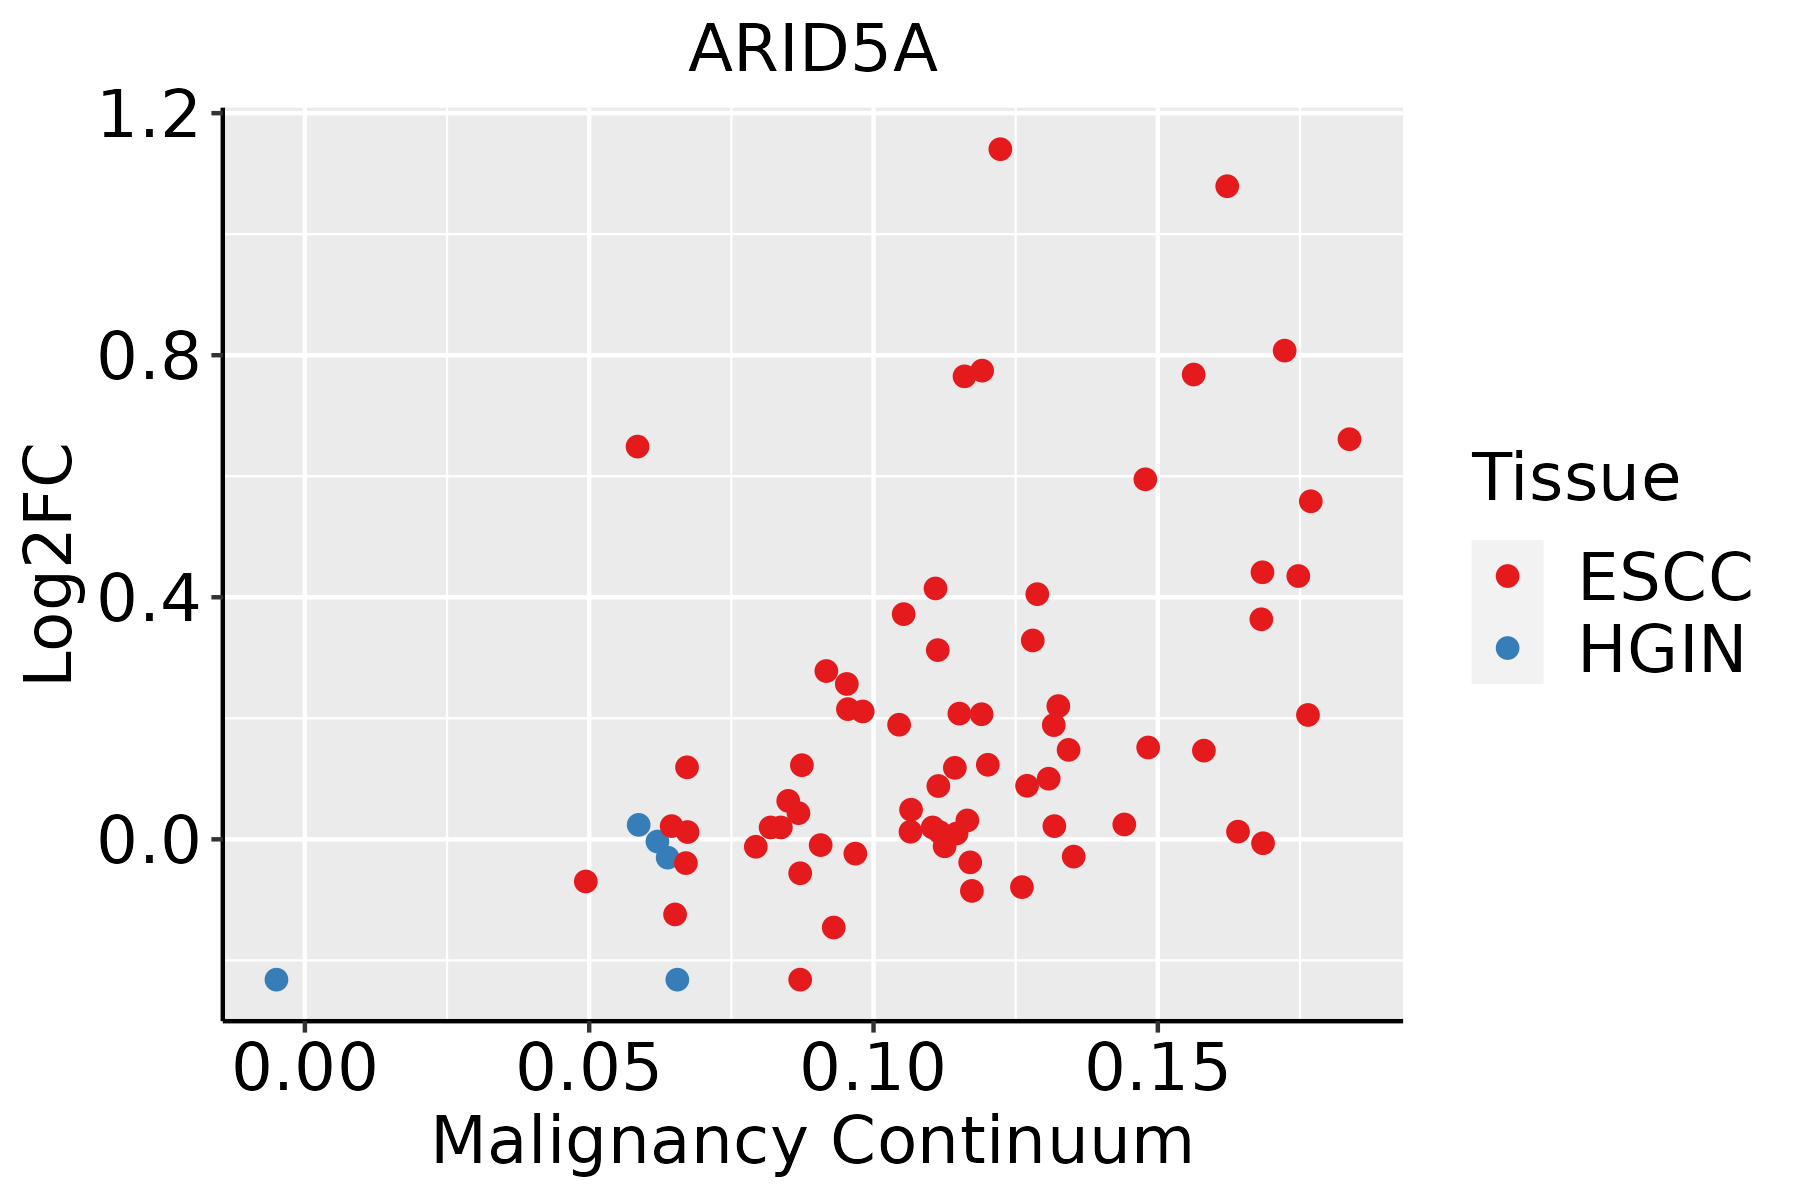 | ESCC: Esophageal squamous cell carcinoma |
| HGIN: High-grade intraepithelial neoplasias | ||
| LGIN: Low-grade intraepithelial neoplasias | ||
| Oral Cavity | 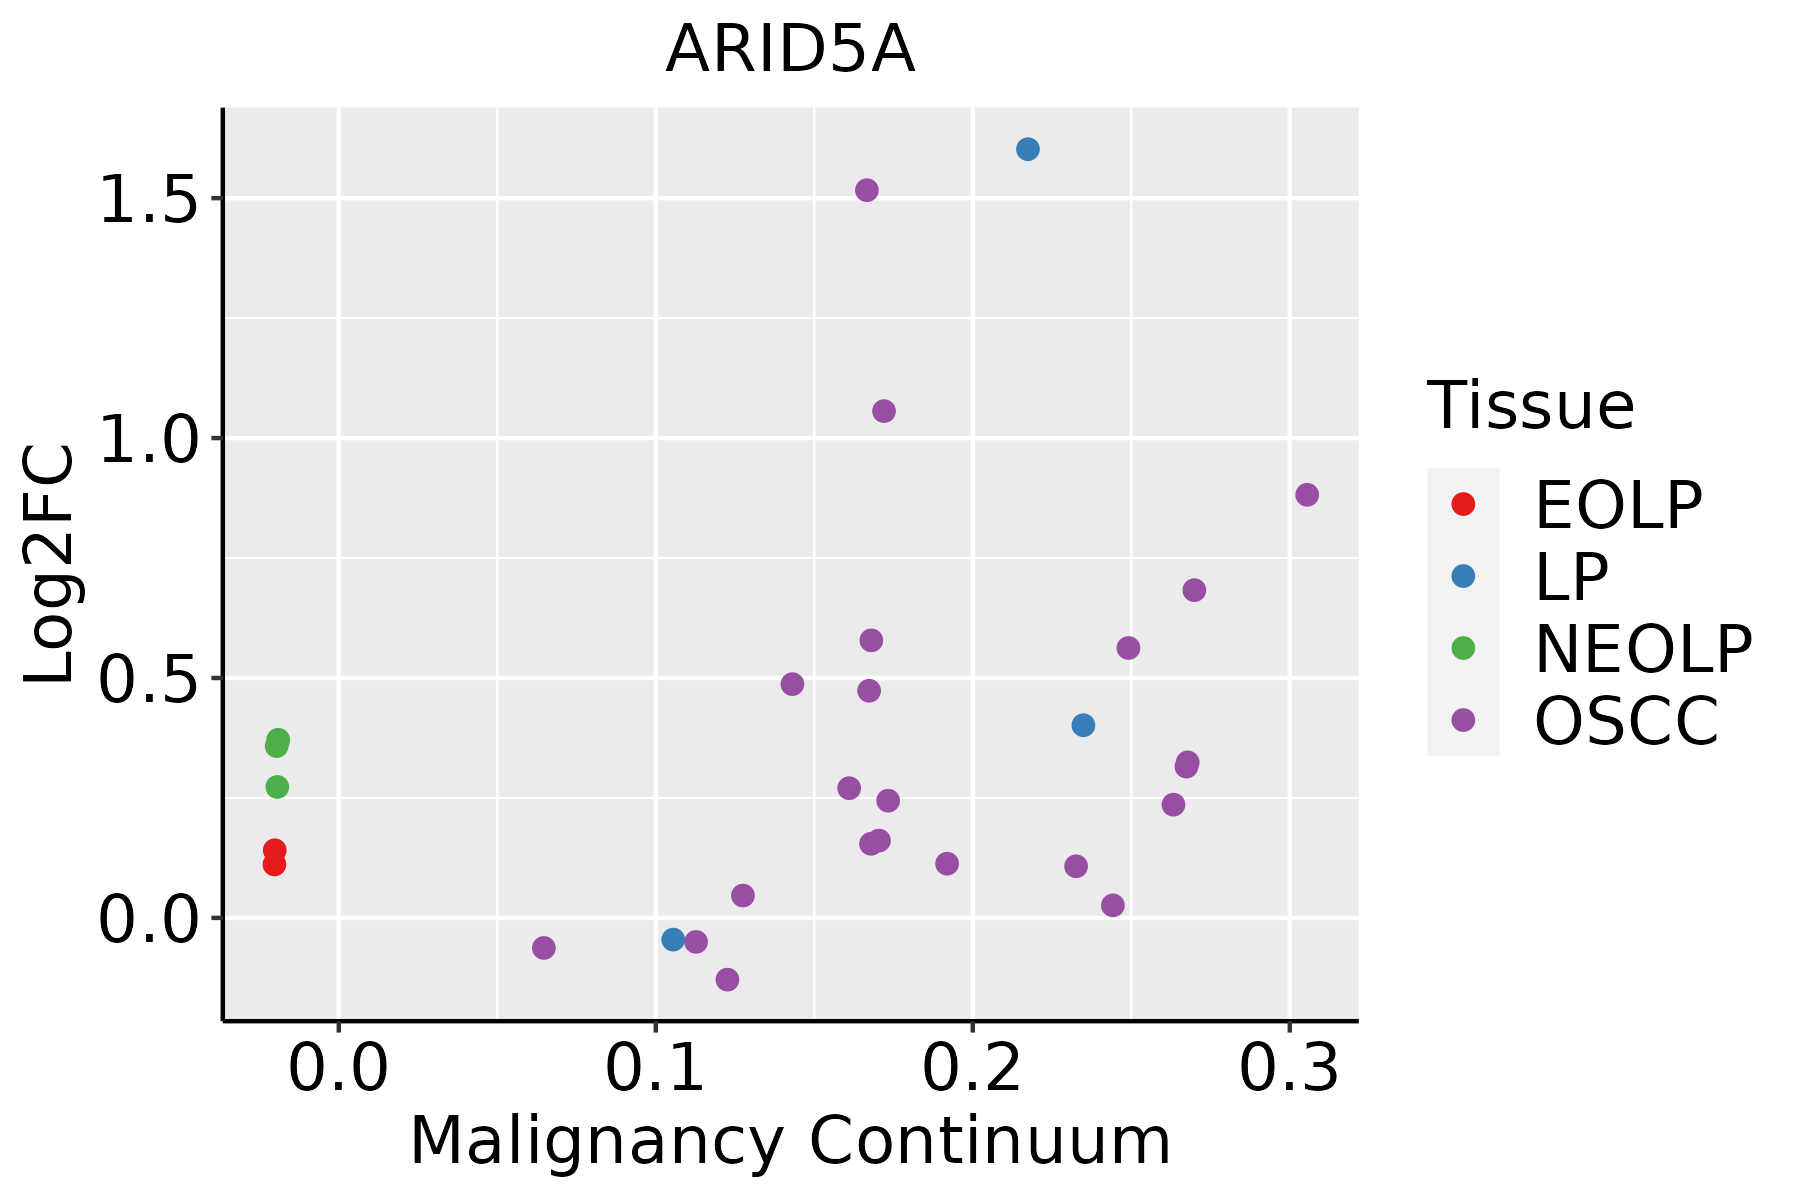 | EOLP: Erosive Oral lichen planus |
| LP: leukoplakia | ||
| NEOLP: Non-erosive oral lichen planus | ||
| OSCC: Oral squamous cell carcinoma |
| ∗log2FC in expression of this searched gene in stem-like cells from each diseased tissue sample relative to stem-like cells in normal samples in each tissue plotted against the malignancy continuum. Samples are colored based on if they are from different disease stage. |
Top |
Malignant transformation related pathway analysis |
| Find out the enriched GO biological processes and KEGG pathways involved in transition from healthy to precancer to cancer |
| Tissue | Disease Stage | Enriched GO biological Processes |
| Colorectum | AD |  |
| Colorectum | SER |  |
| Colorectum | MSS |  |
| Colorectum | MSI-H |  |
| Colorectum | FAP |  |
| ∗Top 15 enriched GO BP terms are showed in the bar plot of each disease state in each tissue. Each row represents a significant GO biological process which is colored according to the -log10(p.adjust). |
| Page: 1 2 3 4 5 6 7 8 9 |
| GO ID | Tissue | Disease Stage | Description | Gene Ratio | Bg Ratio | pvalue | p.adjust | Count |
| GO:00436273 | Breast | Precancer | response to estrogen | 15/1080 | 75/18723 | 2.06e-05 | 4.83e-04 | 15 |
| GO:004362711 | Breast | IDC | response to estrogen | 17/1434 | 75/18723 | 4.05e-05 | 9.25e-04 | 17 |
| GO:0071391 | Breast | IDC | cellular response to estrogen stimulus | 5/1434 | 16/18723 | 5.59e-03 | 4.07e-02 | 5 |
| GO:00436272 | Breast | DCIS | response to estrogen | 16/1390 | 75/18723 | 1.01e-04 | 1.84e-03 | 16 |
| GO:00436275 | Esophagus | ESCC | response to estrogen | 45/8552 | 75/18723 | 8.75e-03 | 3.08e-02 | 45 |
| Page: 1 |
| Pathway ID | Tissue | Disease Stage | Description | Gene Ratio | Bg Ratio | pvalue | p.adjust | qvalue | Count |
| Page: 1 |
Top |
Cell-cell communication analysis |
| Identification of potential cell-cell interactions between two cell types and their ligand-receptor pairs for different disease states |
| Ligand | Receptor | LRpair | Pathway | Tissue | Disease Stage |
| Page: 1 |
Top |
Single-cell gene regulatory network inference analysis |
| Find out the significant the regulons (TFs) and the target genes of each regulon across cell types for different disease states |
| TF | Cell Type | Tissue | Disease Stage | Target Gene | RSS | Regulon Activity |
| ARID5A | PANIN | Pancreas | Healthy | COA8,RAP1B,MTMR10, etc. | 2.12e-01 |  |
| ARID5A | CD8TEXP | Stomach | ADJ | TMEM66,CREM,GTF2F2, etc. | 3.75e-02 |  |
| ARID5A | GC | Stomach | CAG | TMEM66,CREM,GTF2F2, etc. | 1.44e-02 |  |
| ARID5A | CD8TEXP | Stomach | GC | TMEM66,CREM,GTF2F2, etc. | 1.58e-01 |  |
| ARID5A | NK | Stomach | SIM | TMEM66,CREM,GTF2F2, etc. | 8.48e-02 |  |
| ARID5A | BN | Stomach | SIM | TMEM66,CREM,GTF2F2, etc. | 1.93e-02 | |
| ARID5A | CD8TEREX | Stomach | WIM | TMEM66,CREM,GTF2F2, etc. | 8.05e-02 |  |
| ARID5A | PTC | Thyroid | goiters | SOX17,EPAS1,PECAM1, etc. | 2.18e-01 |  |
| ∗The dot plots of a searched regulon are shown for all cell subpopulations in each disease state of each tissue based on the regulon specific score inferred using pySCENIC and by calculating the average expression. |
| Page: 1 |
Top |
Somatic mutation of malignant transformation related genes |
| Annotation of somatic variants for genes involved in malignant transformation |
| Hugo Symbol | Variant Class | Variant Classification | dbSNP RS | HGVSc | HGVSp | HGVSp Short | SWISSPROT | BIOTYPE | SIFT | PolyPhen | Tumor Sample Barcode | Tissue | Histology | Sex | Age | Stage | Therapy Types | Drugs | Outcome |
| ARID5A | SNV | Missense_Mutation | c.1589T>A | p.Val530Asp | p.V530D | Q03989 | protein_coding | deleterious(0) | benign(0.274) | TCGA-A8-A085-01 | Breast | breast invasive carcinoma | Male | <65 | I/II | Hormone Therapy | tamoxiphen | SD | |
| ARID5A | insertion | In_Frame_Ins | novel | c.245_246insCAAAACCTC | p.Leu82_Gly83insLysThrSer | p.L82_G83insKTS | Q03989 | protein_coding | TCGA-AN-A0FN-01 | Breast | breast invasive carcinoma | Female | <65 | I/II | Unknown | Unknown | SD | ||
| ARID5A | insertion | Frame_Shift_Ins | novel | c.247_248insGAGA | p.Phe84GlufsTer6 | p.F84Efs*6 | Q03989 | protein_coding | TCGA-AN-A0FN-01 | Breast | breast invasive carcinoma | Female | <65 | I/II | Unknown | Unknown | SD | ||
| ARID5A | deletion | Frame_Shift_Del | novel | c.770delC | p.Pro257HisfsTer11 | p.P257Hfs*11 | Q03989 | protein_coding | TCGA-D8-A27V-01 | Breast | breast invasive carcinoma | Female | <65 | I/II | Hormone Therapy | tamoxiphen | SD | ||
| ARID5A | SNV | Missense_Mutation | novel | c.1007C>T | p.Ala336Val | p.A336V | Q03989 | protein_coding | tolerated(0.1) | benign(0.039) | TCGA-2W-A8YY-01 | Cervix | cervical & endocervical cancer | Female | <65 | I/II | Chemotherapy | cisplatin | CR |
| ARID5A | SNV | Missense_Mutation | novel | c.1411G>A | p.Ala471Thr | p.A471T | Q03989 | protein_coding | tolerated(0.46) | benign(0.01) | TCGA-2W-A8YY-01 | Cervix | cervical & endocervical cancer | Female | <65 | I/II | Chemotherapy | cisplatin | CR |
| ARID5A | SNV | Missense_Mutation | c.1190N>T | p.Ser397Phe | p.S397F | Q03989 | protein_coding | deleterious(0) | probably_damaging(0.996) | TCGA-C5-A1BQ-01 | Cervix | cervical & endocervical cancer | Female | >=65 | III/IV | Chemotherapy | cisplatin | CR | |
| ARID5A | SNV | Missense_Mutation | c.834N>C | p.Glu278Asp | p.E278D | Q03989 | protein_coding | tolerated(0.07) | benign(0.237) | TCGA-4N-A93T-01 | Colorectum | colon adenocarcinoma | Male | >=65 | III/IV | Chemotherapy | xeloda | SD | |
| ARID5A | SNV | Missense_Mutation | rs753830076 | c.229G>A | p.Glu77Lys | p.E77K | Q03989 | protein_coding | deleterious(0) | benign(0.08) | TCGA-AA-3502-01 | Colorectum | colon adenocarcinoma | Male | >=65 | I/II | Unknown | Unknown | SD |
| ARID5A | SNV | Missense_Mutation | c.1276G>A | p.Ala426Thr | p.A426T | Q03989 | protein_coding | tolerated(0.42) | benign(0.007) | TCGA-AD-5900-01 | Colorectum | colon adenocarcinoma | Male | >=65 | I/II | Unknown | Unknown | SD |
| Page: 1 2 3 4 5 |
Top |
Related drugs of malignant transformation related genes |
| Identification of chemicals and drugs interact with genes involved in malignant transfromation |
| (DGIdb 4.0) |
| Entrez ID | Symbol | Category | Interaction Types | Drug Claim Name | Drug Name | PMIDs |
| Page: 1 |

Copyright 2023-Present -The University of Texas Health Science Center at Houston |