
|
|||||
|
 | |
| |
| |
| |
| |
| |
|
Gene: ARID4B |
Gene summary for ARID4B |
| Gene information | Species | Human | Gene symbol | ARID4B | Gene ID | 51742 |
| Gene name | AT-rich interaction domain 4B | |
| Gene Alias | BCAA | |
| Cytomap | 1q42.3 | |
| Gene Type | protein-coding | GO ID | GO:0006139 | UniProtAcc | A0A024R3R1 |
Top |
Malignant transformation analysis |
| Identification of the aberrant gene expression in precancerous and cancerous lesions by comparing the gene expression of stem-like cells in diseased tissues with normal stem cells |
| Entrez ID | Symbol | Replicates | Species | Organ | Tissue | Adj P-value | Log2FC | Malignancy |
| 51742 | ARID4B | CA_HPV_1 | Human | Cervix | CC | 3.99e-03 | -5.06e-04 | 0.0264 |
| 51742 | ARID4B | CCI_1 | Human | Cervix | CC | 2.51e-13 | 1.36e+00 | 0.528 |
| 51742 | ARID4B | CCI_2 | Human | Cervix | CC | 6.83e-07 | 1.31e+00 | 0.5249 |
| 51742 | ARID4B | CCI_3 | Human | Cervix | CC | 8.98e-18 | 1.39e+00 | 0.516 |
| 51742 | ARID4B | L1 | Human | Cervix | CC | 1.13e-03 | -8.23e-02 | 0.0802 |
| 51742 | ARID4B | AEH-subject1 | Human | Endometrium | AEH | 8.03e-19 | 4.68e-01 | -0.3059 |
| 51742 | ARID4B | AEH-subject2 | Human | Endometrium | AEH | 6.12e-15 | 2.21e-01 | -0.2525 |
| 51742 | ARID4B | AEH-subject3 | Human | Endometrium | AEH | 5.52e-13 | 2.42e-01 | -0.2576 |
| 51742 | ARID4B | AEH-subject4 | Human | Endometrium | AEH | 1.48e-25 | 5.37e-01 | -0.2657 |
| 51742 | ARID4B | AEH-subject5 | Human | Endometrium | AEH | 1.36e-21 | 5.60e-01 | -0.2953 |
| 51742 | ARID4B | EEC-subject1 | Human | Endometrium | EEC | 2.96e-29 | 5.08e-01 | -0.2682 |
| 51742 | ARID4B | EEC-subject2 | Human | Endometrium | EEC | 1.29e-07 | 2.26e-01 | -0.2607 |
| 51742 | ARID4B | EEC-subject3 | Human | Endometrium | EEC | 2.03e-50 | 3.62e-01 | -0.2525 |
| 51742 | ARID4B | EEC-subject4 | Human | Endometrium | EEC | 2.69e-12 | 3.24e-01 | -0.2571 |
| 51742 | ARID4B | EEC-subject5 | Human | Endometrium | EEC | 1.88e-10 | 2.50e-01 | -0.249 |
| 51742 | ARID4B | GSM5276934 | Human | Endometrium | EEC | 6.49e-03 | 2.86e-02 | -0.0913 |
| 51742 | ARID4B | GSM5276935 | Human | Endometrium | EEC | 7.65e-04 | 3.51e-01 | -0.123 |
| 51742 | ARID4B | GSM6177620_NYU_UCEC1_lib1_lib1 | Human | Endometrium | EEC | 1.56e-29 | -1.45e-01 | -0.1869 |
| 51742 | ARID4B | GSM6177620_NYU_UCEC1_lib2_lib2 | Human | Endometrium | EEC | 1.55e-30 | -2.23e-01 | -0.1875 |
| 51742 | ARID4B | GSM6177620_NYU_UCEC1_lib3_lib3 | Human | Endometrium | EEC | 1.87e-32 | -1.45e-01 | -0.1883 |
| Page: 1 2 3 4 5 6 7 8 9 10 11 |
| Tissue | Expression Dynamics | Abbreviation |
| Cervix | 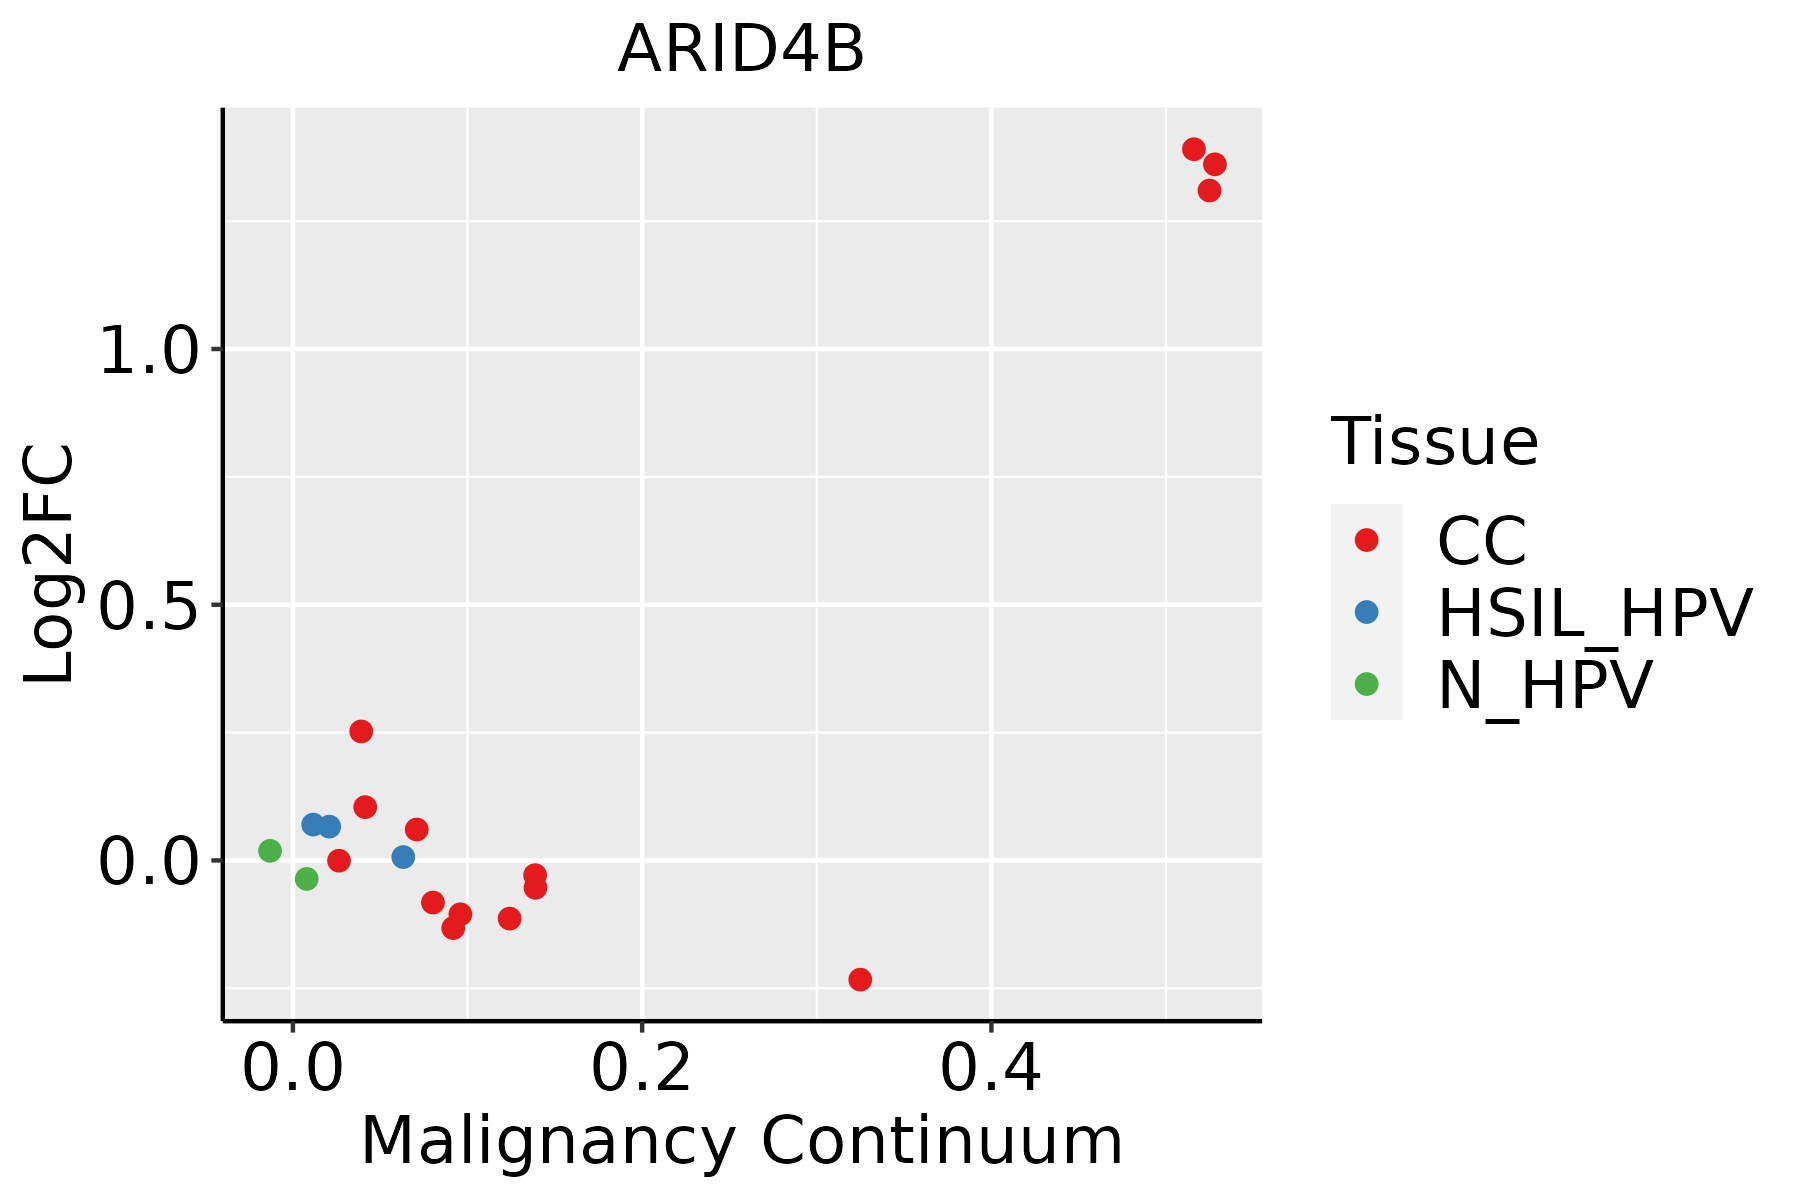 | CC: Cervix cancer |
| HSIL_HPV: HPV-infected high-grade squamous intraepithelial lesions | ||
| N_HPV: HPV-infected normal cervix | ||
| Endometrium | 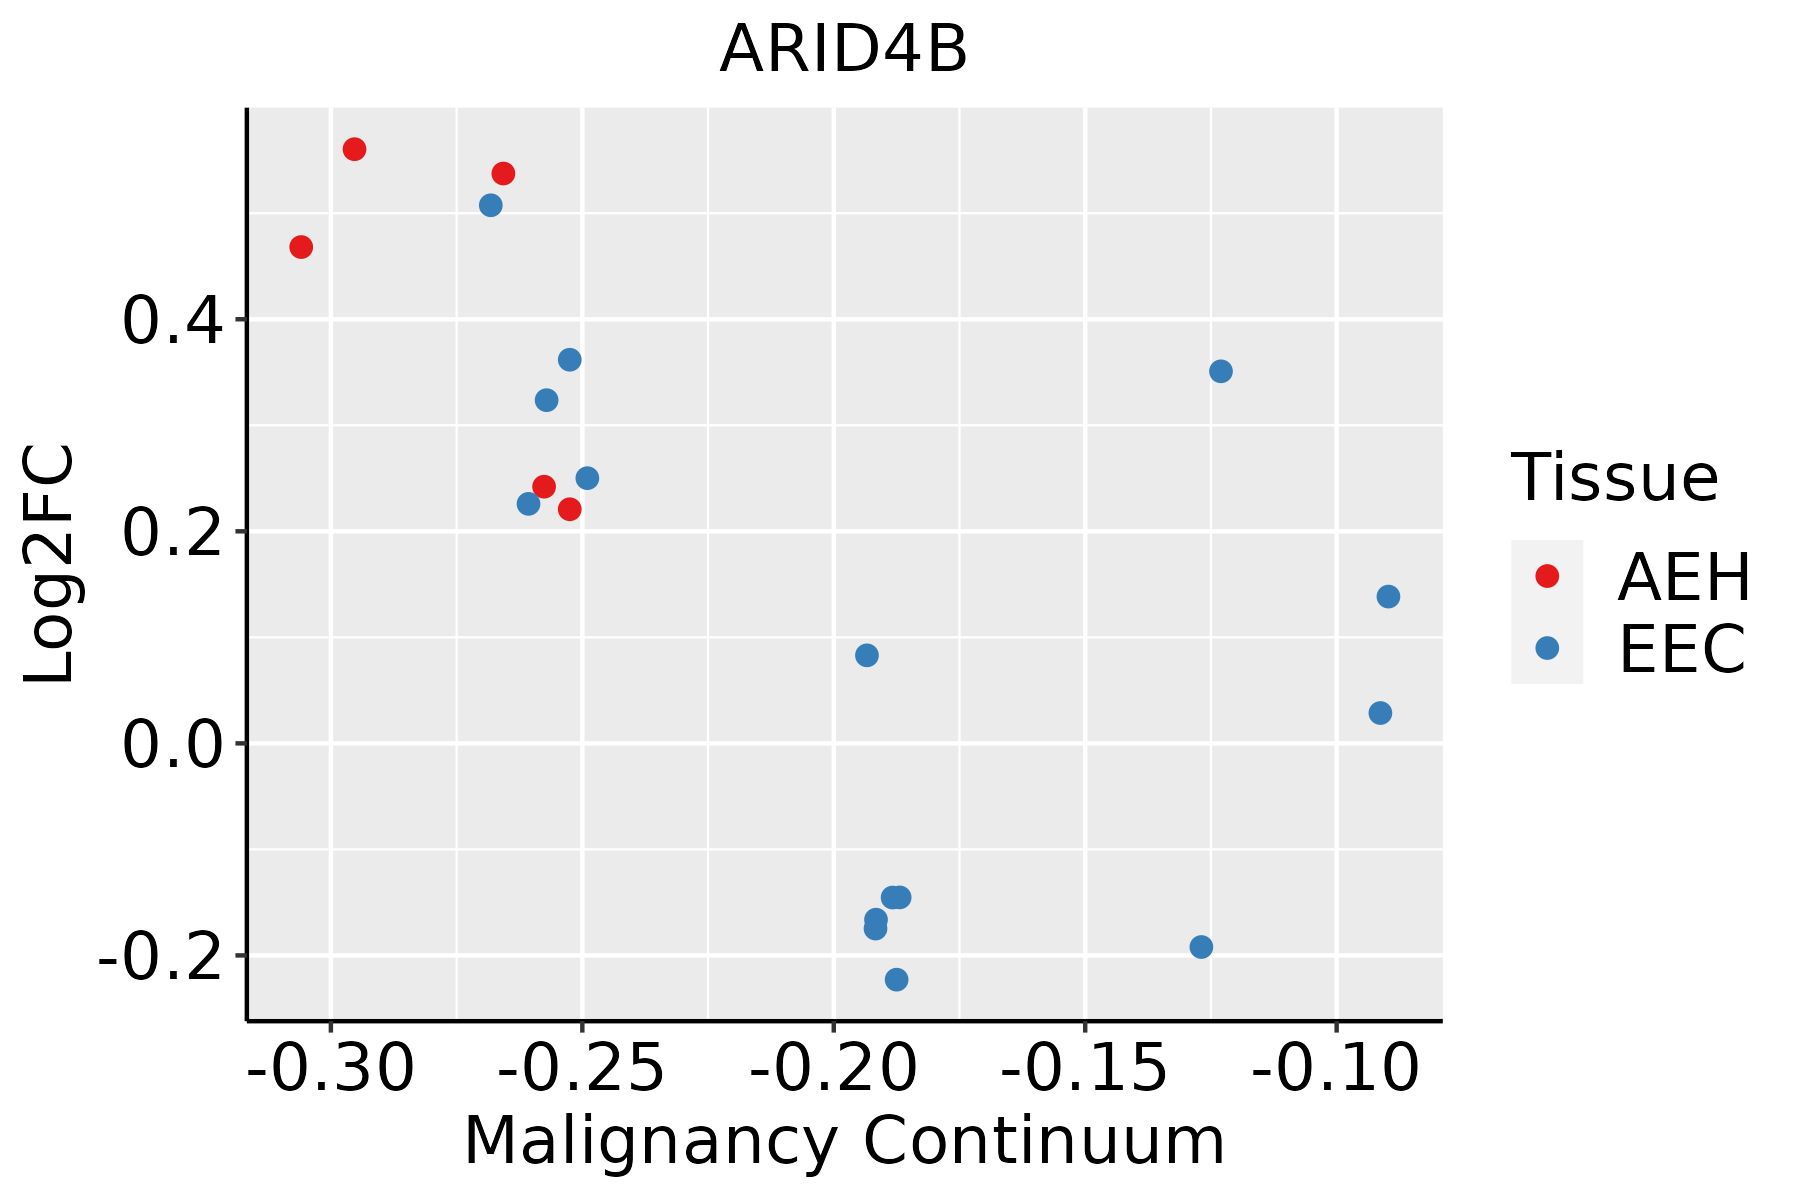 | AEH: Atypical endometrial hyperplasia |
| EEC: Endometrioid Cancer | ||
| Esophagus | 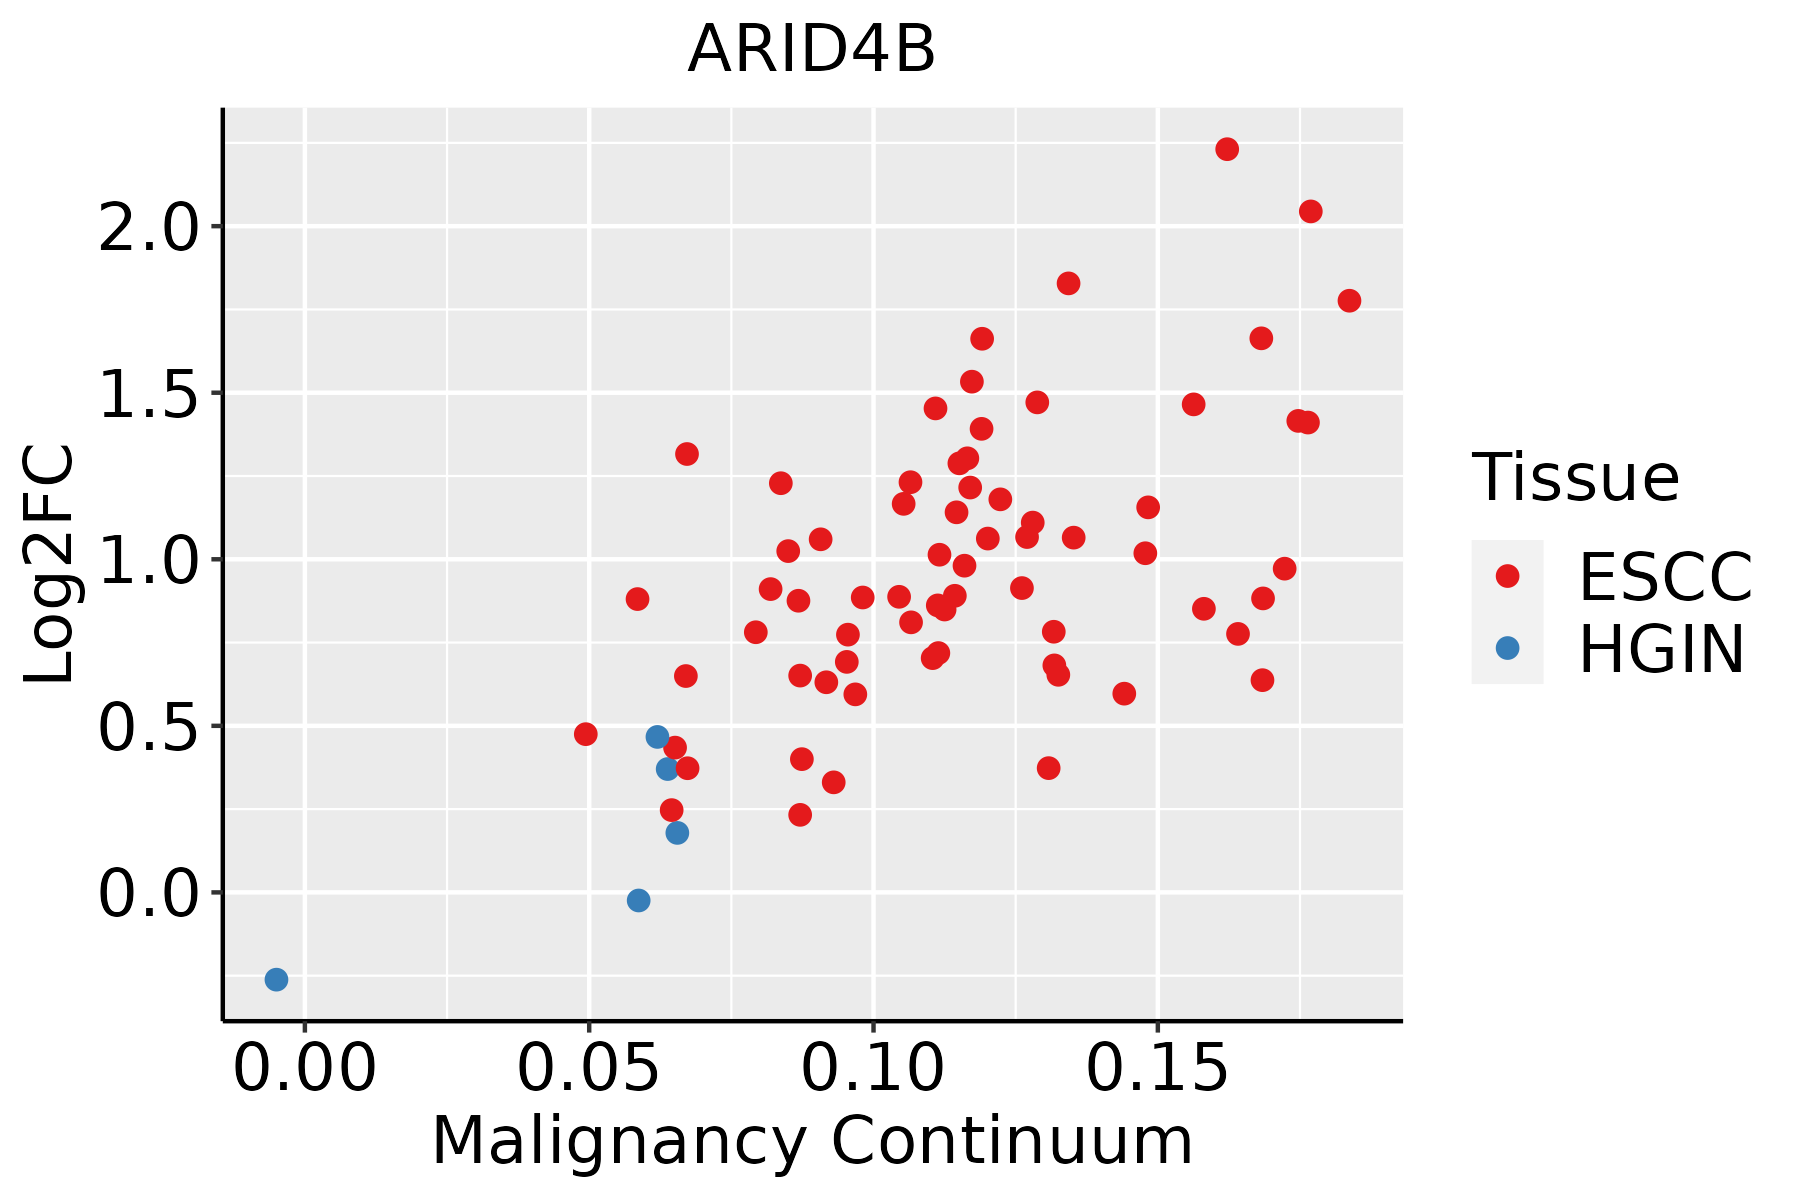 | ESCC: Esophageal squamous cell carcinoma |
| HGIN: High-grade intraepithelial neoplasias | ||
| LGIN: Low-grade intraepithelial neoplasias | ||
| Liver | 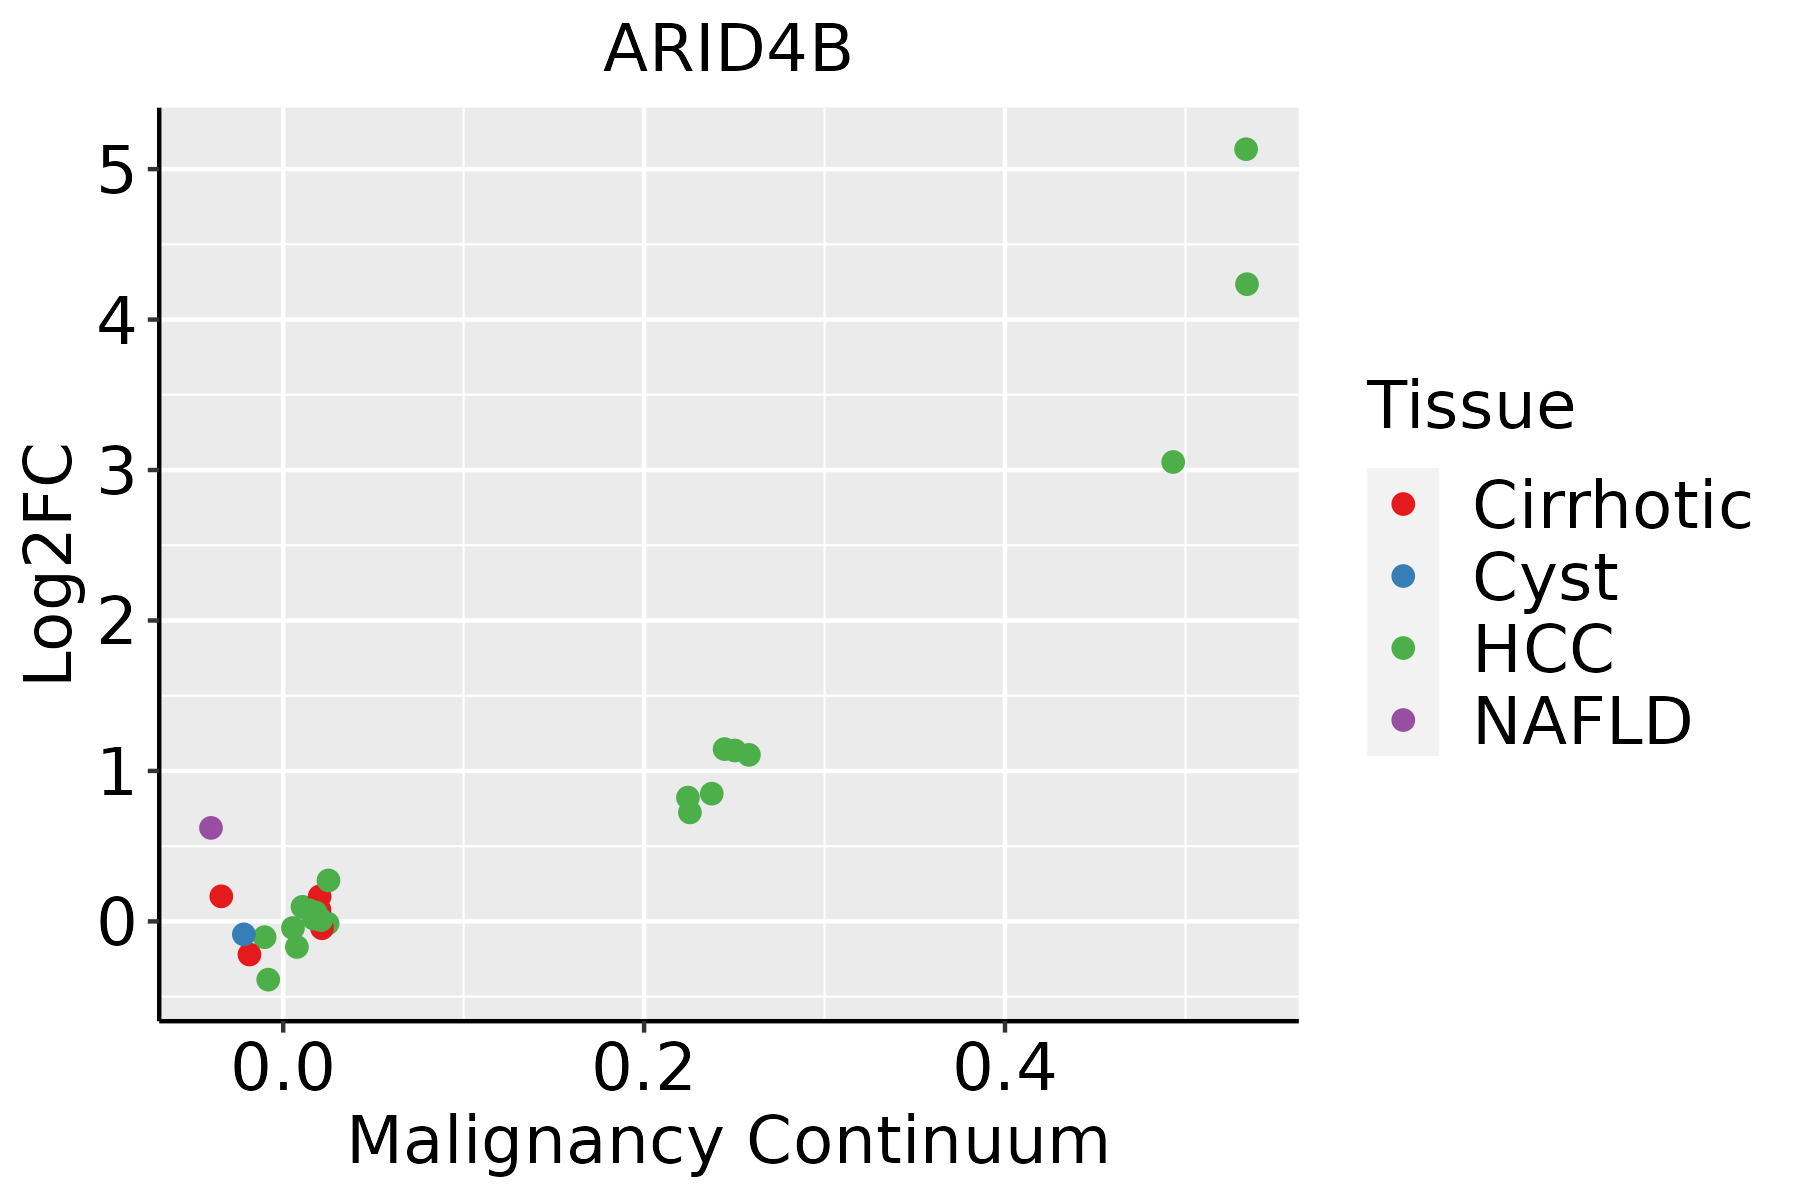 | HCC: Hepatocellular carcinoma |
| NAFLD: Non-alcoholic fatty liver disease | ||
| Lung | 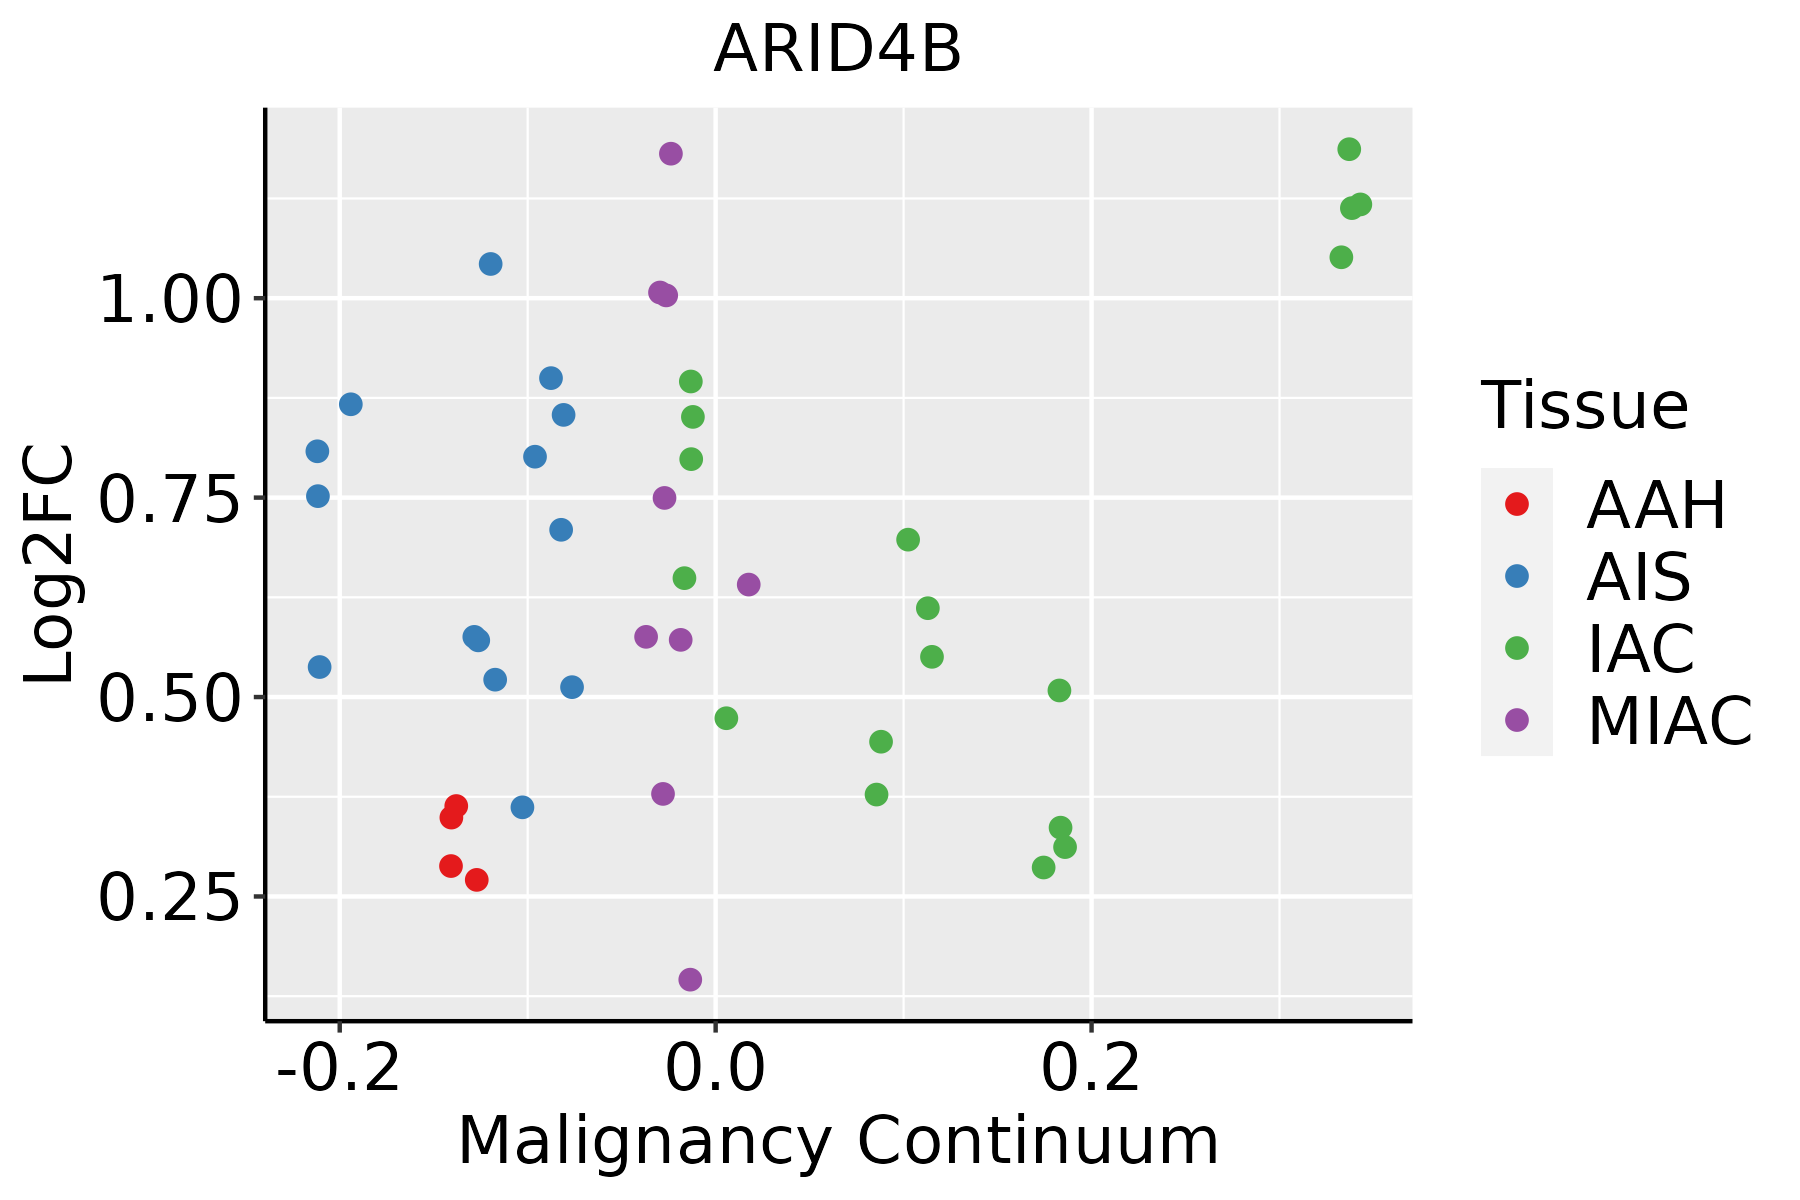 | AAH: Atypical adenomatous hyperplasia |
| AIS: Adenocarcinoma in situ | ||
| IAC: Invasive lung adenocarcinoma | ||
| MIA: Minimally invasive adenocarcinoma | ||
| Oral Cavity | 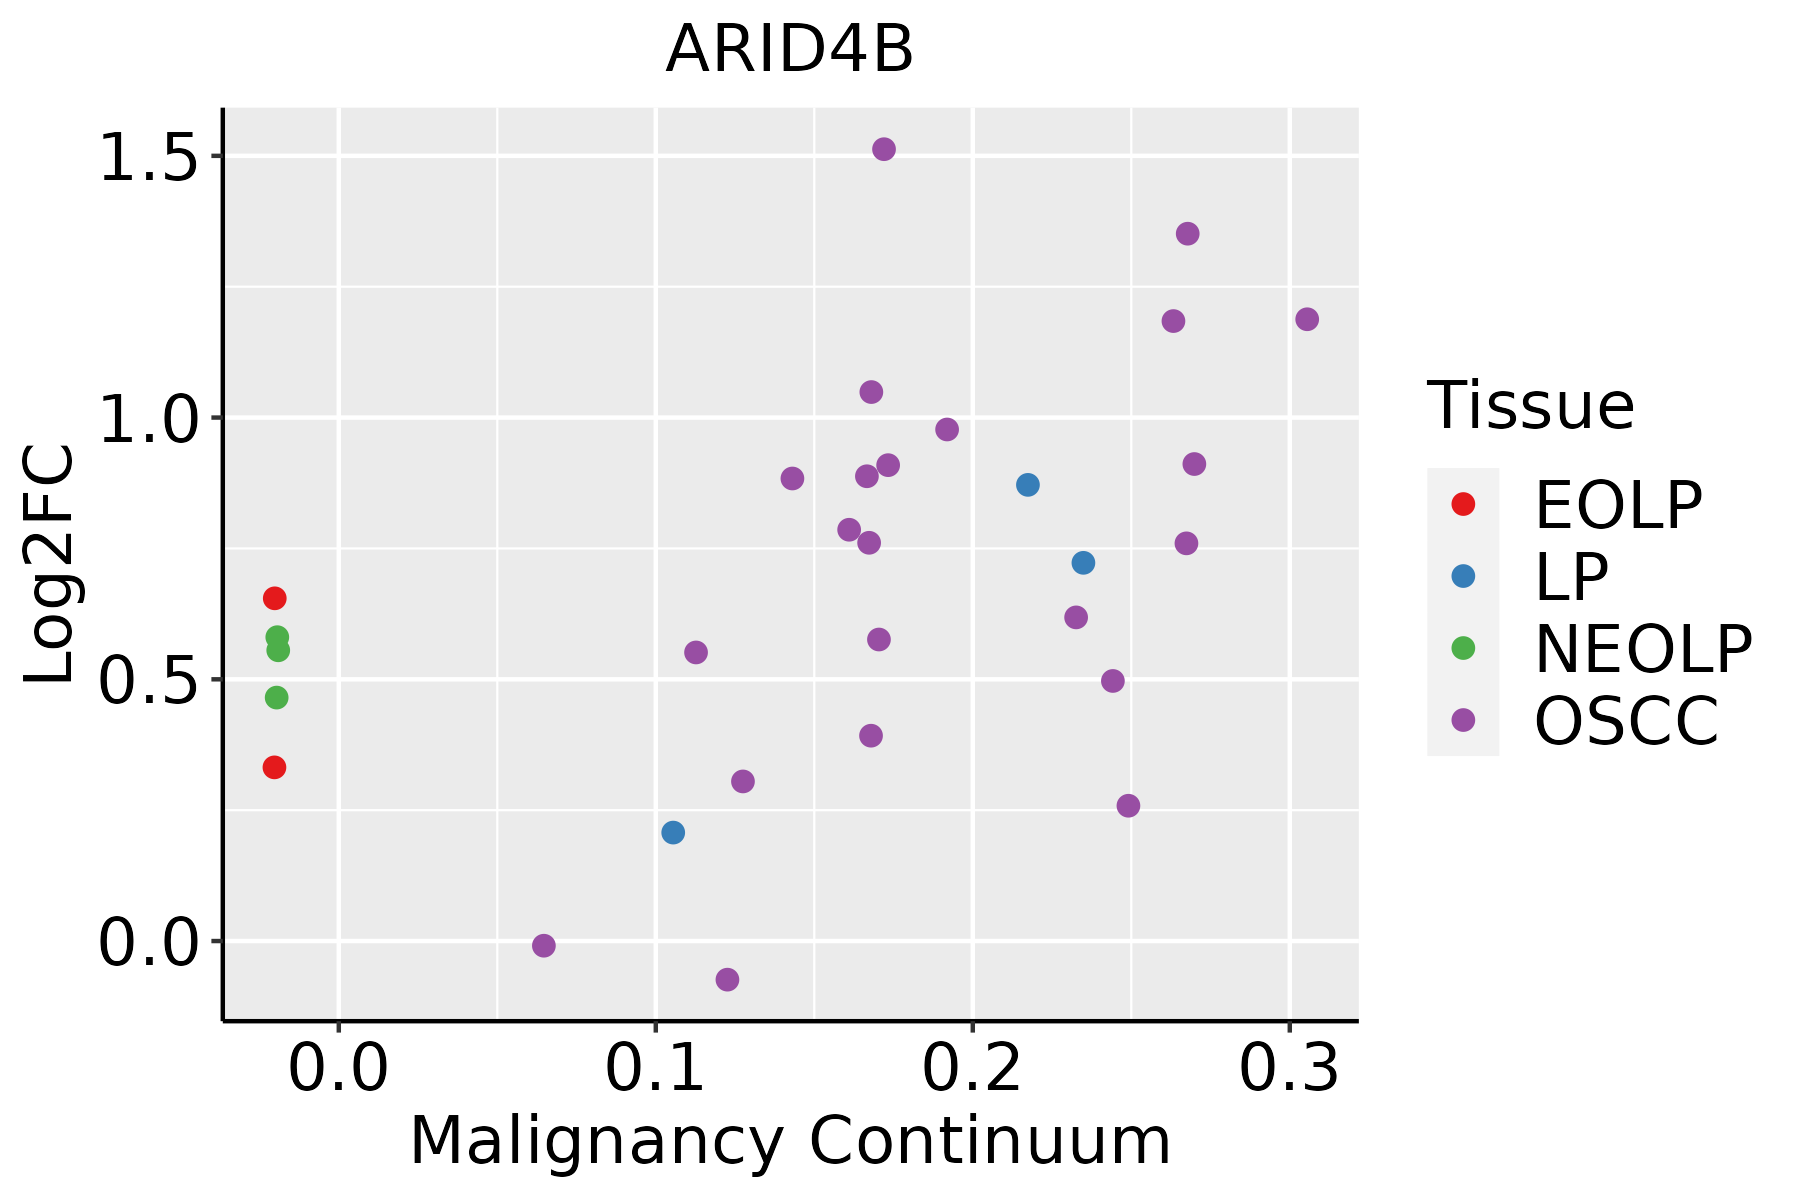 | EOLP: Erosive Oral lichen planus |
| LP: leukoplakia | ||
| NEOLP: Non-erosive oral lichen planus | ||
| OSCC: Oral squamous cell carcinoma | ||
| Prostate | 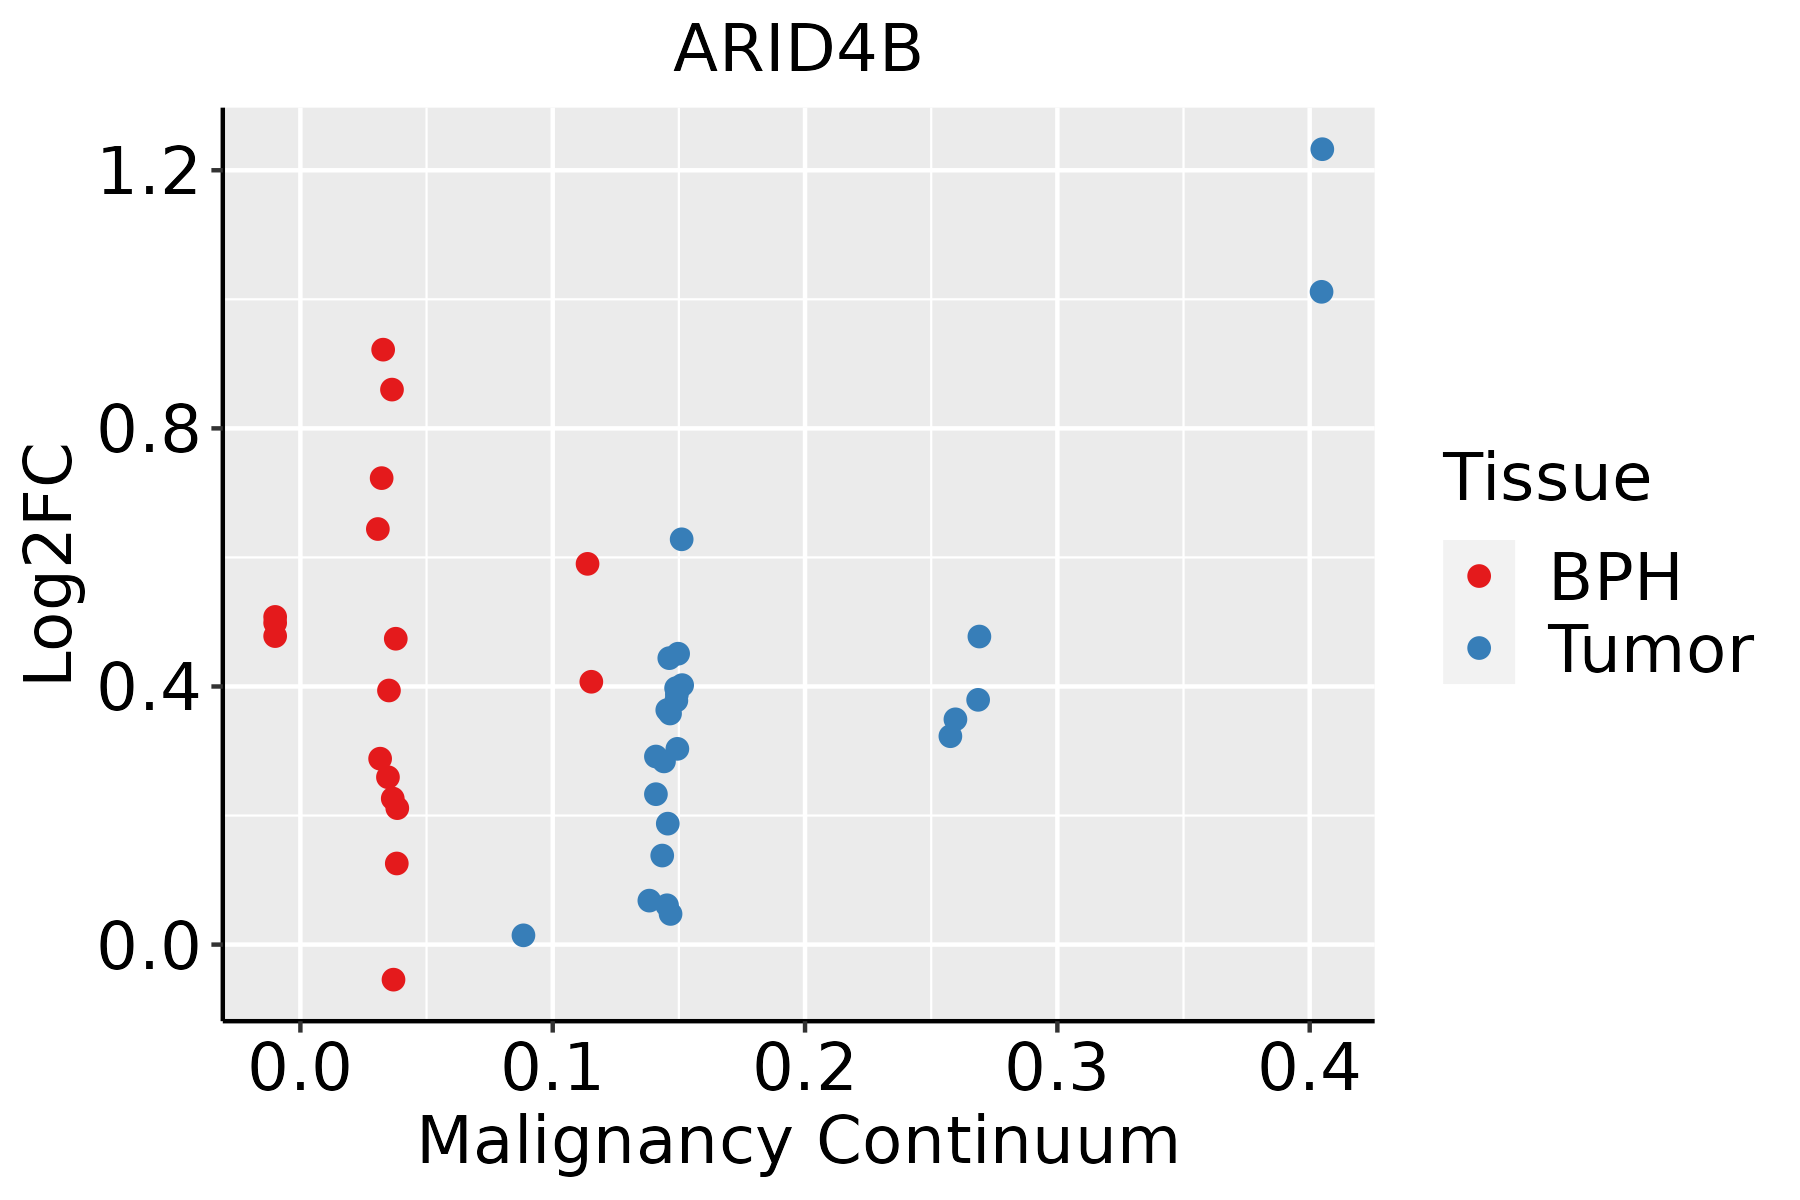 | BPH: Benign Prostatic Hyperplasia |
| Skin |  | AK: Actinic keratosis |
| cSCC: Cutaneous squamous cell carcinoma | ||
| SCCIS:squamous cell carcinoma in situ | ||
| Thyroid | 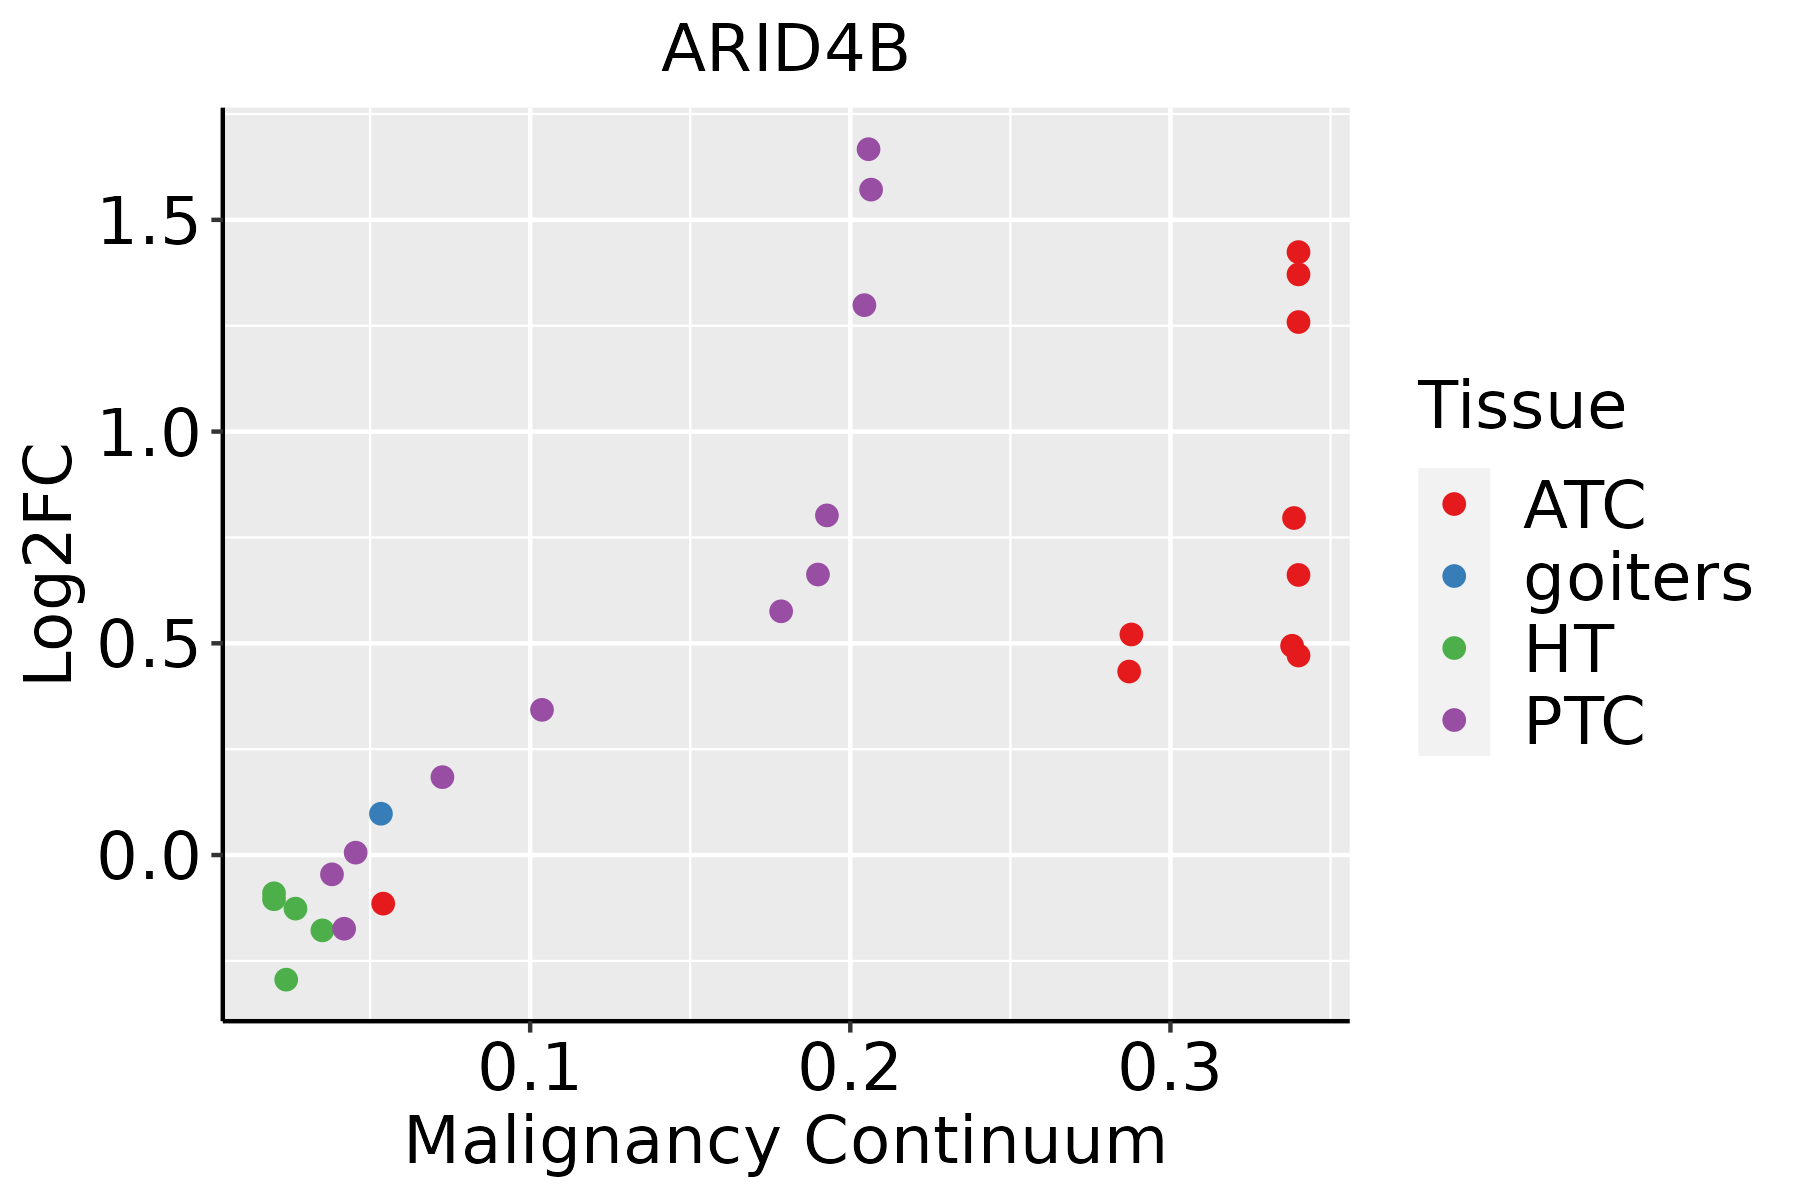 | ATC: Anaplastic thyroid cancer |
| HT: Hashimoto's thyroiditis | ||
| PTC: Papillary thyroid cancer |
| ∗log2FC in expression of this searched gene in stem-like cells from each diseased tissue sample relative to stem-like cells in normal samples in each tissue plotted against the malignancy continuum. Samples are colored based on if they are from different disease stage. |
Top |
Malignant transformation related pathway analysis |
| Find out the enriched GO biological processes and KEGG pathways involved in transition from healthy to precancer to cancer |
| Tissue | Disease Stage | Enriched GO biological Processes |
| Colorectum | AD |  |
| Colorectum | SER |  |
| Colorectum | MSS |  |
| Colorectum | MSI-H |  |
| Colorectum | FAP |  |
| ∗Top 15 enriched GO BP terms are showed in the bar plot of each disease state in each tissue. Each row represents a significant GO biological process which is colored according to the -log10(p.adjust). |
| Page: 1 2 3 4 5 6 7 8 9 |
| GO ID | Tissue | Disease Stage | Description | Gene Ratio | Bg Ratio | pvalue | p.adjust | Count |
| GO:00063257 | Cervix | CC | chromatin organization | 78/2311 | 409/18723 | 5.40e-05 | 8.02e-04 | 78 |
| GO:00063258 | Endometrium | AEH | chromatin organization | 64/2100 | 409/18723 | 3.69e-03 | 2.52e-02 | 64 |
| GO:000632513 | Endometrium | EEC | chromatin organization | 65/2168 | 409/18723 | 4.98e-03 | 3.14e-02 | 65 |
| GO:000632516 | Esophagus | HGIN | chromatin organization | 92/2587 | 409/18723 | 1.05e-06 | 4.16e-05 | 92 |
| GO:000632517 | Esophagus | ESCC | chromatin organization | 240/8552 | 409/18723 | 6.52e-08 | 1.14e-06 | 240 |
| GO:00063255 | Liver | NAFLD | chromatin organization | 64/1882 | 409/18723 | 2.31e-04 | 3.89e-03 | 64 |
| GO:000632511 | Liver | HCC | chromatin organization | 206/7958 | 409/18723 | 7.23e-04 | 4.41e-03 | 206 |
| GO:00063256 | Lung | IAC | chromatin organization | 69/2061 | 409/18723 | 2.01e-04 | 3.53e-03 | 69 |
| GO:000632512 | Lung | AIS | chromatin organization | 62/1849 | 409/18723 | 4.24e-04 | 7.29e-03 | 62 |
| GO:000632510 | Oral cavity | OSCC | chromatin organization | 190/7305 | 409/18723 | 1.17e-03 | 5.97e-03 | 190 |
| GO:000632515 | Oral cavity | EOLP | chromatin organization | 84/2218 | 409/18723 | 2.68e-07 | 8.16e-06 | 84 |
| GO:000632521 | Oral cavity | NEOLP | chromatin organization | 70/2005 | 409/18723 | 4.97e-05 | 6.83e-04 | 70 |
| GO:00063259 | Prostate | BPH | chromatin organization | 101/3107 | 409/18723 | 1.52e-05 | 1.94e-04 | 101 |
| GO:000632514 | Prostate | Tumor | chromatin organization | 104/3246 | 409/18723 | 2.02e-05 | 2.62e-04 | 104 |
| GO:000632518 | Skin | AK | chromatin organization | 73/1910 | 409/18723 | 1.40e-06 | 4.26e-05 | 73 |
| GO:000632519 | Skin | cSCC | chromatin organization | 147/4864 | 409/18723 | 4.41e-06 | 6.52e-05 | 147 |
| GO:000632520 | Thyroid | PTC | chromatin organization | 183/5968 | 409/18723 | 2.55e-08 | 5.70e-07 | 183 |
| GO:0006325110 | Thyroid | ATC | chromatin organization | 189/6293 | 409/18723 | 6.40e-08 | 1.13e-06 | 189 |
| Page: 1 |
| Pathway ID | Tissue | Disease Stage | Description | Gene Ratio | Bg Ratio | pvalue | p.adjust | qvalue | Count |
| Page: 1 |
Top |
Cell-cell communication analysis |
| Identification of potential cell-cell interactions between two cell types and their ligand-receptor pairs for different disease states |
| Ligand | Receptor | LRpair | Pathway | Tissue | Disease Stage |
| Page: 1 |
Top |
Single-cell gene regulatory network inference analysis |
| Find out the significant the regulons (TFs) and the target genes of each regulon across cell types for different disease states |
| TF | Cell Type | Tissue | Disease Stage | Target Gene | RSS | Regulon Activity |
| ∗The dot plots of a searched regulon are shown for all cell subpopulations in each disease state of each tissue based on the regulon specific score inferred using pySCENIC and by calculating the average expression. |
| Page: 1 |
Top |
Somatic mutation of malignant transformation related genes |
| Annotation of somatic variants for genes involved in malignant transformation |
| Hugo Symbol | Variant Class | Variant Classification | dbSNP RS | HGVSc | HGVSp | HGVSp Short | SWISSPROT | BIOTYPE | SIFT | PolyPhen | Tumor Sample Barcode | Tissue | Histology | Sex | Age | Stage | Therapy Types | Drugs | Outcome |
| ARID4B | SNV | Missense_Mutation | c.2812N>C | p.Lys938Gln | p.K938Q | Q4LE39 | protein_coding | deleterious_low_confidence(0) | probably_damaging(0.977) | TCGA-A7-A13D-01 | Breast | breast invasive carcinoma | Female | <65 | I/II | Chemotherapy | cytoxan | SD | |
| ARID4B | SNV | Missense_Mutation | novel | c.2794N>G | p.Gln932Glu | p.Q932E | Q4LE39 | protein_coding | deleterious_low_confidence(0) | possibly_damaging(0.759) | TCGA-A7-A4SA-01 | Breast | breast invasive carcinoma | Female | <65 | I/II | Chemotherapy | doxorubicin | CR |
| ARID4B | SNV | Missense_Mutation | rs756689001 | c.1967C>G | p.Ser656Cys | p.S656C | Q4LE39 | protein_coding | deleterious(0) | probably_damaging(0.987) | TCGA-A8-A095-01 | Breast | breast invasive carcinoma | Female | <65 | I/II | Chemotherapy | 5-fluorouracil | CR |
| ARID4B | SNV | Missense_Mutation | novel | c.3923N>T | p.Ser1308Leu | p.S1308L | Q4LE39 | protein_coding | deleterious_low_confidence(0) | possibly_damaging(0.725) | TCGA-A8-A0A7-01 | Breast | breast invasive carcinoma | Female | <65 | I/II | Unknown | Unknown | SD |
| ARID4B | SNV | Missense_Mutation | novel | c.2371G>A | p.Glu791Lys | p.E791K | Q4LE39 | protein_coding | deleterious_low_confidence(0.04) | benign(0.06) | TCGA-AN-A046-01 | Breast | breast invasive carcinoma | Female | >=65 | I/II | Unknown | Unknown | SD |
| ARID4B | SNV | Missense_Mutation | c.2161N>C | p.Asp721His | p.D721H | Q4LE39 | protein_coding | tolerated_low_confidence(0.08) | benign(0.259) | TCGA-AN-A0FW-01 | Breast | breast invasive carcinoma | Female | >=65 | III/IV | Unknown | Unknown | SD | |
| ARID4B | SNV | Missense_Mutation | c.893A>G | p.Glu298Gly | p.E298G | Q4LE39 | protein_coding | deleterious(0.05) | possibly_damaging(0.714) | TCGA-B6-A0I6-01 | Breast | breast invasive carcinoma | Female | <65 | I/II | Unknown | Unknown | PD | |
| ARID4B | SNV | Missense_Mutation | c.3460N>C | p.Asp1154His | p.D1154H | Q4LE39 | protein_coding | deleterious(0.01) | probably_damaging(0.998) | TCGA-BH-A1F8-01 | Breast | breast invasive carcinoma | Female | >=65 | III/IV | Unknown | Unknown | PD | |
| ARID4B | SNV | Missense_Mutation | novel | c.1303N>C | p.Glu435Gln | p.E435Q | Q4LE39 | protein_coding | tolerated(0.37) | benign(0.147) | TCGA-BH-A2L8-01 | Breast | breast invasive carcinoma | Female | <65 | I/II | Chemotherapy | cytoxan | CR |
| ARID4B | SNV | Missense_Mutation | novel | c.2924N>G | p.Glu975Gly | p.E975G | Q4LE39 | protein_coding | tolerated_low_confidence(0.08) | probably_damaging(0.968) | TCGA-BH-A42T-01 | Breast | breast invasive carcinoma | Female | >=65 | I/II | Unknown | Unknown | SD |
| Page: 1 2 3 4 5 6 7 8 9 10 11 12 13 14 |
Top |
Related drugs of malignant transformation related genes |
| Identification of chemicals and drugs interact with genes involved in malignant transfromation |
| (DGIdb 4.0) |
| Entrez ID | Symbol | Category | Interaction Types | Drug Claim Name | Drug Name | PMIDs |
| Page: 1 |

Copyright 2023-Present -The University of Texas Health Science Center at Houston |