Schematic overview of the cellular and molecular mechanisms involved in the cancer progression, including the proposed cellular and molecular mechanisms in cancer cells trajectory. AT1: alveolar type 1 cells; AT2: alveolar type 2 cells; AAH: atypical adenomatous hyperplasia; AIS: adenocarcinoma in situ; MIA: minimally invasive adenocarcinoma; IA: invasive adenocarcinoma; EMT: epithelial-mesenchymal transition

Home

Download

Statistics

Help

Contact

Center for Computational Systems Medicine
leaf

Gene summary

leaf

Malignant transformation analysis

leaf

Malignant transformation related pathway analysis

leaf

Cell-cell communication analysis

leaf

Single-cell gene regulatory network inference analysis

leaf

Somatic mutation of malignant transformation related genes

leaf

Related drugs of malignant transformation related genes

Gene: ARID4A

Gene summary for ARID4A

check button Gene summary.

Gene informationSpeciesHuman
Gene symbol

ARID4A

Gene ID

5926

Gene nameAT-rich interaction domain 4A
Gene AliasRBBP-1
Cytomap14q23.1
Gene Typeprotein-coding
GO ID

GO:0000003

UniProtAcc

A0A024R657


Top

Malignant transformation analysis

check button Identification of the aberrant gene expression in precancerous and cancerous lesions by comparing the gene expression of stem-like cells in diseased tissues with normal stem cells
check button Malignant transformation involving gene list.
Entrez IDSymbolReplicatesSpeciesOrganTissueAdj P-valueLog2FCMalignancy
5926ARID4ALZE4THumanEsophagusESCC1.71e-156.02e-010.0811
5926ARID4ALZE8THumanEsophagusESCC4.84e-021.54e-010.067
5926ARID4ALZE20THumanEsophagusESCC1.35e-105.50e-010.0662
5926ARID4ALZE22THumanEsophagusESCC5.91e-034.38e-010.068
5926ARID4ALZE24THumanEsophagusESCC4.92e-133.15e-010.0596
5926ARID4ALZE21THumanEsophagusESCC4.11e-022.66e-010.0655
5926ARID4AP1T-EHumanEsophagusESCC2.27e-115.97e-010.0875
5926ARID4AP2T-EHumanEsophagusESCC3.64e-275.13e-010.1177
5926ARID4AP4T-EHumanEsophagusESCC1.65e-297.03e-010.1323
5926ARID4AP5T-EHumanEsophagusESCC2.73e-224.23e-010.1327
5926ARID4AP8T-EHumanEsophagusESCC1.35e-336.74e-010.0889
5926ARID4AP9T-EHumanEsophagusESCC1.50e-123.24e-010.1131
5926ARID4AP10T-EHumanEsophagusESCC1.43e-386.76e-010.116
5926ARID4AP11T-EHumanEsophagusESCC3.68e-137.27e-010.1426
5926ARID4AP12T-EHumanEsophagusESCC1.18e-448.05e-010.1122
5926ARID4AP15T-EHumanEsophagusESCC2.36e-551.23e+000.1149
5926ARID4AP16T-EHumanEsophagusESCC5.89e-376.95e-010.1153
5926ARID4AP17T-EHumanEsophagusESCC7.58e-031.99e-010.1278
5926ARID4AP20T-EHumanEsophagusESCC1.58e-226.19e-010.1124
5926ARID4AP21T-EHumanEsophagusESCC3.71e-132.10e-010.1617
Page: 1 2 3 4 5 6 7 

check button Transcriptomic changes along malignancy continuum.
TissueExpression DynamicsAbbreviation
EsophagusThe image shows the transcriptomic changes along malignancy continuum.log2FC in expression of this searched gene in stem-like cells from each diseased tissue sample relative to stem-like cells in normal samples in each tissue plotted against the malignancy continuum. Samples are colored based on if they are from different disease stage.ESCC: Esophageal squamous cell carcinoma
HGIN: High-grade intraepithelial neoplasias
LGIN: Low-grade intraepithelial neoplasias
LiverThe image shows the transcriptomic changes along malignancy continuum.log2FC in expression of this searched gene in stem-like cells from each diseased tissue sample relative to stem-like cells in normal samples in each tissue plotted against the malignancy continuum. Samples are colored based on if they are from different disease stage.
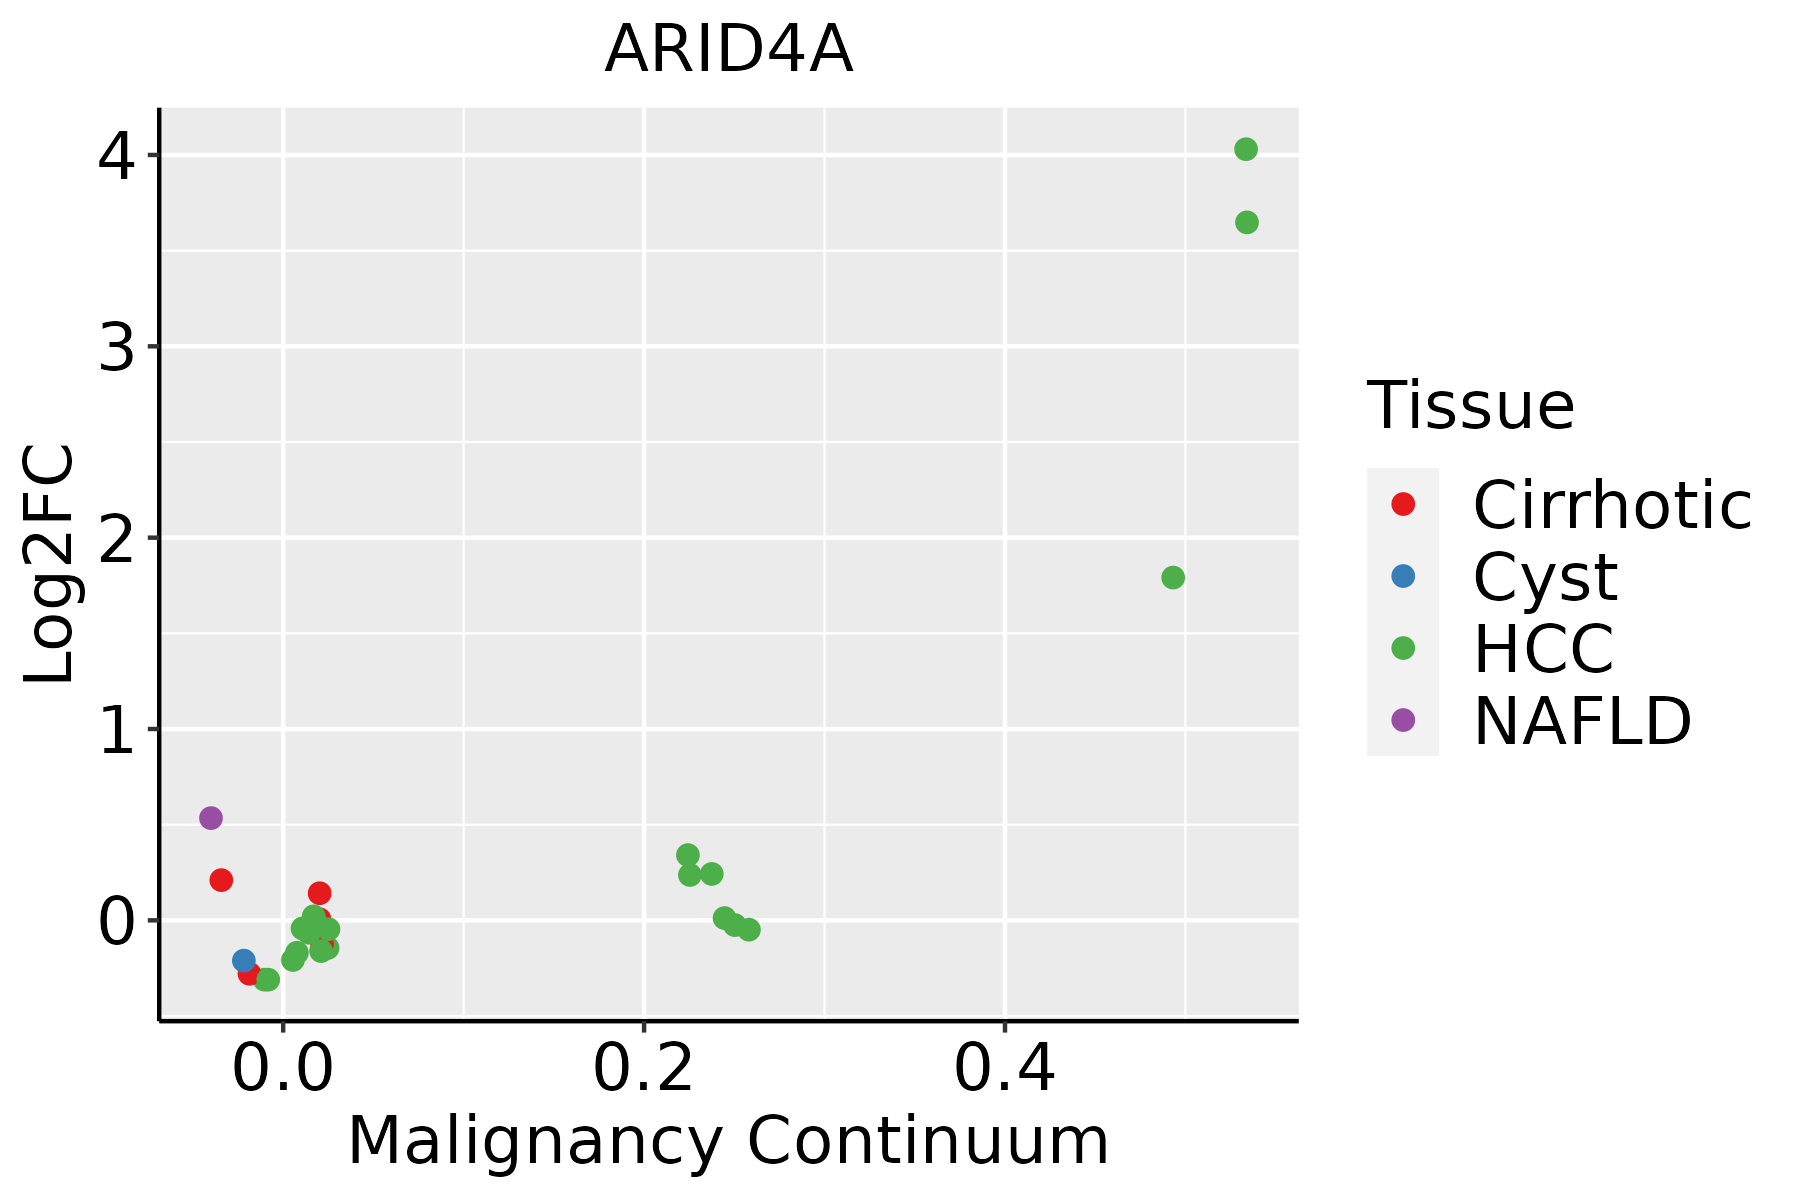
HCC: Hepatocellular carcinoma
NAFLD: Non-alcoholic fatty liver disease
LungThe image shows the transcriptomic changes along malignancy continuum.log2FC in expression of this searched gene in stem-like cells from each diseased tissue sample relative to stem-like cells in normal samples in each tissue plotted against the malignancy continuum. Samples are colored based on if they are from different disease stage.AAH: Atypical adenomatous hyperplasia
AIS: Adenocarcinoma in situ
IAC: Invasive lung adenocarcinoma
MIA: Minimally invasive adenocarcinoma
Oral CavityThe image shows the transcriptomic changes along malignancy continuum.log2FC in expression of this searched gene in stem-like cells from each diseased tissue sample relative to stem-like cells in normal samples in each tissue plotted against the malignancy continuum. Samples are colored based on if they are from different disease stage.EOLP: Erosive Oral lichen planus
LP: leukoplakia
NEOLP: Non-erosive oral lichen planus
OSCC: Oral squamous cell carcinoma
ProstateThe image shows the transcriptomic changes along malignancy continuum.log2FC in expression of this searched gene in stem-like cells from each diseased tissue sample relative to stem-like cells in normal samples in each tissue plotted against the malignancy continuum. Samples are colored based on if they are from different disease stage.
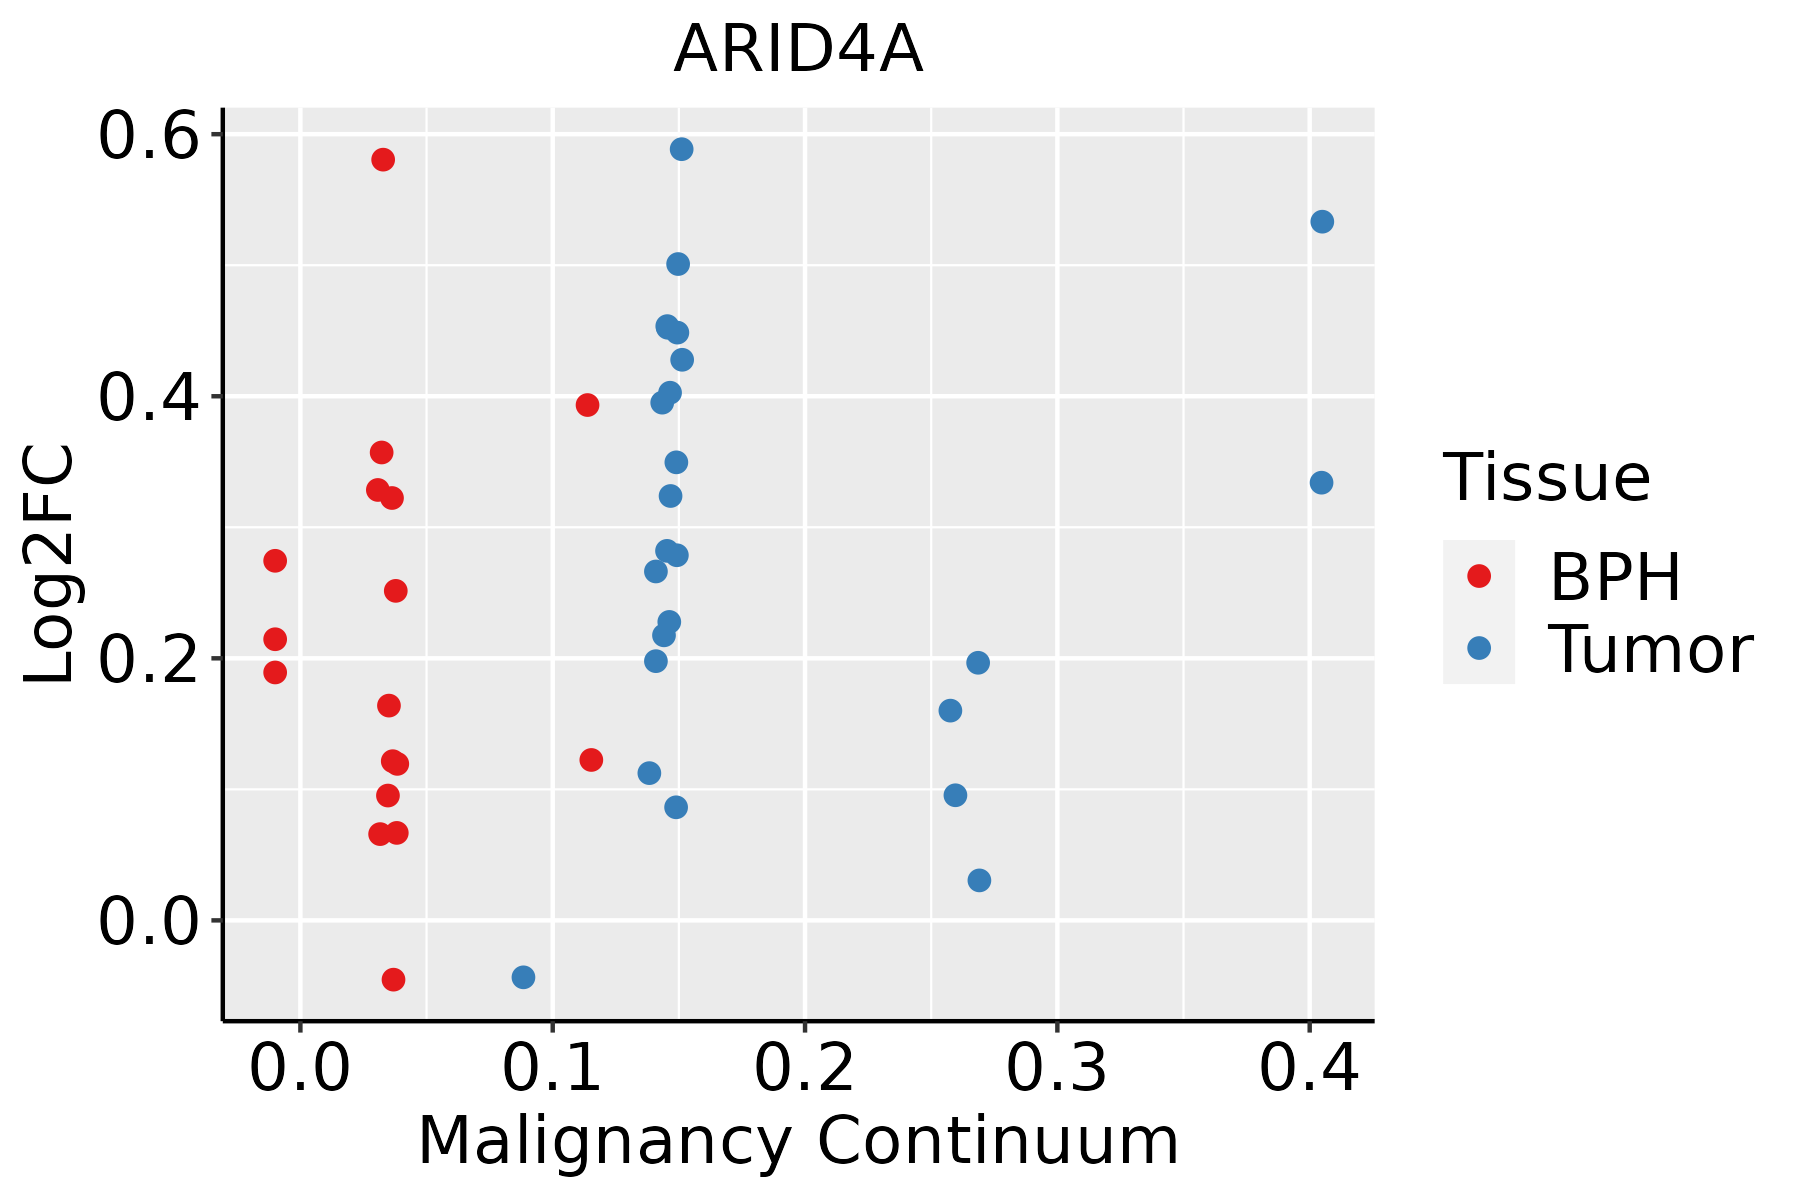
BPH: Benign Prostatic Hyperplasia
ThyroidThe image shows the transcriptomic changes along malignancy continuum.log2FC in expression of this searched gene in stem-like cells from each diseased tissue sample relative to stem-like cells in normal samples in each tissue plotted against the malignancy continuum. Samples are colored based on if they are from different disease stage.ATC: Anaplastic thyroid cancer
HT: Hashimoto's thyroiditis
PTC: Papillary thyroid cancer
∗log2FC in expression of this searched gene in stem-like cells from each diseased tissue sample relative to stem-like cells in normal samples in each tissue plotted against the malignancy continuum. Samples are colored based on if they are from different disease stage.

Top

Malignant transformation related pathway analysis

check buttonFind out the enriched GO biological processes and KEGG pathways involved in transition from healthy to precancer to cancer
check button Figure of enriched GO biological processes.
TissueDisease StageEnriched GO biological Processes
ColorectumADGO analysis - Figure of enriched GO biological processes: Top 15 enriched GO BP terms are showed in the bar plot of each disease state in each tissue. Each row represents a significant GO biological process which is colored according to the -log10(p.adjust).
ColorectumSERGO analysis - Figure of enriched GO biological processes: Top 15 enriched GO BP terms are showed in the bar plot of each disease state in each tissue. Each row represents a significant GO biological process which is colored according to the -log10(p.adjust).
ColorectumMSSGO analysis - Figure of enriched GO biological processes: Top 15 enriched GO BP terms are showed in the bar plot of each disease state in each tissue. Each row represents a significant GO biological process which is colored according to the -log10(p.adjust).
ColorectumMSI-HGO analysis - Figure of enriched GO biological processes: Top 15 enriched GO BP terms are showed in the bar plot of each disease state in each tissue. Each row represents a significant GO biological process which is colored according to the -log10(p.adjust).
ColorectumFAPGO analysis - Figure of enriched GO biological processes: Top 15 enriched GO BP terms are showed in the bar plot of each disease state in each tissue. Each row represents a significant GO biological process which is colored according to the -log10(p.adjust).
∗Top 15 enriched GO BP terms are showed in the bar plot of each disease state in each tissue. Each row represents a significant GO biological process which is colored according to the -log10(p.adjust).
Page: 1 2 3 4 5 6 7 8 9 

check button Enriched GO biological processes.
GO IDTissueDisease StageDescriptionGene RatioBg Ratiopvaluep.adjustCount
GO:001657015EsophagusESCChistone modification323/8552463/187232.61e-267.88e-24323
GO:001820514EsophagusESCCpeptidyl-lysine modification259/8552376/187233.90e-205.26e-18259
GO:00434143EsophagusESCCmacromolecule methylation199/8552316/187233.44e-109.57e-09199
GO:0030099111EsophagusESCCmyeloid cell differentiation232/8552381/187231.22e-092.90e-08232
GO:00322592EsophagusESCCmethylation222/8552364/187232.26e-095.09e-08222
GO:0002262111EsophagusESCCmyeloid cell homeostasis104/8552157/187231.49e-072.36e-06104
GO:0034101111EsophagusESCCerythrocyte homeostasis88/8552129/187231.81e-072.84e-0688
GO:0061458110EsophagusESCCreproductive system development247/8552427/187232.24e-073.42e-06247
GO:00400295EsophagusESCCregulation of gene expression, epigenetic74/8552105/187232.24e-073.42e-0674
GO:004860818EsophagusESCCreproductive structure development245/8552424/187232.82e-074.14e-06245
GO:000647914EsophagusESCCprotein methylation115/8552181/187239.07e-071.16e-05115
GO:000821314EsophagusESCCprotein alkylation115/8552181/187239.07e-071.16e-05115
GO:000206420EsophagusESCCepithelial cell development136/8552220/187239.50e-071.21e-05136
GO:0048872111EsophagusESCChomeostasis of number of cells163/8552272/187231.40e-061.69e-05163
GO:0030218111EsophagusESCCerythrocyte differentiation80/8552120/187232.69e-063.08e-0580
GO:00165718EsophagusESCChistone methylation89/8552141/187232.17e-051.87e-0489
GO:003496814EsophagusESCChistone lysine methylation72/8552115/187231.85e-041.18e-0372
GO:001802214EsophagusESCCpeptidyl-lysine methylation79/8552131/187235.17e-042.86e-0379
GO:00180231EsophagusESCCpeptidyl-lysine trimethylation31/855250/187231.48e-024.79e-0231
GO:00165703LiverNAFLDhistone modification90/1882463/187235.74e-101.28e-0790
Page: 1 2 3 4 5 6 7 8 9 10 11 12 

check button Enriched KEGG pathways.
Pathway IDTissueDisease StageDescriptionGene RatioBg Ratiopvaluep.adjustqvalueCount
Page: 1 

Top

Cell-cell communication analysis

check buttonIdentification of potential cell-cell interactions between two cell types and their ligand-receptor pairs for different disease states
LigandReceptorLRpairPathwayTissueDisease Stage
Page: 1 

Top

Single-cell gene regulatory network inference analysis

check buttonFind out the significant the regulons (TFs) and the target genes of each regulon across cell types for different disease states
TFCell TypeTissueDisease StageTarget GeneRSSRegulon Activity
∗The dot plots of a searched regulon are shown for all cell subpopulations in each disease state of each tissue based on the regulon specific score inferred using pySCENIC and by calculating the average expression.
Page: 1 

Top

Somatic mutation of malignant transformation related genes

check buttonAnnotation of somatic variants for genes involved in malignant transformation
Hugo SymbolVariant ClassVariant ClassificationdbSNP RSHGVScHGVSpHGVSp ShortSWISSPROTBIOTYPESIFTPolyPhenTumor Sample BarcodeTissueHistologySexAgeStageTherapy TypesDrugsOutcome
ARID4ASNVMissense_Mutationc.962A>Gp.Lys321Argp.K321RP29374protein_codingdeleterious(0.02)probably_damaging(0.998)TCGA-AR-A0TV-01Breastbreast invasive carcinomaFemale>=65I/IIUnknownUnknownSD
ARID4ASNVMissense_Mutationc.3109C>Gp.Gln1037Glup.Q1037EP29374protein_codingtolerated(0.11)benign(0.107)TCGA-B6-A0RE-01Breastbreast invasive carcinomaFemale<65I/IIUnknownUnknownSD
ARID4ASNVMissense_Mutationc.2476N>Tp.His826Tyrp.H826YP29374protein_codingdeleterious_low_confidence(0.01)benign(0.013)TCGA-C8-A26Y-01Breastbreast invasive carcinomaFemale>=65I/IIUnknownUnknownSD
ARID4ASNVMissense_Mutationnovelc.375N>Tp.Leu125Phep.L125FP29374protein_codingdeleterious(0)probably_damaging(0.999)TCGA-E2-A2P6-01Breastbreast invasive carcinomaFemale>=65I/IIHormone TherapyanastrozoleSD
ARID4AdeletionIn_Frame_Delc.1948_1962delNNNNNNNNNNNNNNNp.Asp650_Asp654delp.D650_D654delP29374protein_codingTCGA-B6-A0RS-01Breastbreast invasive carcinomaFemale<65I/IIUnknownUnknownPD
ARID4AinsertionFrame_Shift_Insnovelc.1920dupAp.Gln641ThrfsTer6p.Q641Tfs*6P29374protein_codingTCGA-D8-A1J8-01Breastbreast invasive carcinomaFemale>=65I/IIHormone TherapynolvadexSD
ARID4AdeletionFrame_Shift_Delnovelc.1915delNp.Lys640AsnfsTer32p.K640Nfs*32P29374protein_codingTCGA-EW-A2FV-01Breastbreast invasive carcinomaFemale<65III/IVChemotherapydocetaxelSD
ARID4ASNVMissense_Mutationnovelc.3665N>Tp.Arg1222Metp.R1222MP29374protein_codingdeleterious(0)probably_damaging(0.993)TCGA-2W-A8YY-01Cervixcervical & endocervical cancerFemale<65I/IIChemotherapycisplatinCR
ARID4ASNVMissense_Mutationc.1525A>Gp.Thr509Alap.T509AP29374protein_codingtolerated(0.26)benign(0)TCGA-BI-A0VR-01Cervixcervical & endocervical cancerFemale<65III/IVUnknownUnknownSD
ARID4ASNVMissense_Mutationrs760395662c.2281G>Cp.Glu761Glnp.E761QP29374protein_codingdeleterious_low_confidence(0.01)benign(0.003)TCGA-FU-A23L-01Cervixcervical & endocervical cancerFemale<65I/IIChemotherapycisplatinCR
Page: 1 2 3 4 5 6 7 8 9 10 11 12 13 14 

Top

Related drugs of malignant transformation related genes

check buttonIdentification of chemicals and drugs interact with genes involved in malignant transfromation
(DGIdb 4.0)
Entrez IDSymbolCategoryInteraction TypesDrug Claim NameDrug NamePMIDs
Page: 1