
|
|||||
|
 | |
| |
| |
| |
| |
| |
|
Gene: ARID3A |
Gene summary for ARID3A |
| Gene information | Species | Human | Gene symbol | ARID3A | Gene ID | 1820 |
| Gene name | AT-rich interaction domain 3A | |
| Gene Alias | BRIGHT | |
| Cytomap | 19p13.3 | |
| Gene Type | protein-coding | GO ID | GO:0006139 | UniProtAcc | Q99856 |
Top |
Malignant transformation analysis |
| Identification of the aberrant gene expression in precancerous and cancerous lesions by comparing the gene expression of stem-like cells in diseased tissues with normal stem cells |
| Entrez ID | Symbol | Replicates | Species | Organ | Tissue | Adj P-value | Log2FC | Malignancy |
| 1820 | ARID3A | HTA11_3410_2000001011 | Human | Colorectum | AD | 4.50e-04 | 1.84e-01 | 0.0155 |
| 1820 | ARID3A | HTA11_2951_2000001011 | Human | Colorectum | AD | 2.17e-03 | 4.22e-01 | 0.0216 |
| 1820 | ARID3A | HTA11_1938_2000001011 | Human | Colorectum | AD | 2.85e-12 | 4.46e-01 | -0.0811 |
| 1820 | ARID3A | HTA11_78_2000001011 | Human | Colorectum | AD | 1.40e-04 | 3.09e-01 | -0.1088 |
| 1820 | ARID3A | HTA11_347_2000001011 | Human | Colorectum | AD | 7.11e-03 | 7.91e-02 | -0.1954 |
| 1820 | ARID3A | HTA11_3361_2000001011 | Human | Colorectum | AD | 1.76e-05 | 3.56e-01 | -0.1207 |
| 1820 | ARID3A | HTA11_696_2000001011 | Human | Colorectum | AD | 6.36e-03 | 2.33e-01 | -0.1464 |
| 1820 | ARID3A | HTA11_866_2000001011 | Human | Colorectum | AD | 3.68e-10 | 3.58e-01 | -0.1001 |
| 1820 | ARID3A | HTA11_1391_2000001011 | Human | Colorectum | AD | 6.89e-04 | 2.30e-01 | -0.059 |
| 1820 | ARID3A | HTA11_546_2000001011 | Human | Colorectum | AD | 8.11e-05 | 3.85e-01 | -0.0842 |
| 1820 | ARID3A | HTA11_866_3004761011 | Human | Colorectum | AD | 1.88e-17 | 4.66e-01 | 0.096 |
| 1820 | ARID3A | HTA11_9408_2000001011 | Human | Colorectum | AD | 2.86e-02 | 4.54e-01 | 0.0451 |
| 1820 | ARID3A | HTA11_10711_2000001011 | Human | Colorectum | AD | 1.96e-09 | 4.09e-01 | 0.0338 |
| 1820 | ARID3A | HTA11_7696_3000711011 | Human | Colorectum | AD | 1.00e-20 | 5.36e-01 | 0.0674 |
| 1820 | ARID3A | HTA11_6818_2000001011 | Human | Colorectum | AD | 5.65e-07 | 4.75e-01 | 0.0112 |
| 1820 | ARID3A | HTA11_6818_2000001021 | Human | Colorectum | AD | 1.25e-17 | 5.69e-01 | 0.0588 |
| 1820 | ARID3A | HTA11_99999965104_69814 | Human | Colorectum | MSS | 2.92e-11 | 3.65e-01 | 0.281 |
| 1820 | ARID3A | HTA11_99999971662_82457 | Human | Colorectum | MSS | 2.72e-24 | 6.70e-01 | 0.3859 |
| 1820 | ARID3A | HTA11_99999973899_84307 | Human | Colorectum | MSS | 2.00e-35 | 1.35e+00 | 0.2585 |
| 1820 | ARID3A | HTA11_99999974143_84620 | Human | Colorectum | MSS | 2.69e-34 | 7.74e-01 | 0.3005 |
| Page: 1 2 |
| Tissue | Expression Dynamics | Abbreviation |
| Colorectum (GSE201348) |  | FAP: Familial adenomatous polyposis |
| CRC: Colorectal cancer | ||
| Colorectum (HTA11) |  | AD: Adenomas |
| SER: Sessile serrated lesions | ||
| MSI-H: Microsatellite-high colorectal cancer | ||
| MSS: Microsatellite stable colorectal cancer | ||
| Liver | 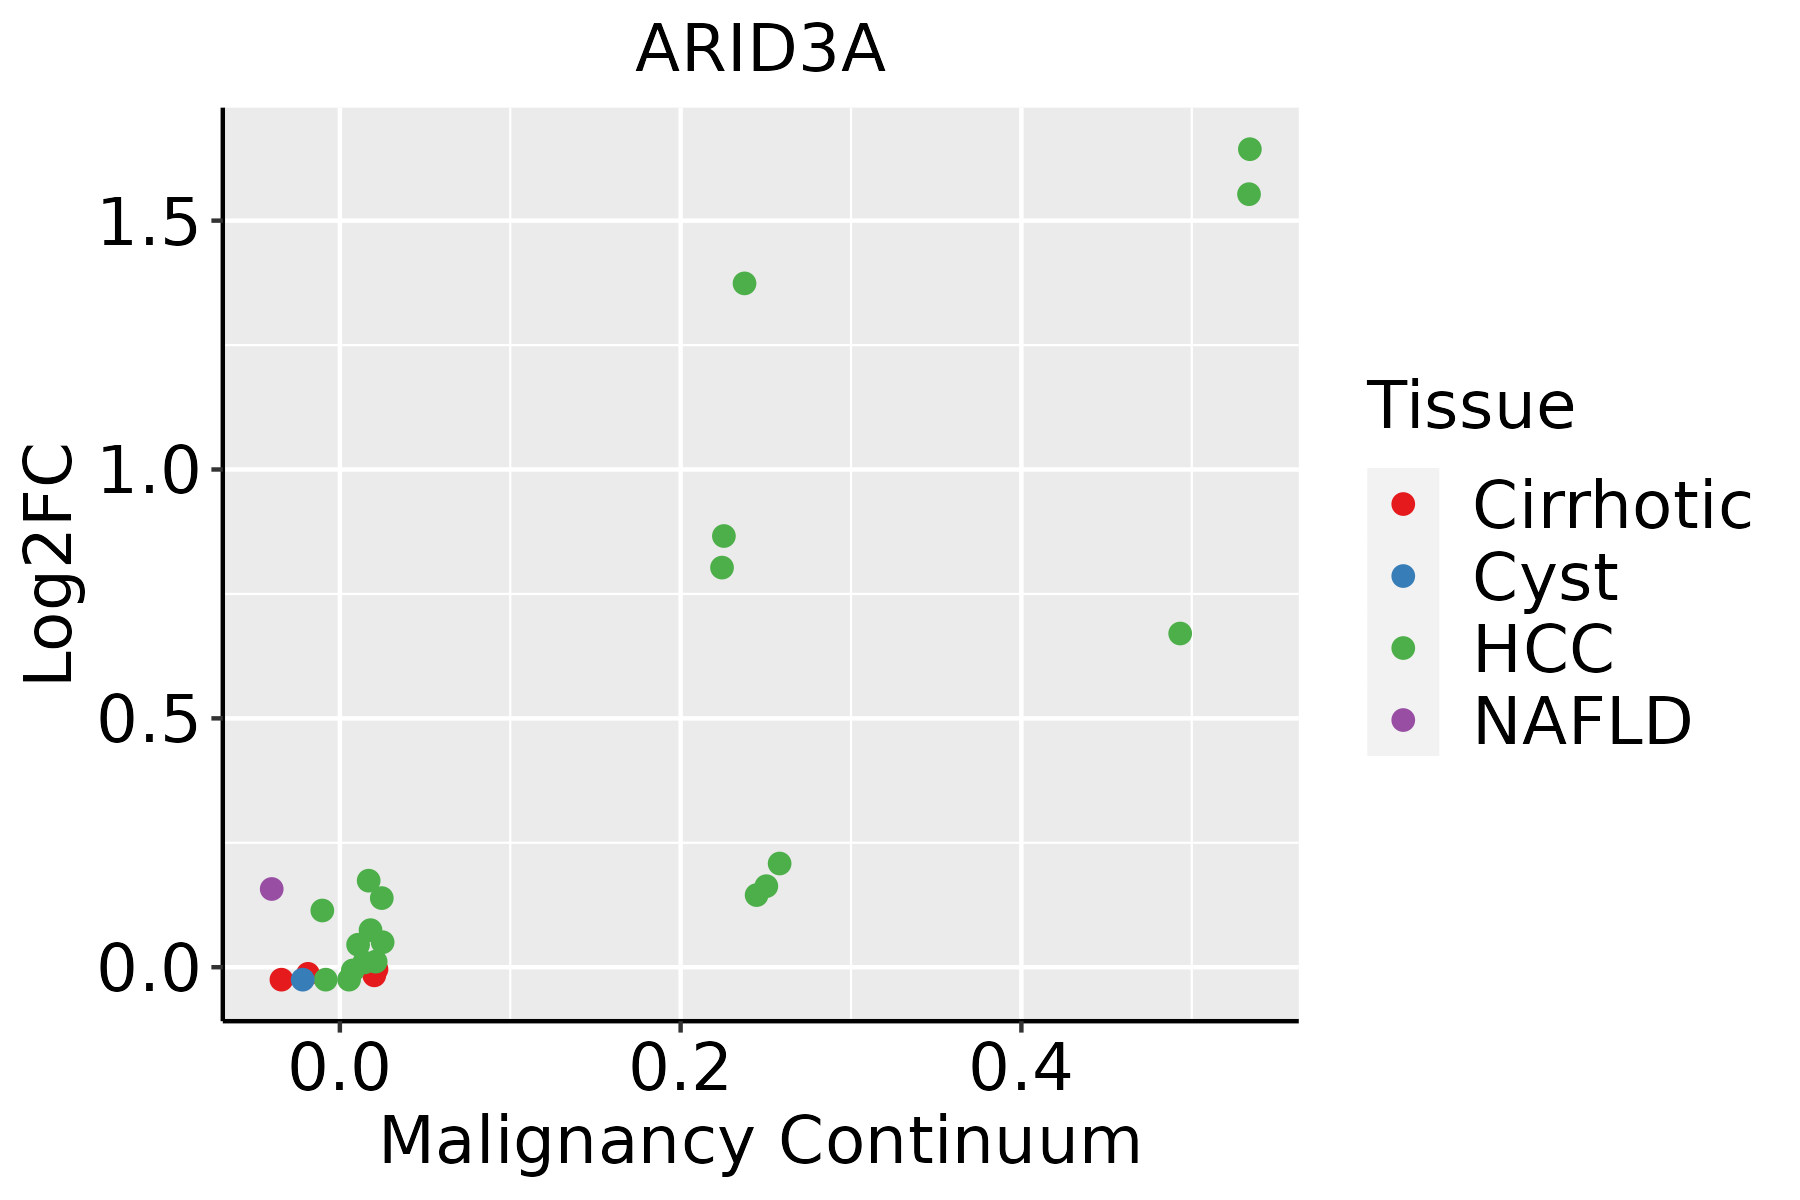 | HCC: Hepatocellular carcinoma |
| NAFLD: Non-alcoholic fatty liver disease |
| ∗log2FC in expression of this searched gene in stem-like cells from each diseased tissue sample relative to stem-like cells in normal samples in each tissue plotted against the malignancy continuum. Samples are colored based on if they are from different disease stage. |
Top |
Malignant transformation related pathway analysis |
| Find out the enriched GO biological processes and KEGG pathways involved in transition from healthy to precancer to cancer |
| Tissue | Disease Stage | Enriched GO biological Processes |
| Colorectum | AD |  |
| Colorectum | SER |  |
| Colorectum | MSS |  |
| Colorectum | MSI-H |  |
| Colorectum | FAP |  |
| ∗Top 15 enriched GO BP terms are showed in the bar plot of each disease state in each tissue. Each row represents a significant GO biological process which is colored according to the -log10(p.adjust). |
| Page: 1 2 3 4 5 6 7 8 9 |
| GO ID | Tissue | Disease Stage | Description | Gene Ratio | Bg Ratio | pvalue | p.adjust | Count |
| Page: 1 |
| Pathway ID | Tissue | Disease Stage | Description | Gene Ratio | Bg Ratio | pvalue | p.adjust | qvalue | Count |
| Page: 1 |
Top |
Cell-cell communication analysis |
| Identification of potential cell-cell interactions between two cell types and their ligand-receptor pairs for different disease states |
| Ligand | Receptor | LRpair | Pathway | Tissue | Disease Stage |
| Page: 1 |
Top |
Single-cell gene regulatory network inference analysis |
| Find out the significant the regulons (TFs) and the target genes of each regulon across cell types for different disease states |
| TF | Cell Type | Tissue | Disease Stage | Target Gene | RSS | Regulon Activity |
| ARID3A | MON | Breast | Healthy | SLC2A6,IRX3,CHAF1A, etc. | 1.31e-01 |  |
| ARID3A | ICAF | Breast | ADJ | ARHGEF10,PTGES,ZNF516, etc. | 6.57e-01 |  |
| ARID3A | CAF | Breast | Healthy | ARHGEF10,PTGES,ZNF516, etc. | 3.90e-01 | |
| ARID3A | ICAF | Colorectum | MSS | COL7A1,NRG1,COL6A3, etc. | 5.52e-01 |  |
| ARID3A | INMON | Endometrium | Healthy | SULF2,C12orf75,FCHSD2, etc. | 7.37e-02 |  |
| ARID3A | M1MAC | Oral cavity | ADJ | CD1E,TNFRSF13B,CD1C, etc. | 9.24e-02 |  |
| ARID3A | M1MAC | Oral cavity | LP | CD1E,TNFRSF13B,CD1C, etc. | 1.76e-01 |  |
| ARID3A | MSC | Oral cavity | Healthy | BCAS4,RASAL3,FAM65B, etc. | 5.03e-02 |  |
| ARID3A | ICAF | Oral cavity | LP | BCAS4,RASAL3,FAM65B, etc. | 1.72e-01 | |
| ARID3A | MSC | Oral cavity | OSCC | BCAS4,RASAL3,FAM65B, etc. | 1.53e-01 |  |
| ∗The dot plots of a searched regulon are shown for all cell subpopulations in each disease state of each tissue based on the regulon specific score inferred using pySCENIC and by calculating the average expression. |
| Page: 1 2 |
Top |
Somatic mutation of malignant transformation related genes |
| Annotation of somatic variants for genes involved in malignant transformation |
| Hugo Symbol | Variant Class | Variant Classification | dbSNP RS | HGVSc | HGVSp | HGVSp Short | SWISSPROT | BIOTYPE | SIFT | PolyPhen | Tumor Sample Barcode | Tissue | Histology | Sex | Age | Stage | Therapy Types | Drugs | Outcome |
| ARID3A | SNV | Missense_Mutation | c.302N>T | p.Ser101Leu | p.S101L | Q99856 | protein_coding | deleterious_low_confidence(0.02) | benign(0.108) | TCGA-AC-A23H-01 | Breast | breast invasive carcinoma | Female | >=65 | I/II | Unknown | Unknown | PD | |
| ARID3A | SNV | Missense_Mutation | c.867N>G | p.Ile289Met | p.I289M | Q99856 | protein_coding | deleterious(0) | probably_damaging(0.992) | TCGA-AC-A23H-01 | Breast | breast invasive carcinoma | Female | >=65 | I/II | Unknown | Unknown | PD | |
| ARID3A | insertion | Nonsense_Mutation | novel | c.1766_1767insGTTTAAGCTGGGCTCACGTCTGTAATCCCAGCACTT | p.Asn589delinsLysPheLysLeuGlySerArgLeuTerSerGlnHisPhe | p.N589delinsKFKLGSRL*SQHF | Q99856 | protein_coding | TCGA-B6-A0I6-01 | Breast | breast invasive carcinoma | Female | <65 | I/II | Unknown | Unknown | PD | ||
| ARID3A | SNV | Missense_Mutation | c.947C>G | p.Thr316Ser | p.T316S | Q99856 | protein_coding | deleterious(0.03) | possibly_damaging(0.886) | TCGA-JW-A5VL-01 | Cervix | cervical & endocervical cancer | Female | <65 | I/II | Unknown | Unknown | SD | |
| ARID3A | SNV | Missense_Mutation | c.1473G>C | p.Met491Ile | p.M491I | Q99856 | protein_coding | deleterious(0) | benign(0.119) | TCGA-Q1-A73O-01 | Cervix | cervical & endocervical cancer | Female | <65 | I/II | Chemotherapy | cisplatin | CR | |
| ARID3A | SNV | Missense_Mutation | novel | c.535C>T | p.Pro179Ser | p.P179S | Q99856 | protein_coding | tolerated(0.1) | benign(0.012) | TCGA-AA-A022-01 | Colorectum | colon adenocarcinoma | Female | >=65 | I/II | Unknown | Unknown | SD |
| ARID3A | SNV | Missense_Mutation | rs150609955 | c.1733C>T | p.Ala578Val | p.A578V | Q99856 | protein_coding | deleterious_low_confidence(0.01) | benign(0.063) | TCGA-A5-A0G1-01 | Endometrium | uterine corpus endometrioid carcinoma | Female | >=65 | I/II | Unknown | Unknown | SD |
| ARID3A | SNV | Missense_Mutation | c.964N>A | p.Leu322Met | p.L322M | Q99856 | protein_coding | deleterious(0) | probably_damaging(1) | TCGA-AP-A051-01 | Endometrium | uterine corpus endometrioid carcinoma | Female | >=65 | I/II | Unknown | Unknown | SD | |
| ARID3A | SNV | Missense_Mutation | rs145361495 | c.988C>T | p.Arg330Trp | p.R330W | Q99856 | protein_coding | deleterious(0) | probably_damaging(0.983) | TCGA-AP-A056-01 | Endometrium | uterine corpus endometrioid carcinoma | Female | <65 | I/II | Unknown | Unknown | SD |
| ARID3A | SNV | Missense_Mutation | novel | c.352G>A | p.Ala118Thr | p.A118T | Q99856 | protein_coding | tolerated_low_confidence(0.06) | benign(0.018) | TCGA-AX-A1CE-01 | Endometrium | uterine corpus endometrioid carcinoma | Female | <65 | I/II | Unspecific | Paclitaxel | SD |
| Page: 1 2 3 |
Top |
Related drugs of malignant transformation related genes |
| Identification of chemicals and drugs interact with genes involved in malignant transfromation |
| (DGIdb 4.0) |
| Entrez ID | Symbol | Category | Interaction Types | Drug Claim Name | Drug Name | PMIDs |
| Page: 1 |

Copyright 2023-Present -The University of Texas Health Science Center at Houston |