
|
|||||
|
 | |
| |
| |
| |
| |
| |
|
Gene: ARID1B |
Gene summary for ARID1B |
| Gene information | Species | Human | Gene symbol | ARID1B | Gene ID | 57492 |
| Gene name | AT-rich interaction domain 1B | |
| Gene Alias | 6A3-5 | |
| Cytomap | 6q25.3 | |
| Gene Type | protein-coding | GO ID | GO:0006139 | UniProtAcc | Q8NFD5 |
Top |
Malignant transformation analysis |
| Identification of the aberrant gene expression in precancerous and cancerous lesions by comparing the gene expression of stem-like cells in diseased tissues with normal stem cells |
| Entrez ID | Symbol | Replicates | Species | Organ | Tissue | Adj P-value | Log2FC | Malignancy |
| 57492 | ARID1B | GSM4909286 | Human | Breast | IDC | 2.56e-06 | 1.91e-01 | 0.1081 |
| 57492 | ARID1B | GSM4909293 | Human | Breast | IDC | 3.28e-23 | 4.67e-01 | 0.1581 |
| 57492 | ARID1B | GSM4909298 | Human | Breast | IDC | 2.20e-12 | 3.44e-01 | 0.1551 |
| 57492 | ARID1B | GSM4909308 | Human | Breast | IDC | 3.45e-05 | 2.79e-01 | 0.158 |
| 57492 | ARID1B | GSM4909311 | Human | Breast | IDC | 1.29e-06 | -1.22e-01 | 0.1534 |
| 57492 | ARID1B | GSM4909317 | Human | Breast | IDC | 4.17e-07 | 3.26e-01 | 0.1355 |
| 57492 | ARID1B | GSM4909319 | Human | Breast | IDC | 2.16e-09 | -2.23e-01 | 0.1563 |
| 57492 | ARID1B | GSM4909321 | Human | Breast | IDC | 2.96e-03 | -1.19e-01 | 0.1559 |
| 57492 | ARID1B | brca1 | Human | Breast | Precancer | 4.58e-04 | -2.28e-01 | -0.0338 |
| 57492 | ARID1B | M1 | Human | Breast | IDC | 5.51e-16 | 5.99e-01 | 0.1577 |
| 57492 | ARID1B | P1 | Human | Breast | IDC | 1.86e-07 | 1.73e-01 | 0.1527 |
| 57492 | ARID1B | DCIS2 | Human | Breast | DCIS | 1.67e-78 | 5.48e-01 | 0.0085 |
| 57492 | ARID1B | CA_HPV_1 | Human | Cervix | CC | 1.39e-03 | -3.96e-02 | 0.0264 |
| 57492 | ARID1B | CCI_1 | Human | Cervix | CC | 4.94e-05 | 1.05e+00 | 0.528 |
| 57492 | ARID1B | CCI_2 | Human | Cervix | CC | 1.93e-04 | 8.58e-01 | 0.5249 |
| 57492 | ARID1B | CCI_3 | Human | Cervix | CC | 3.61e-11 | 1.17e+00 | 0.516 |
| 57492 | ARID1B | Tumor | Human | Cervix | CC | 9.67e-12 | -4.39e-01 | 0.1241 |
| 57492 | ARID1B | T3 | Human | Cervix | CC | 4.77e-02 | -2.21e-02 | 0.1389 |
| 57492 | ARID1B | HTA11_3410_2000001011 | Human | Colorectum | AD | 3.04e-30 | -6.39e-01 | 0.0155 |
| 57492 | ARID1B | HTA11_2487_2000001011 | Human | Colorectum | SER | 8.74e-03 | -4.92e-01 | -0.1808 |
| Page: 1 2 3 4 5 6 7 8 9 10 11 12 13 |
| Tissue | Expression Dynamics | Abbreviation |
| Breast | 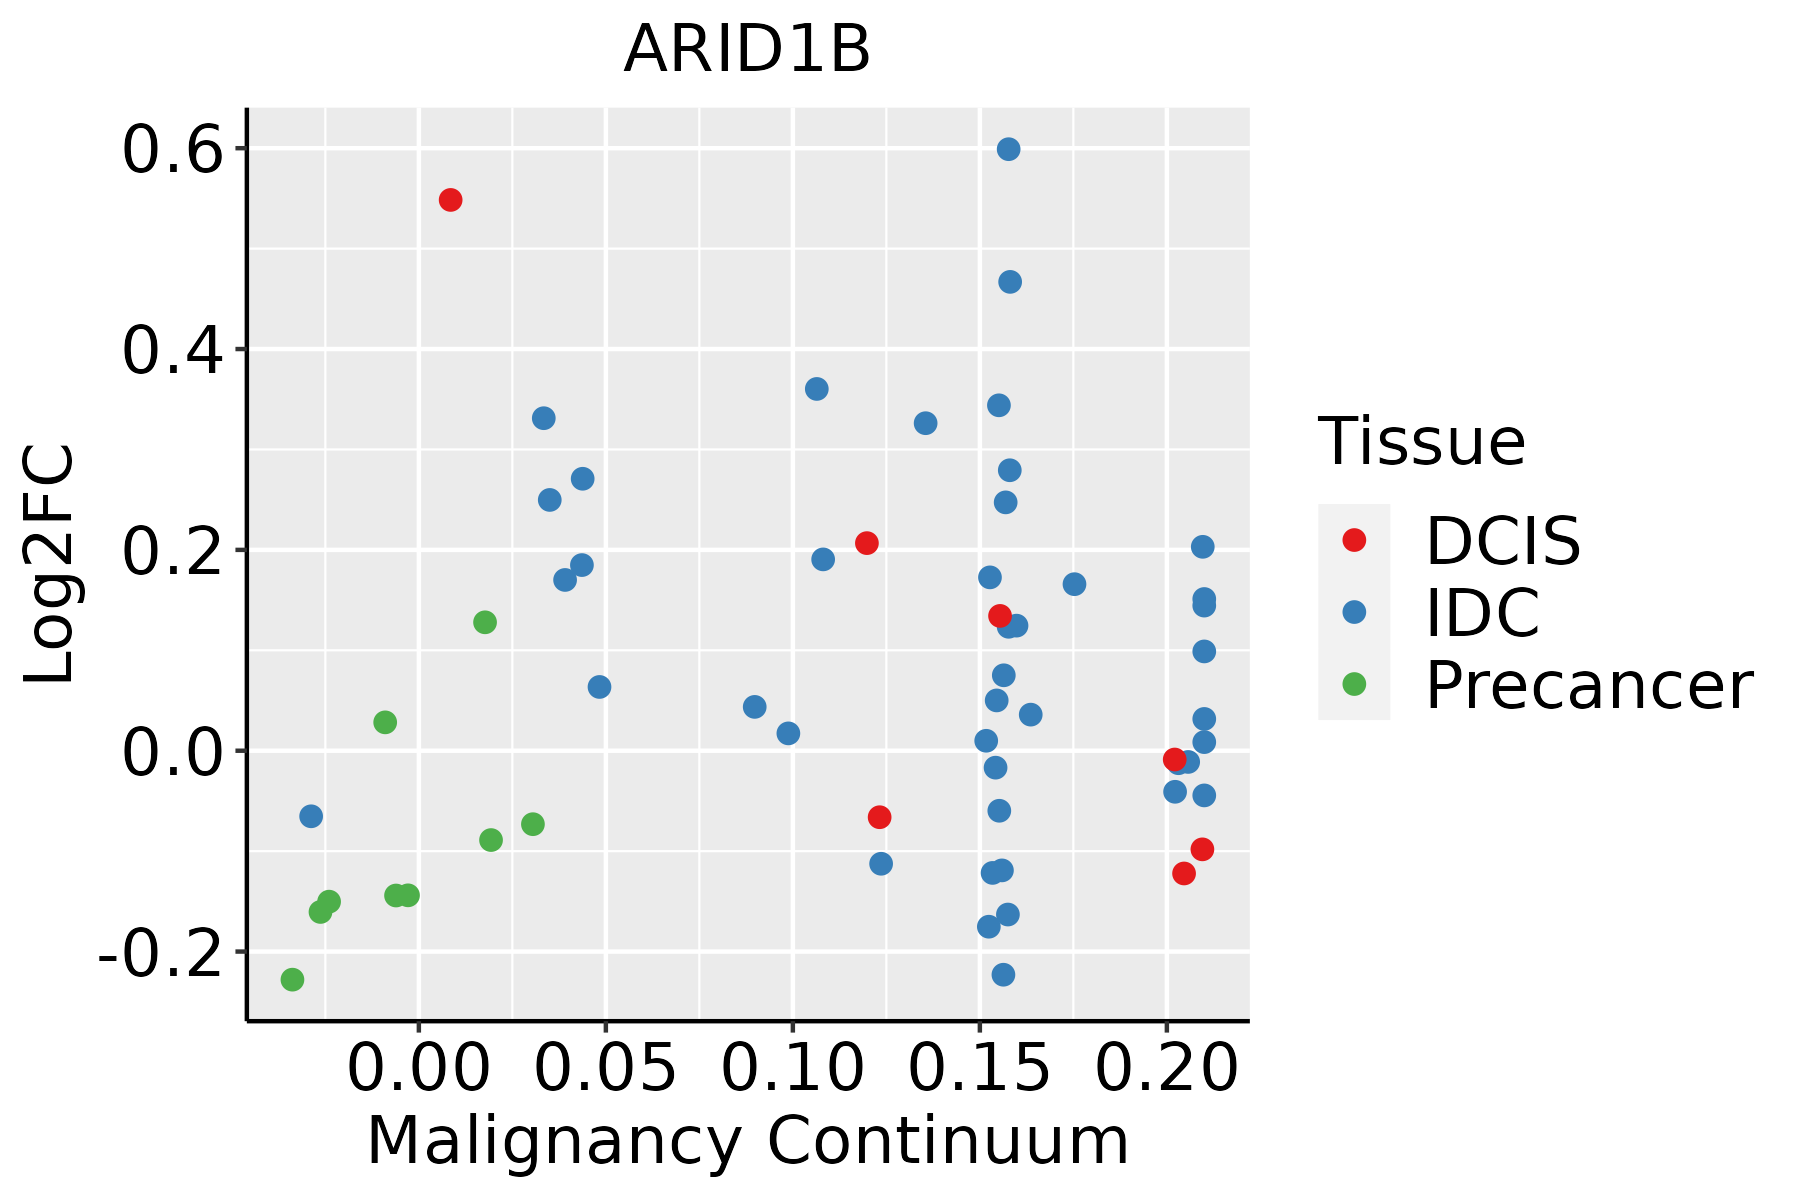 | IDC: Invasive ductal carcinoma |
| DCIS: Ductal carcinoma in situ | ||
| Precancer(BRCA1-mut): Precancerous lesion from BRCA1 mutation carriers | ||
| Cervix |  | CC: Cervix cancer |
| HSIL_HPV: HPV-infected high-grade squamous intraepithelial lesions | ||
| N_HPV: HPV-infected normal cervix | ||
| Colorectum (GSE201348) |  | FAP: Familial adenomatous polyposis |
| CRC: Colorectal cancer | ||
| Colorectum (HTA11) |  | AD: Adenomas |
| SER: Sessile serrated lesions | ||
| MSI-H: Microsatellite-high colorectal cancer | ||
| MSS: Microsatellite stable colorectal cancer | ||
| Endometrium | 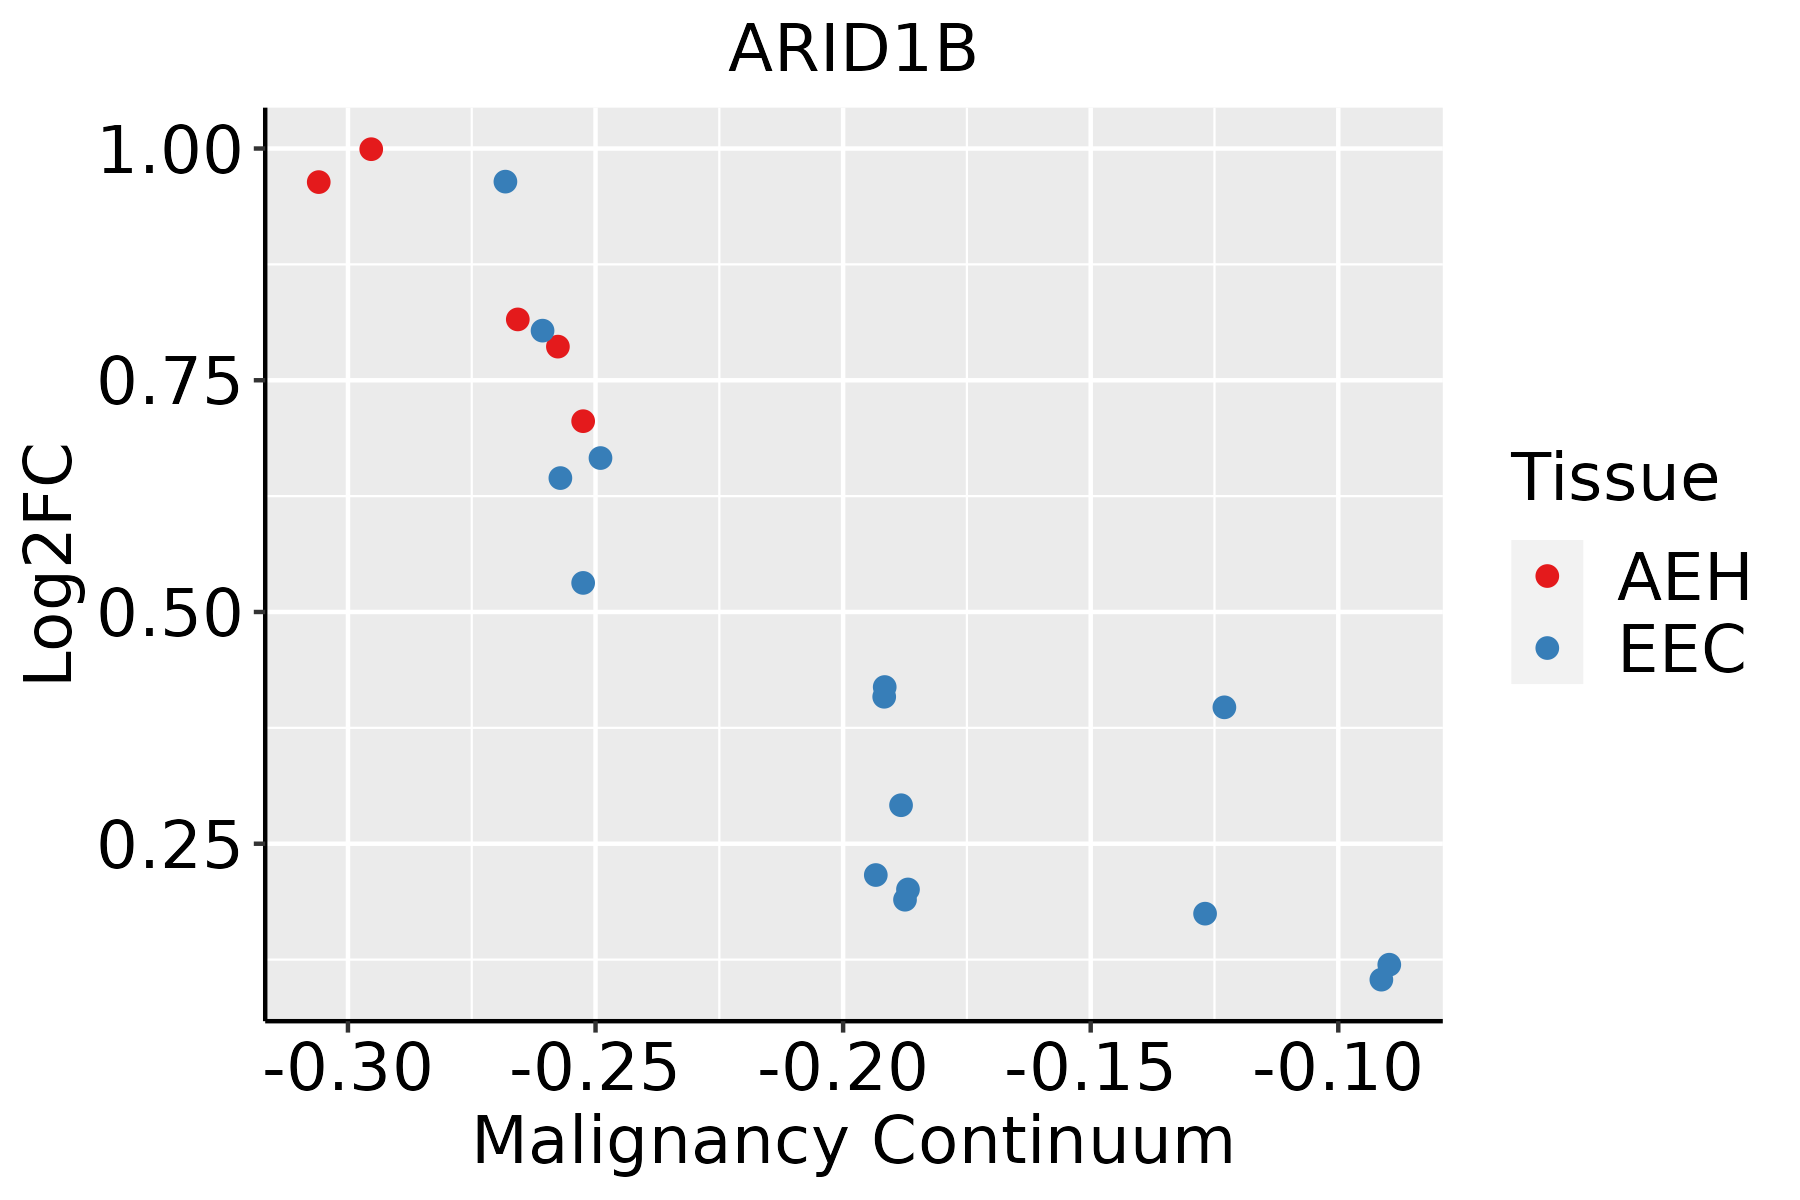 | AEH: Atypical endometrial hyperplasia |
| EEC: Endometrioid Cancer | ||
| Esophagus | 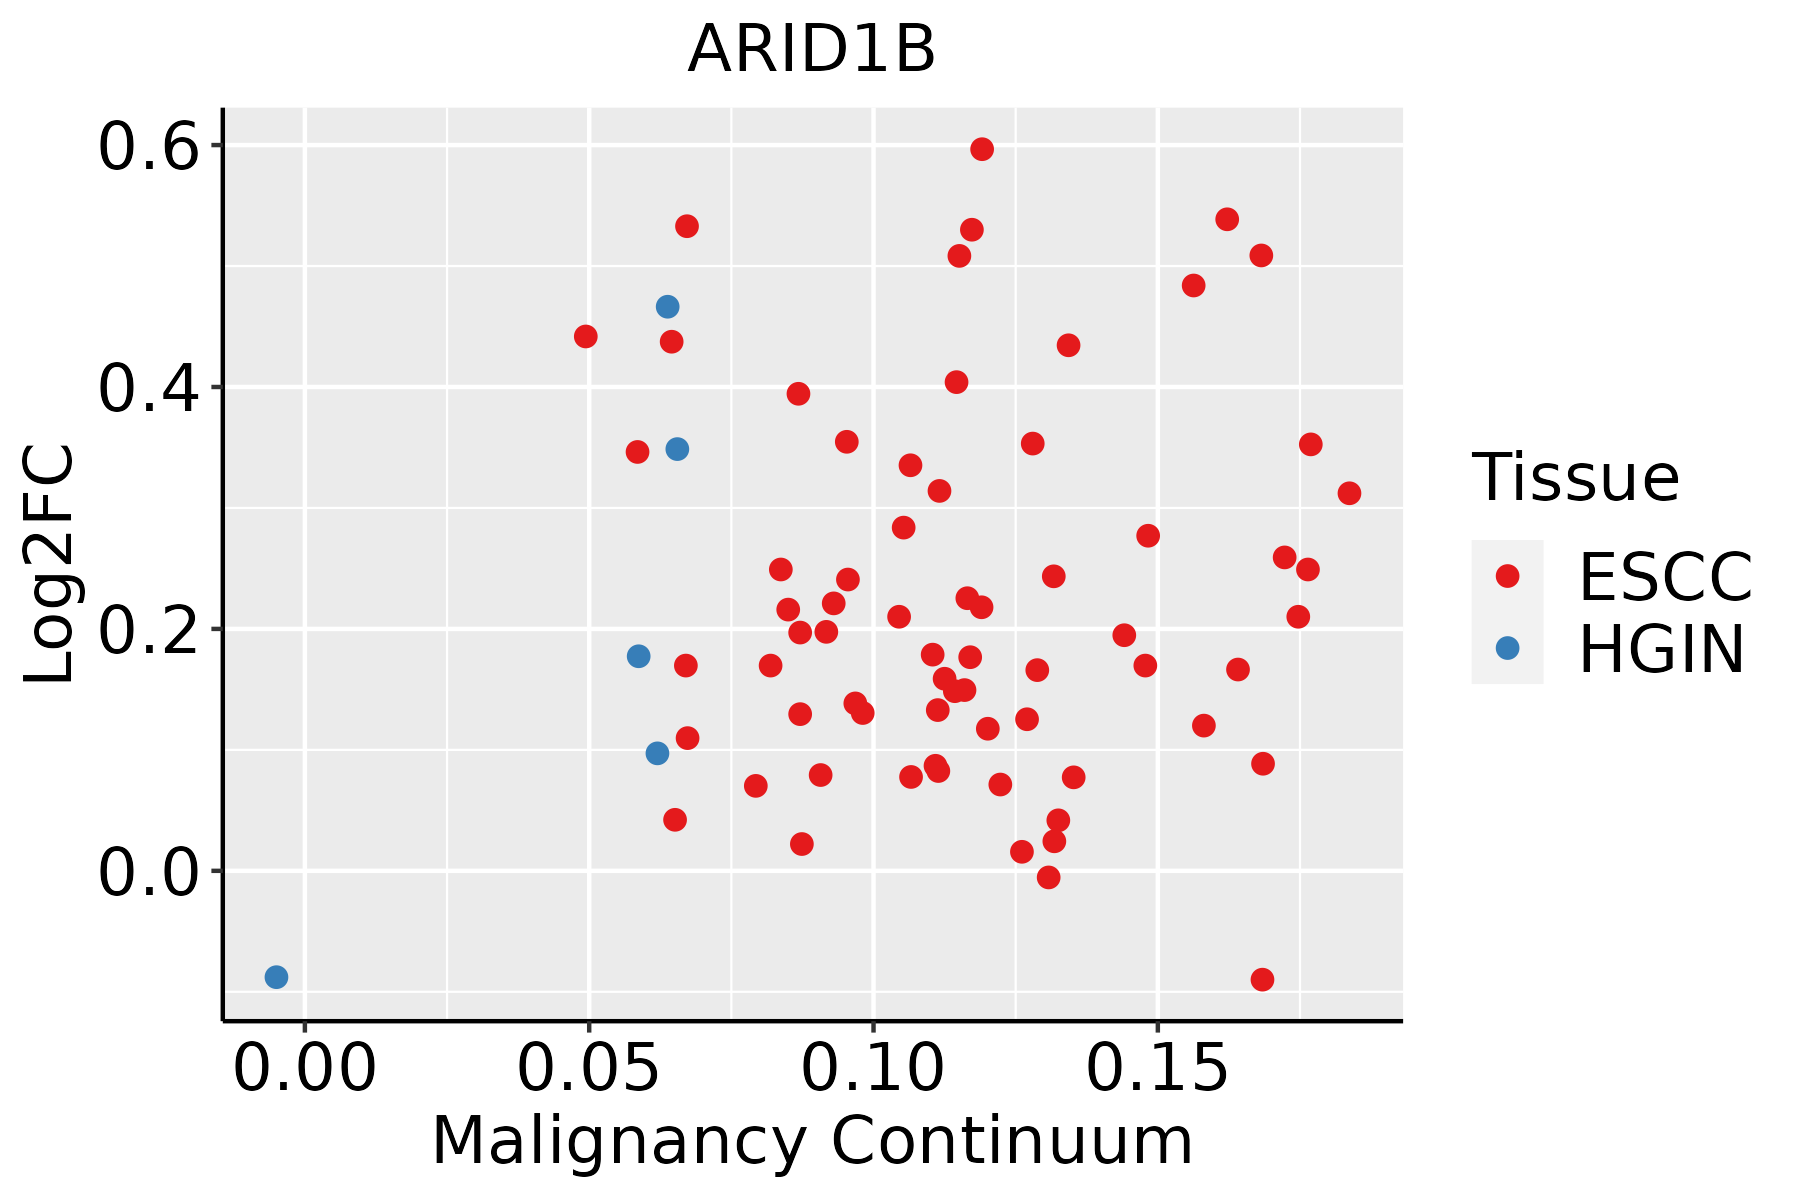 | ESCC: Esophageal squamous cell carcinoma |
| HGIN: High-grade intraepithelial neoplasias | ||
| LGIN: Low-grade intraepithelial neoplasias | ||
| GC | 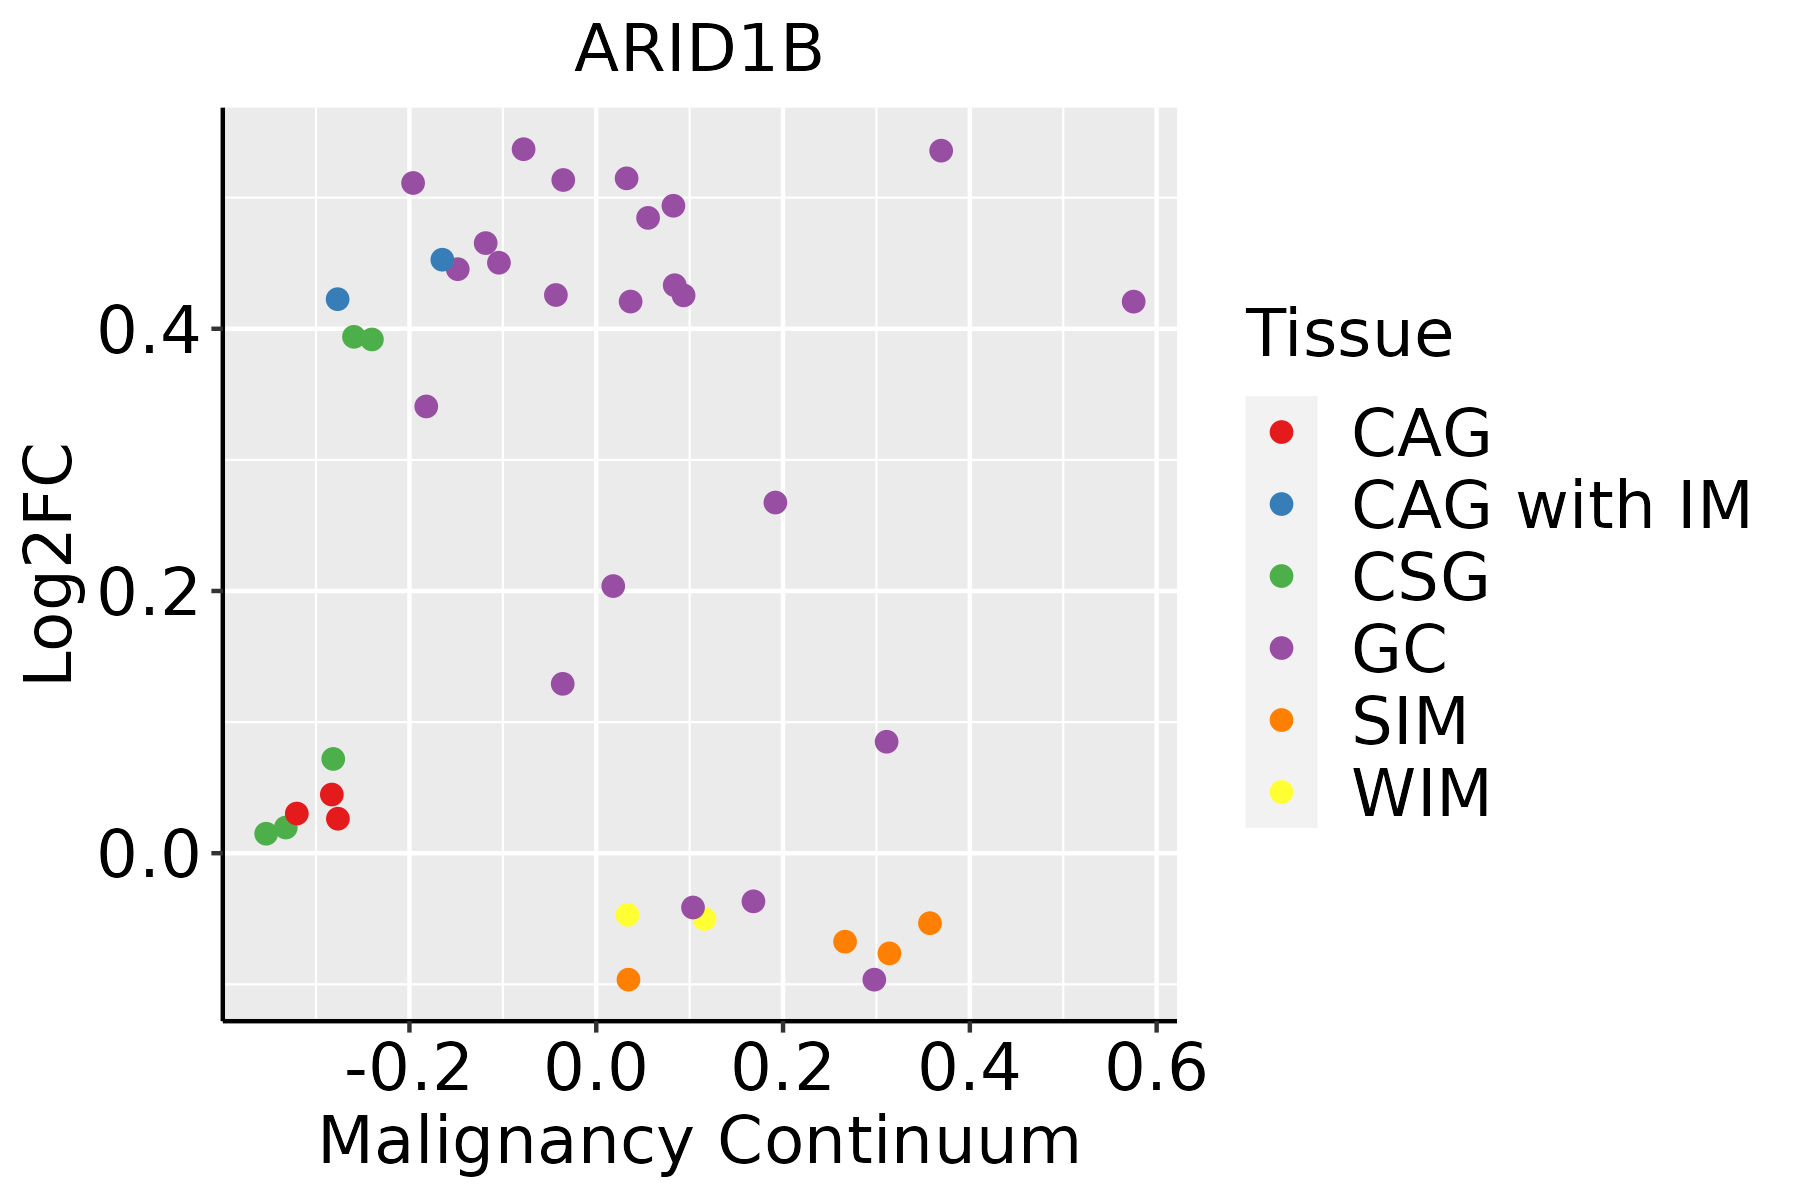 | CAG: Chronic atrophic gastritis |
| CAG with IM: Chronic atrophic gastritis with intestinal metaplasia | ||
| CSG: Chronic superficial gastritis | ||
| GC: Gastric cancer | ||
| SIM: Severe intestinal metaplasia | ||
| WIM: Wild intestinal metaplasia | ||
| Liver | 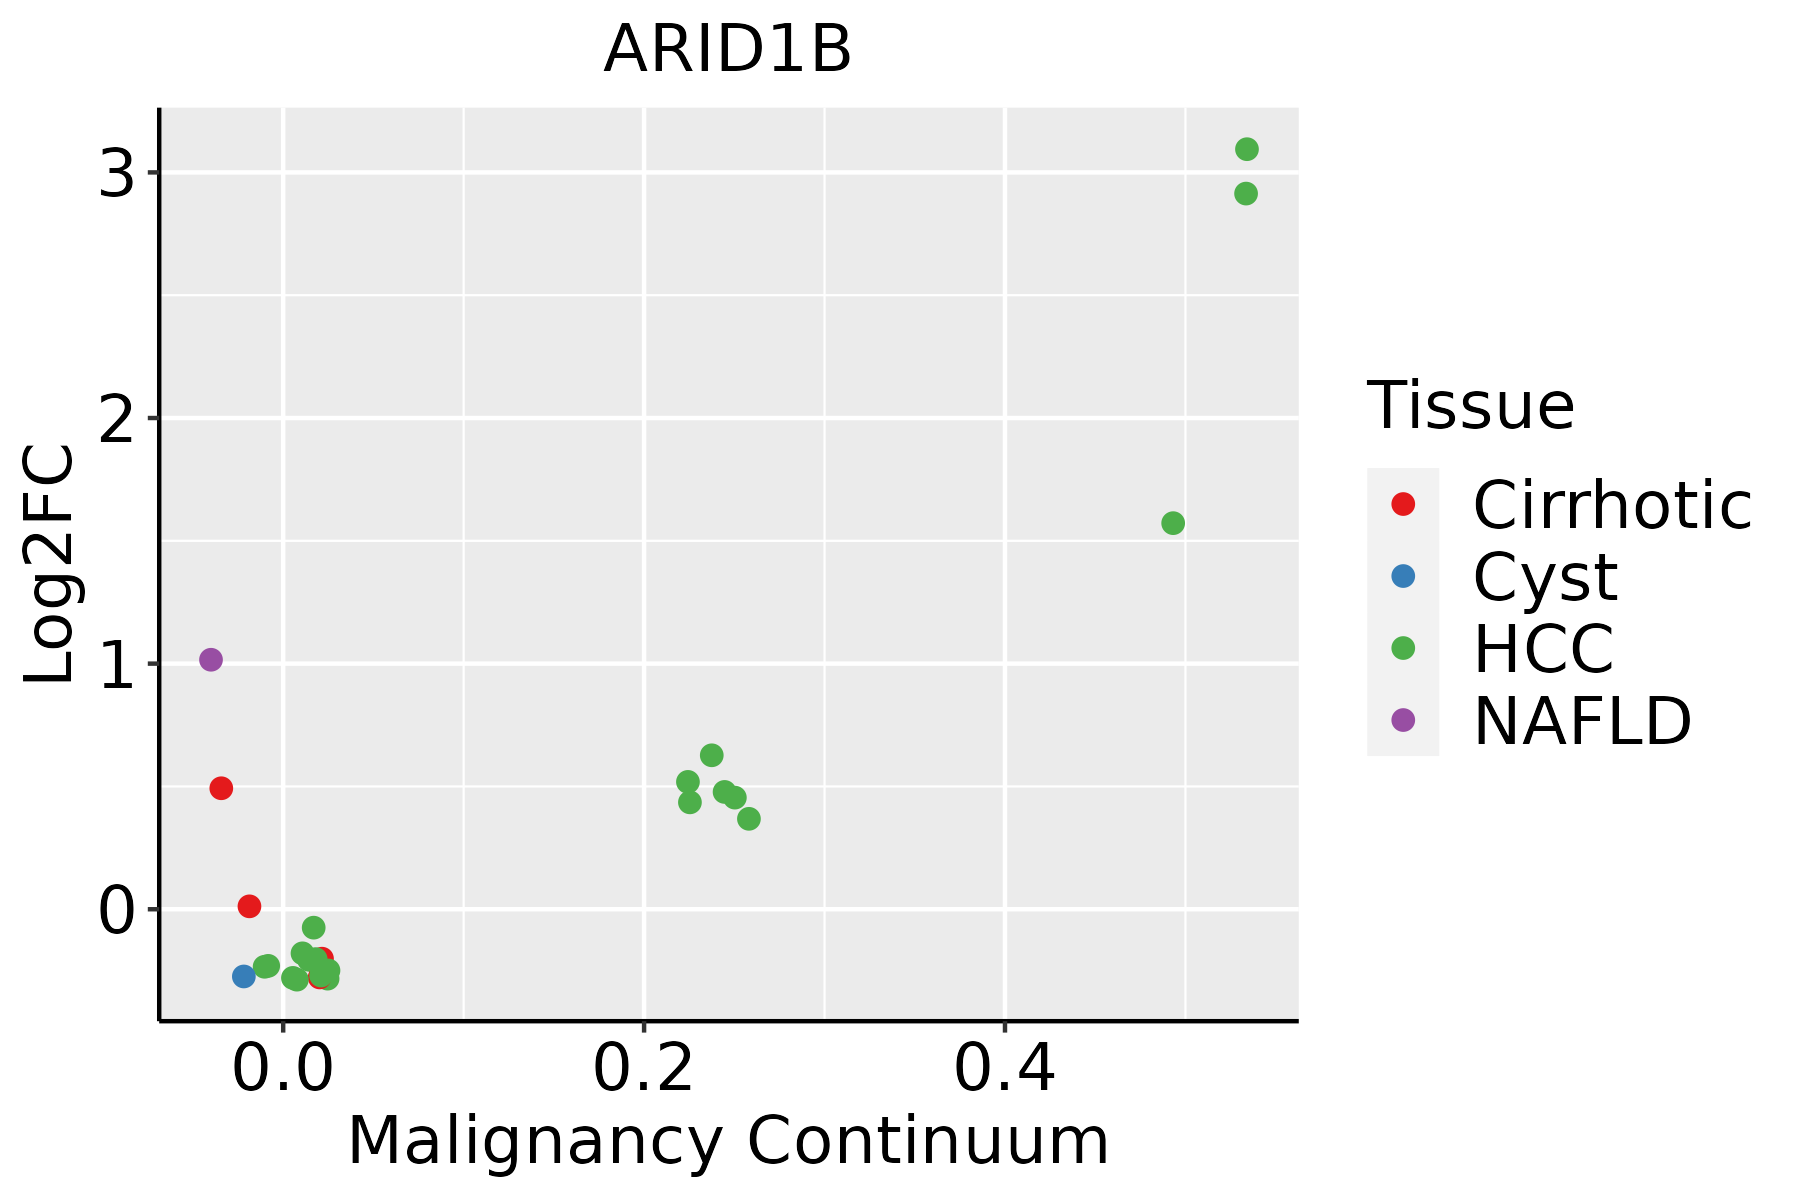 | HCC: Hepatocellular carcinoma |
| NAFLD: Non-alcoholic fatty liver disease | ||
| Lung | 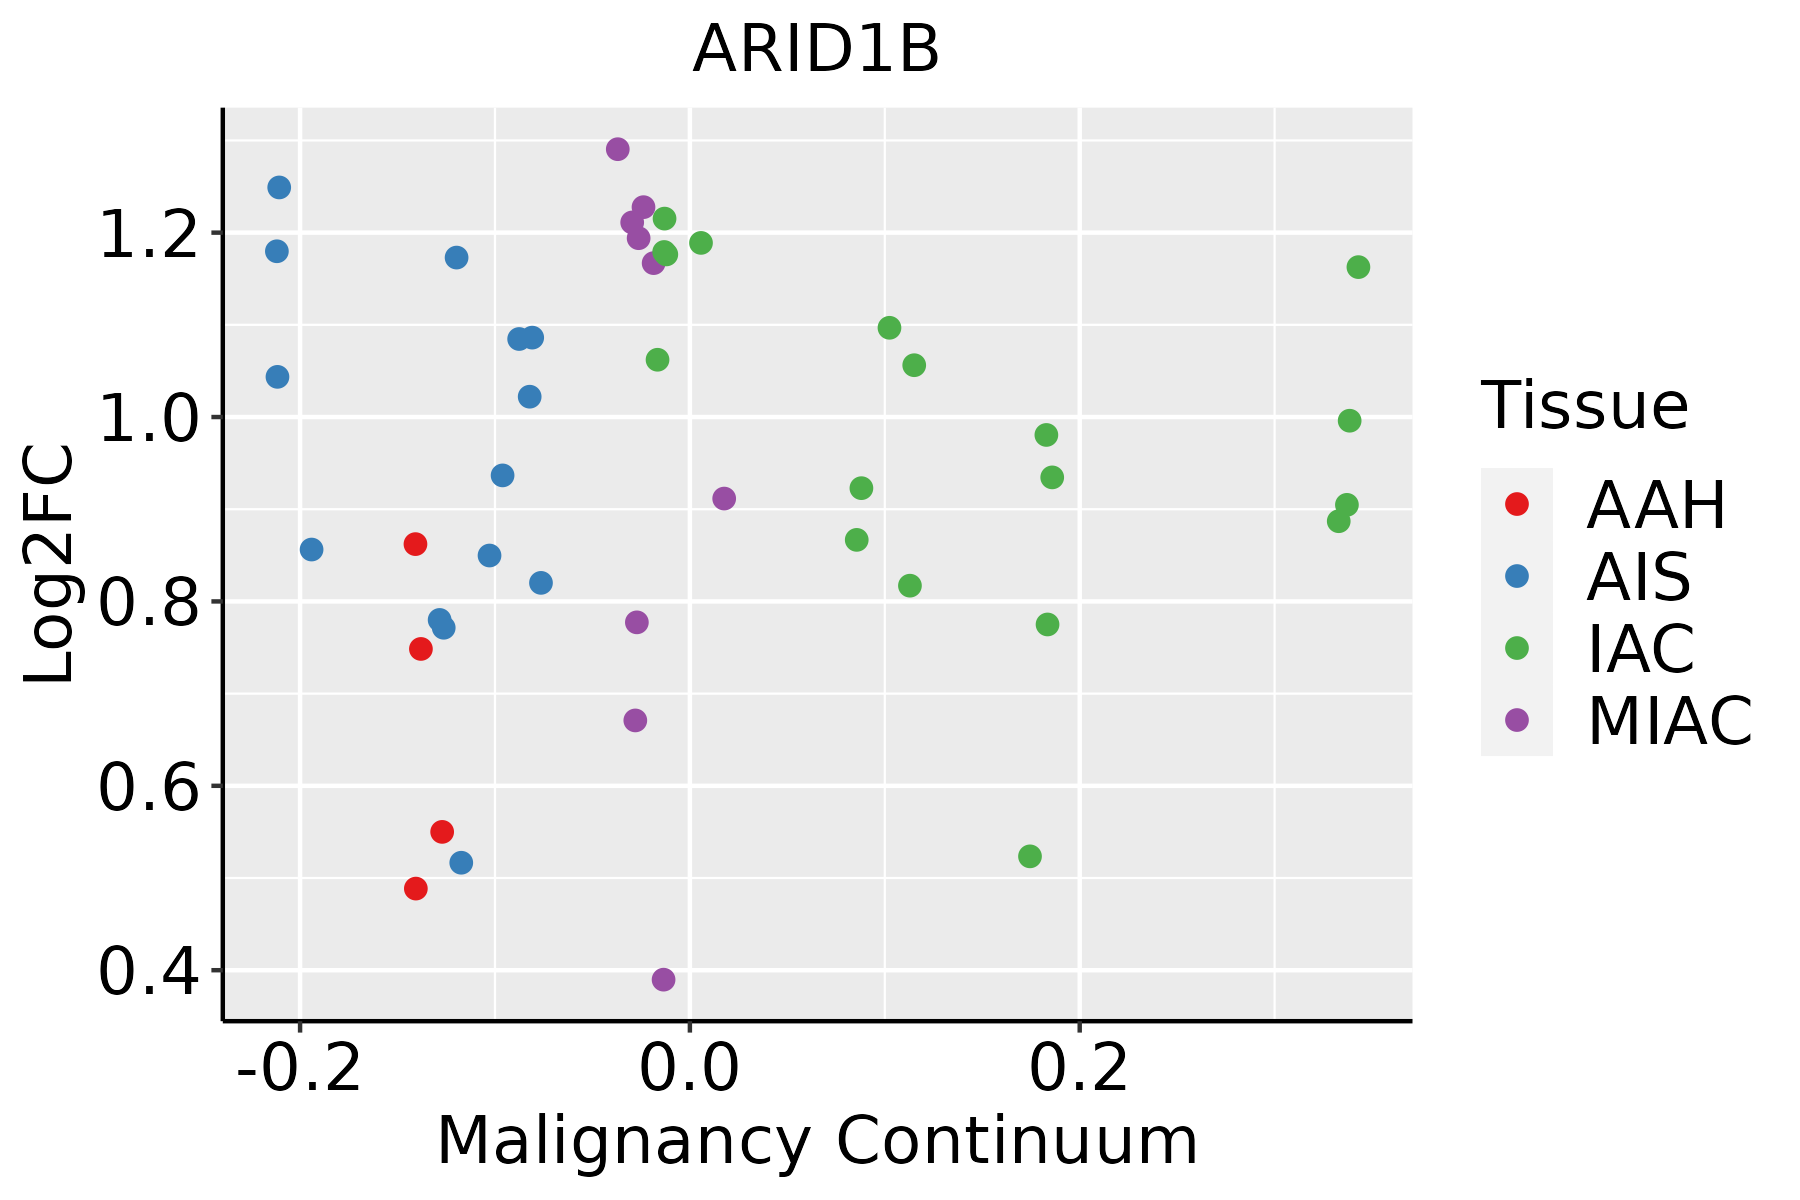 | AAH: Atypical adenomatous hyperplasia |
| AIS: Adenocarcinoma in situ | ||
| IAC: Invasive lung adenocarcinoma | ||
| MIA: Minimally invasive adenocarcinoma | ||
| Oral Cavity |  | EOLP: Erosive Oral lichen planus |
| LP: leukoplakia | ||
| NEOLP: Non-erosive oral lichen planus | ||
| OSCC: Oral squamous cell carcinoma | ||
| Prostate |  | BPH: Benign Prostatic Hyperplasia |
| Skin |  | AK: Actinic keratosis |
| cSCC: Cutaneous squamous cell carcinoma | ||
| SCCIS:squamous cell carcinoma in situ | ||
| Thyroid | 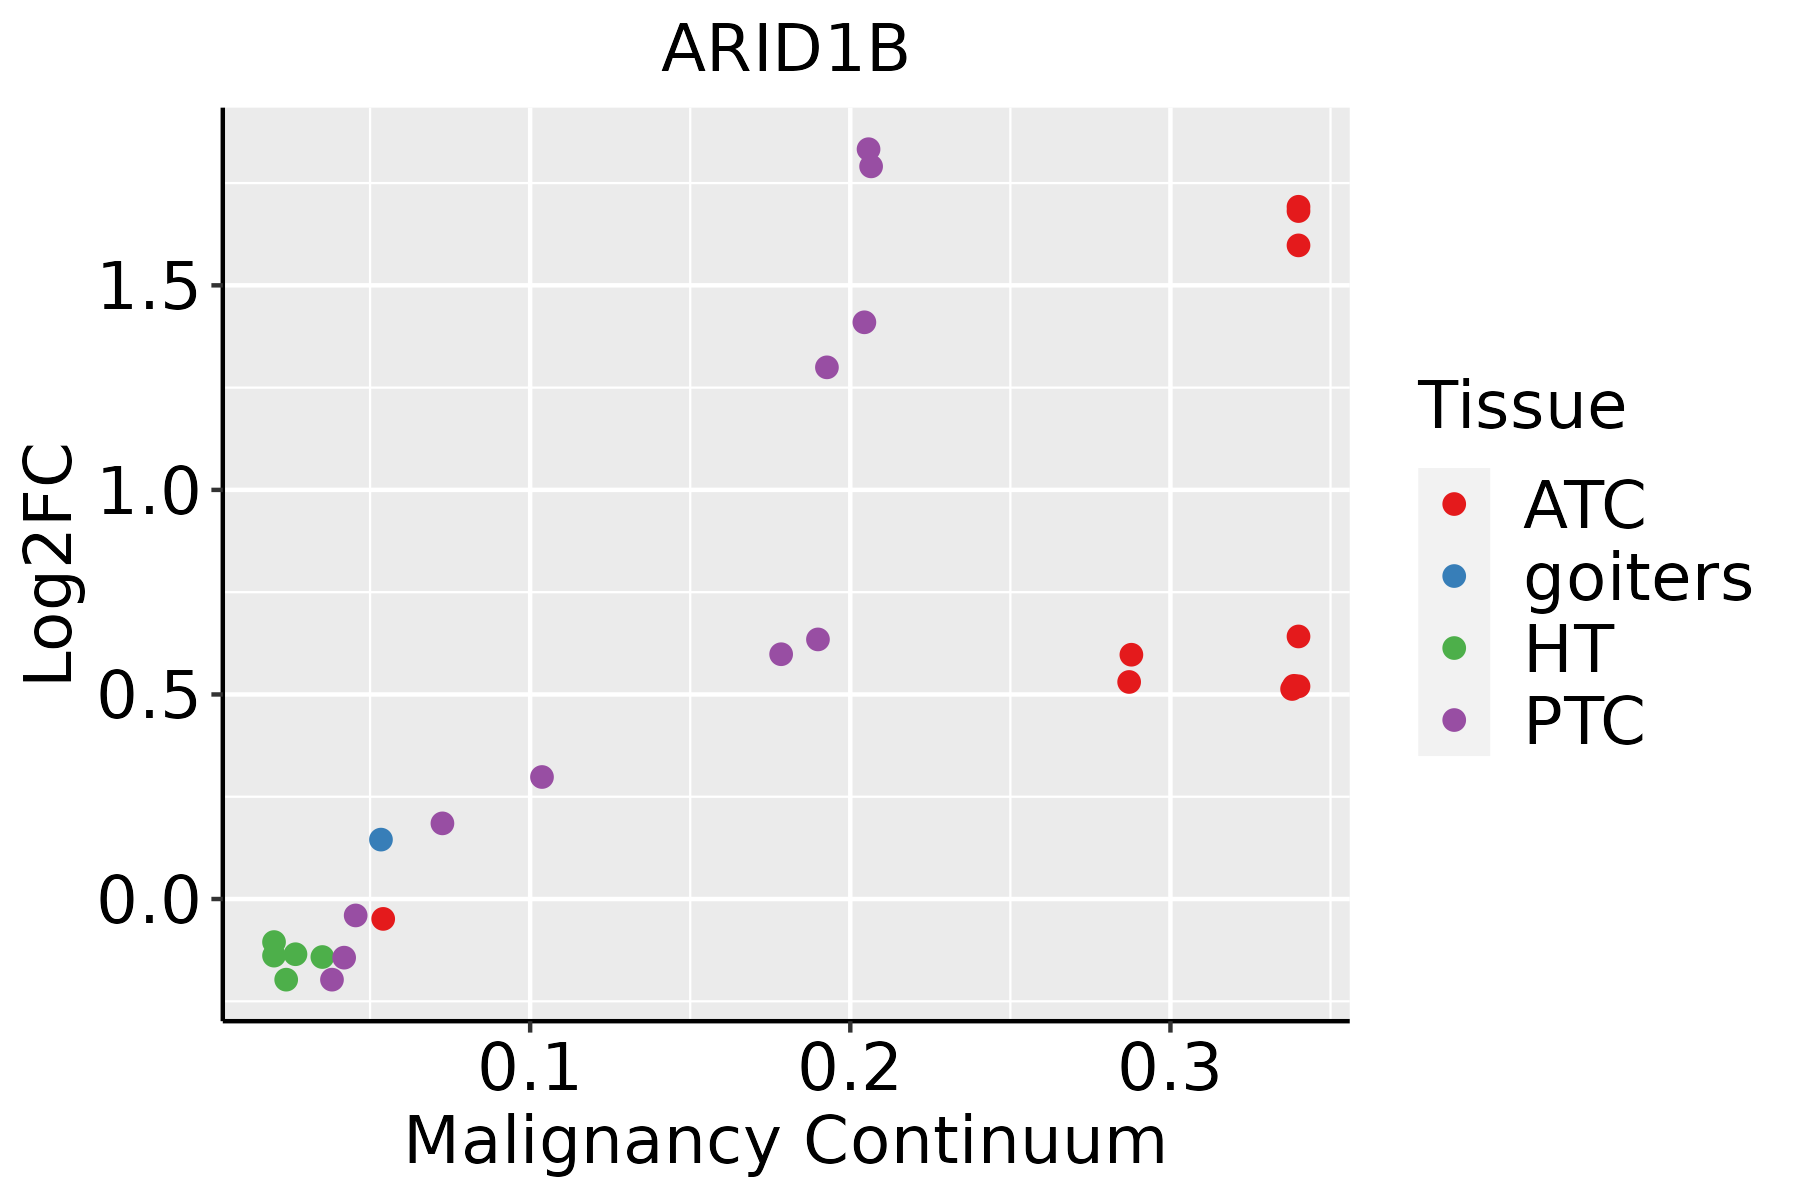 | ATC: Anaplastic thyroid cancer |
| HT: Hashimoto's thyroiditis | ||
| PTC: Papillary thyroid cancer |
| ∗log2FC in expression of this searched gene in stem-like cells from each diseased tissue sample relative to stem-like cells in normal samples in each tissue plotted against the malignancy continuum. Samples are colored based on if they are from different disease stage. |
Top |
Malignant transformation related pathway analysis |
| Find out the enriched GO biological processes and KEGG pathways involved in transition from healthy to precancer to cancer |
| Tissue | Disease Stage | Enriched GO biological Processes |
| Colorectum | AD |  |
| Colorectum | SER |  |
| Colorectum | MSS |  |
| Colorectum | MSI-H |  |
| Colorectum | FAP |  |
| ∗Top 15 enriched GO BP terms are showed in the bar plot of each disease state in each tissue. Each row represents a significant GO biological process which is colored according to the -log10(p.adjust). |
| Page: 1 2 3 4 5 6 7 8 9 |
| GO ID | Tissue | Disease Stage | Description | Gene Ratio | Bg Ratio | pvalue | p.adjust | Count |
| GO:00063257 | Cervix | CC | chromatin organization | 78/2311 | 409/18723 | 5.40e-05 | 8.02e-04 | 78 |
| GO:00063684 | Cervix | CC | transcription elongation from RNA polymerase II promoter | 17/2311 | 69/18723 | 3.65e-03 | 2.33e-02 | 17 |
| GO:00063545 | Cervix | CC | DNA-templated transcription, elongation | 20/2311 | 91/18723 | 6.88e-03 | 3.74e-02 | 20 |
| GO:00063381 | Cervix | CC | chromatin remodeling | 45/2311 | 255/18723 | 8.33e-03 | 4.30e-02 | 45 |
| GO:0006325 | Colorectum | AD | chromatin organization | 119/3918 | 409/18723 | 4.85e-05 | 8.33e-04 | 119 |
| GO:0006354 | Colorectum | AD | DNA-templated transcription, elongation | 31/3918 | 91/18723 | 2.46e-03 | 1.90e-02 | 31 |
| GO:0006368 | Colorectum | AD | transcription elongation from RNA polymerase II promoter | 24/3918 | 69/18723 | 5.35e-03 | 3.52e-02 | 24 |
| GO:0006338 | Colorectum | AD | chromatin remodeling | 70/3918 | 255/18723 | 7.44e-03 | 4.53e-02 | 70 |
| GO:00063251 | Colorectum | SER | chromatin organization | 89/2897 | 409/18723 | 4.15e-04 | 6.17e-03 | 89 |
| GO:00063252 | Colorectum | MSS | chromatin organization | 107/3467 | 409/18723 | 7.22e-05 | 1.21e-03 | 107 |
| GO:00063541 | Colorectum | MSS | DNA-templated transcription, elongation | 29/3467 | 91/18723 | 1.52e-03 | 1.39e-02 | 29 |
| GO:00063681 | Colorectum | MSS | transcription elongation from RNA polymerase II promoter | 22/3467 | 69/18723 | 5.31e-03 | 3.62e-02 | 22 |
| GO:00063253 | Colorectum | FAP | chromatin organization | 84/2622 | 409/18723 | 1.62e-04 | 2.47e-03 | 84 |
| GO:00063682 | Colorectum | FAP | transcription elongation from RNA polymerase II promoter | 20/2622 | 69/18723 | 9.25e-04 | 9.26e-03 | 20 |
| GO:00063542 | Colorectum | FAP | DNA-templated transcription, elongation | 24/2622 | 91/18723 | 1.32e-03 | 1.22e-02 | 24 |
| GO:00063254 | Colorectum | CRC | chromatin organization | 74/2078 | 409/18723 | 1.48e-05 | 4.61e-04 | 74 |
| GO:0048096 | Colorectum | CRC | chromatin-mediated maintenance of transcription | 5/2078 | 11/18723 | 4.35e-03 | 3.47e-02 | 5 |
| GO:00063543 | Colorectum | CRC | DNA-templated transcription, elongation | 19/2078 | 91/18723 | 4.74e-03 | 3.67e-02 | 19 |
| GO:00063258 | Endometrium | AEH | chromatin organization | 64/2100 | 409/18723 | 3.69e-03 | 2.52e-02 | 64 |
| GO:000632513 | Endometrium | EEC | chromatin organization | 65/2168 | 409/18723 | 4.98e-03 | 3.14e-02 | 65 |
| Page: 1 2 3 4 5 |
| Pathway ID | Tissue | Disease Stage | Description | Gene Ratio | Bg Ratio | pvalue | p.adjust | qvalue | Count |
| hsa0471418 | Breast | Precancer | Thermogenesis | 68/684 | 232/8465 | 4.40e-22 | 1.26e-20 | 9.69e-21 | 68 |
| hsa0471419 | Breast | Precancer | Thermogenesis | 68/684 | 232/8465 | 4.40e-22 | 1.26e-20 | 9.69e-21 | 68 |
| hsa0471424 | Breast | IDC | Thermogenesis | 75/867 | 232/8465 | 8.41e-21 | 3.04e-19 | 2.27e-19 | 75 |
| hsa0471434 | Breast | IDC | Thermogenesis | 75/867 | 232/8465 | 8.41e-21 | 3.04e-19 | 2.27e-19 | 75 |
| hsa0471443 | Breast | DCIS | Thermogenesis | 74/846 | 232/8465 | 8.72e-21 | 3.13e-19 | 2.30e-19 | 74 |
| hsa0471453 | Breast | DCIS | Thermogenesis | 74/846 | 232/8465 | 8.72e-21 | 3.13e-19 | 2.30e-19 | 74 |
| hsa0471420 | Cervix | CC | Thermogenesis | 76/1267 | 232/8465 | 4.29e-12 | 1.16e-10 | 6.85e-11 | 76 |
| hsa0522510 | Cervix | CC | Hepatocellular carcinoma | 40/1267 | 168/8465 | 1.52e-03 | 6.39e-03 | 3.78e-03 | 40 |
| hsa04714110 | Cervix | CC | Thermogenesis | 76/1267 | 232/8465 | 4.29e-12 | 1.16e-10 | 6.85e-11 | 76 |
| hsa0522513 | Cervix | CC | Hepatocellular carcinoma | 40/1267 | 168/8465 | 1.52e-03 | 6.39e-03 | 3.78e-03 | 40 |
| hsa04714 | Colorectum | AD | Thermogenesis | 120/2092 | 232/8465 | 2.76e-19 | 1.16e-17 | 7.37e-18 | 120 |
| hsa05225 | Colorectum | AD | Hepatocellular carcinoma | 59/2092 | 168/8465 | 1.50e-03 | 8.69e-03 | 5.54e-03 | 59 |
| hsa047141 | Colorectum | AD | Thermogenesis | 120/2092 | 232/8465 | 2.76e-19 | 1.16e-17 | 7.37e-18 | 120 |
| hsa052251 | Colorectum | AD | Hepatocellular carcinoma | 59/2092 | 168/8465 | 1.50e-03 | 8.69e-03 | 5.54e-03 | 59 |
| hsa047142 | Colorectum | SER | Thermogenesis | 106/1580 | 232/8465 | 1.15e-21 | 6.34e-20 | 4.61e-20 | 106 |
| hsa047143 | Colorectum | SER | Thermogenesis | 106/1580 | 232/8465 | 1.15e-21 | 6.34e-20 | 4.61e-20 | 106 |
| hsa047144 | Colorectum | MSS | Thermogenesis | 113/1875 | 232/8465 | 1.52e-19 | 4.62e-18 | 2.83e-18 | 113 |
| hsa052252 | Colorectum | MSS | Hepatocellular carcinoma | 56/1875 | 168/8465 | 5.04e-04 | 3.45e-03 | 2.11e-03 | 56 |
| hsa047145 | Colorectum | MSS | Thermogenesis | 113/1875 | 232/8465 | 1.52e-19 | 4.62e-18 | 2.83e-18 | 113 |
| hsa052253 | Colorectum | MSS | Hepatocellular carcinoma | 56/1875 | 168/8465 | 5.04e-04 | 3.45e-03 | 2.11e-03 | 56 |
| Page: 1 2 3 4 |
Top |
Cell-cell communication analysis |
| Identification of potential cell-cell interactions between two cell types and their ligand-receptor pairs for different disease states |
| Ligand | Receptor | LRpair | Pathway | Tissue | Disease Stage |
| Page: 1 |
Top |
Single-cell gene regulatory network inference analysis |
| Find out the significant the regulons (TFs) and the target genes of each regulon across cell types for different disease states |
| TF | Cell Type | Tissue | Disease Stage | Target Gene | RSS | Regulon Activity |
| ∗The dot plots of a searched regulon are shown for all cell subpopulations in each disease state of each tissue based on the regulon specific score inferred using pySCENIC and by calculating the average expression. |
| Page: 1 |
Top |
Somatic mutation of malignant transformation related genes |
| Annotation of somatic variants for genes involved in malignant transformation |
| Hugo Symbol | Variant Class | Variant Classification | dbSNP RS | HGVSc | HGVSp | HGVSp Short | SWISSPROT | BIOTYPE | SIFT | PolyPhen | Tumor Sample Barcode | Tissue | Histology | Sex | Age | Stage | Therapy Types | Drugs | Outcome |
| ARID1B | SNV | Missense_Mutation | c.3481G>C | p.Glu1161Gln | p.E1161Q | Q8NFD5 | protein_coding | deleterious(0.01) | probably_damaging(0.909) | TCGA-A2-A0YK-01 | Breast | breast invasive carcinoma | Female | <65 | I/II | Chemotherapy | cytoxan | SD | |
| ARID1B | SNV | Missense_Mutation | rs774161575 | c.5331N>C | p.Lys1777Asn | p.K1777N | Q8NFD5 | protein_coding | deleterious(0.03) | benign(0.049) | TCGA-A7-A6VW-01 | Breast | breast invasive carcinoma | Female | <65 | I/II | Chemotherapy | doxorubicin | CR |
| ARID1B | SNV | Missense_Mutation | c.5348A>C | p.Lys1783Thr | p.K1783T | Q8NFD5 | protein_coding | deleterious(0.02) | possibly_damaging(0.714) | TCGA-A8-A07L-01 | Breast | breast invasive carcinoma | Female | <65 | III/IV | Chemotherapy | CR | ||
| ARID1B | SNV | Missense_Mutation | rs762698567 | c.4658N>T | p.Ala1553Val | p.A1553V | Q8NFD5 | protein_coding | tolerated_low_confidence(0.57) | benign(0.214) | TCGA-A8-A09E-01 | Breast | breast invasive carcinoma | Female | >=65 | III/IV | Hormone Therapy | anastrozole | SD |
| ARID1B | SNV | Missense_Mutation | c.3550G>T | p.Ala1184Ser | p.A1184S | Q8NFD5 | protein_coding | deleterious(0.01) | probably_damaging(0.996) | TCGA-A8-A09W-01 | Breast | breast invasive carcinoma | Female | >=65 | III/IV | Unknown | Unknown | SD | |
| ARID1B | SNV | Missense_Mutation | novel | c.6016G>T | p.Ala2006Ser | p.A2006S | Q8NFD5 | protein_coding | tolerated(0.63) | benign(0.007) | TCGA-AN-A046-01 | Breast | breast invasive carcinoma | Female | >=65 | I/II | Unknown | Unknown | SD |
| ARID1B | SNV | Missense_Mutation | c.2952C>G | p.Asn984Lys | p.N984K | Q8NFD5 | protein_coding | deleterious_low_confidence(0) | possibly_damaging(0.647) | TCGA-AO-A0J2-01 | Breast | breast invasive carcinoma | Female | <65 | I/II | Chemotherapy | cyclophosphamide | SD | |
| ARID1B | SNV | Missense_Mutation | novel | c.6440N>C | p.Arg2147Thr | p.R2147T | Q8NFD5 | protein_coding | deleterious(0.01) | possibly_damaging(0.73) | TCGA-BH-A0B6-01 | Breast | breast invasive carcinoma | Female | <65 | I/II | Unknown | Unknown | SD |
| ARID1B | SNV | Missense_Mutation | c.3724N>C | p.Asp1242His | p.D1242H | Q8NFD5 | protein_coding | deleterious_low_confidence(0) | probably_damaging(0.988) | TCGA-BH-A0W7-01 | Breast | breast invasive carcinoma | Female | <65 | I/II | Chemotherapy | taxotere | CR | |
| ARID1B | SNV | Missense_Mutation | c.5191N>C | p.Glu1731Gln | p.E1731Q | Q8NFD5 | protein_coding | tolerated(0.12) | benign(0.369) | TCGA-BH-A1EV-01 | Breast | breast invasive carcinoma | Female | <65 | III/IV | Unknown | Unknown | PD |
| Page: 1 2 3 4 5 6 7 8 9 10 11 12 13 14 15 16 17 18 19 20 21 22 23 24 |
Top |
Related drugs of malignant transformation related genes |
| Identification of chemicals and drugs interact with genes involved in malignant transfromation |
| (DGIdb 4.0) |
| Entrez ID | Symbol | Category | Interaction Types | Drug Claim Name | Drug Name | PMIDs |
| Page: 1 |

Copyright 2023-Present -The University of Texas Health Science Center at Houston |