
|
|||||
|
 | |
| |
| |
| |
| |
| |
|
Gene: ARID1A |
Gene summary for ARID1A |
| Gene information | Species | Human | Gene symbol | ARID1A | Gene ID | 8289 |
| Gene name | AT-rich interaction domain 1A | |
| Gene Alias | B120 | |
| Cytomap | 1p36.11 | |
| Gene Type | protein-coding | GO ID | GO:0006139 | UniProtAcc | O14497 |
Top |
Malignant transformation analysis |
| Identification of the aberrant gene expression in precancerous and cancerous lesions by comparing the gene expression of stem-like cells in diseased tissues with normal stem cells |
| Entrez ID | Symbol | Replicates | Species | Organ | Tissue | Adj P-value | Log2FC | Malignancy |
| 8289 | ARID1A | CA_HPV_1 | Human | Cervix | CC | 2.85e-02 | -1.20e-01 | 0.0264 |
| 8289 | ARID1A | CCI_1 | Human | Cervix | CC | 2.64e-05 | 7.43e-01 | 0.528 |
| 8289 | ARID1A | CCI_3 | Human | Cervix | CC | 1.22e-07 | 7.24e-01 | 0.516 |
| 8289 | ARID1A | HTA11_3410_2000001011 | Human | Colorectum | AD | 1.08e-04 | -2.54e-01 | 0.0155 |
| 8289 | ARID1A | HTA11_5212_2000001011 | Human | Colorectum | AD | 7.23e-04 | -4.53e-01 | -0.2061 |
| 8289 | ARID1A | HTA11_6818_2000001021 | Human | Colorectum | AD | 1.34e-05 | -4.65e-01 | 0.0588 |
| 8289 | ARID1A | HTA11_99999974143_84620 | Human | Colorectum | MSS | 2.86e-06 | -3.15e-01 | 0.3005 |
| 8289 | ARID1A | F007 | Human | Colorectum | FAP | 2.89e-02 | -2.21e-01 | 0.1176 |
| 8289 | ARID1A | A001-C-207 | Human | Colorectum | FAP | 1.68e-03 | -1.87e-01 | 0.1278 |
| 8289 | ARID1A | A015-C-203 | Human | Colorectum | FAP | 8.45e-34 | -3.65e-01 | -0.1294 |
| 8289 | ARID1A | A015-C-204 | Human | Colorectum | FAP | 8.43e-07 | -2.54e-01 | -0.0228 |
| 8289 | ARID1A | A014-C-040 | Human | Colorectum | FAP | 4.34e-08 | -4.15e-01 | -0.1184 |
| 8289 | ARID1A | A002-C-201 | Human | Colorectum | FAP | 4.32e-16 | -3.41e-01 | 0.0324 |
| 8289 | ARID1A | A002-C-203 | Human | Colorectum | FAP | 3.08e-05 | -1.27e-01 | 0.2786 |
| 8289 | ARID1A | A001-C-119 | Human | Colorectum | FAP | 3.04e-08 | -3.31e-01 | -0.1557 |
| 8289 | ARID1A | A001-C-108 | Human | Colorectum | FAP | 1.50e-20 | -3.30e-01 | -0.0272 |
| 8289 | ARID1A | A002-C-205 | Human | Colorectum | FAP | 1.51e-23 | -2.30e-01 | -0.1236 |
| 8289 | ARID1A | A001-C-104 | Human | Colorectum | FAP | 1.87e-08 | -3.15e-01 | 0.0184 |
| 8289 | ARID1A | A015-C-005 | Human | Colorectum | FAP | 1.93e-05 | -3.04e-01 | -0.0336 |
| 8289 | ARID1A | A015-C-006 | Human | Colorectum | FAP | 3.40e-18 | -4.18e-01 | -0.0994 |
| Page: 1 2 3 4 5 6 7 8 9 |
| Tissue | Expression Dynamics | Abbreviation |
| Cervix | 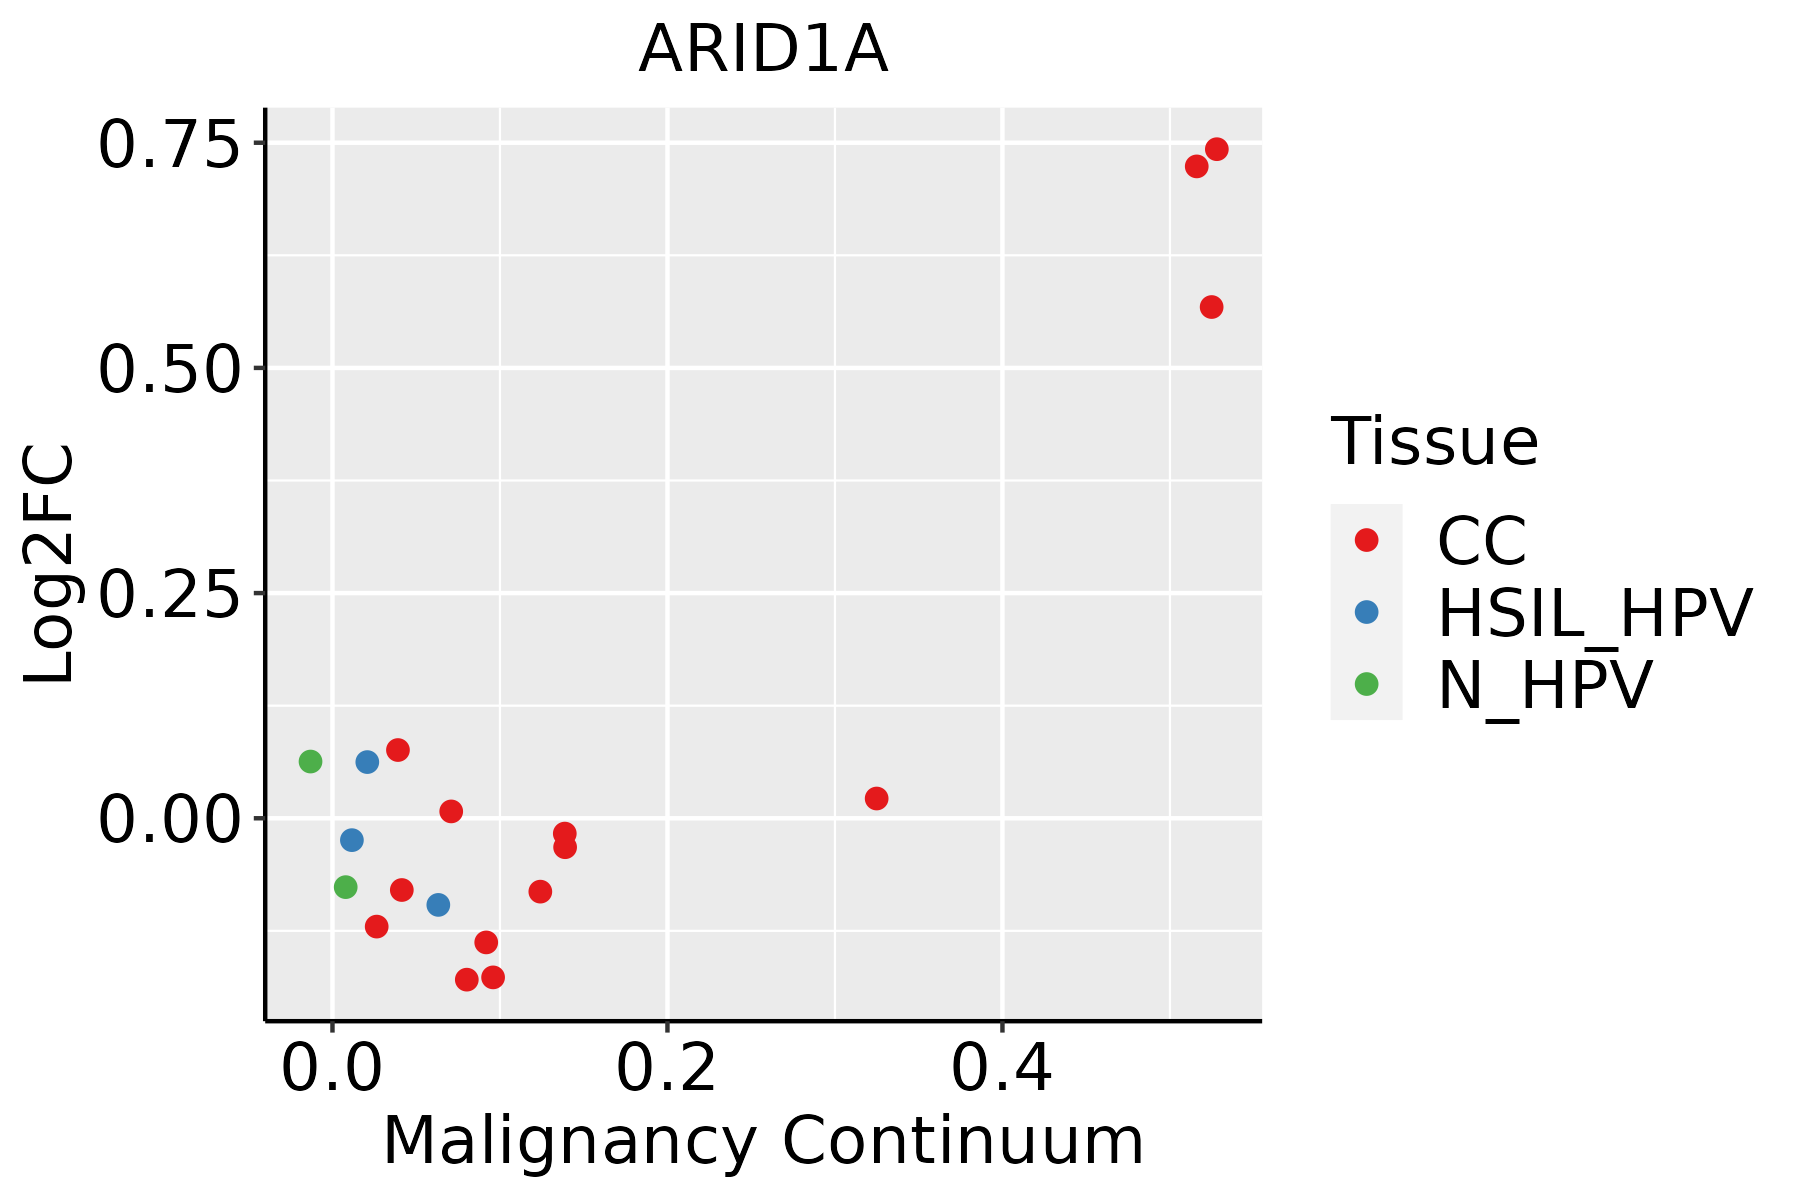 | CC: Cervix cancer |
| HSIL_HPV: HPV-infected high-grade squamous intraepithelial lesions | ||
| N_HPV: HPV-infected normal cervix | ||
| Colorectum (GSE201348) | 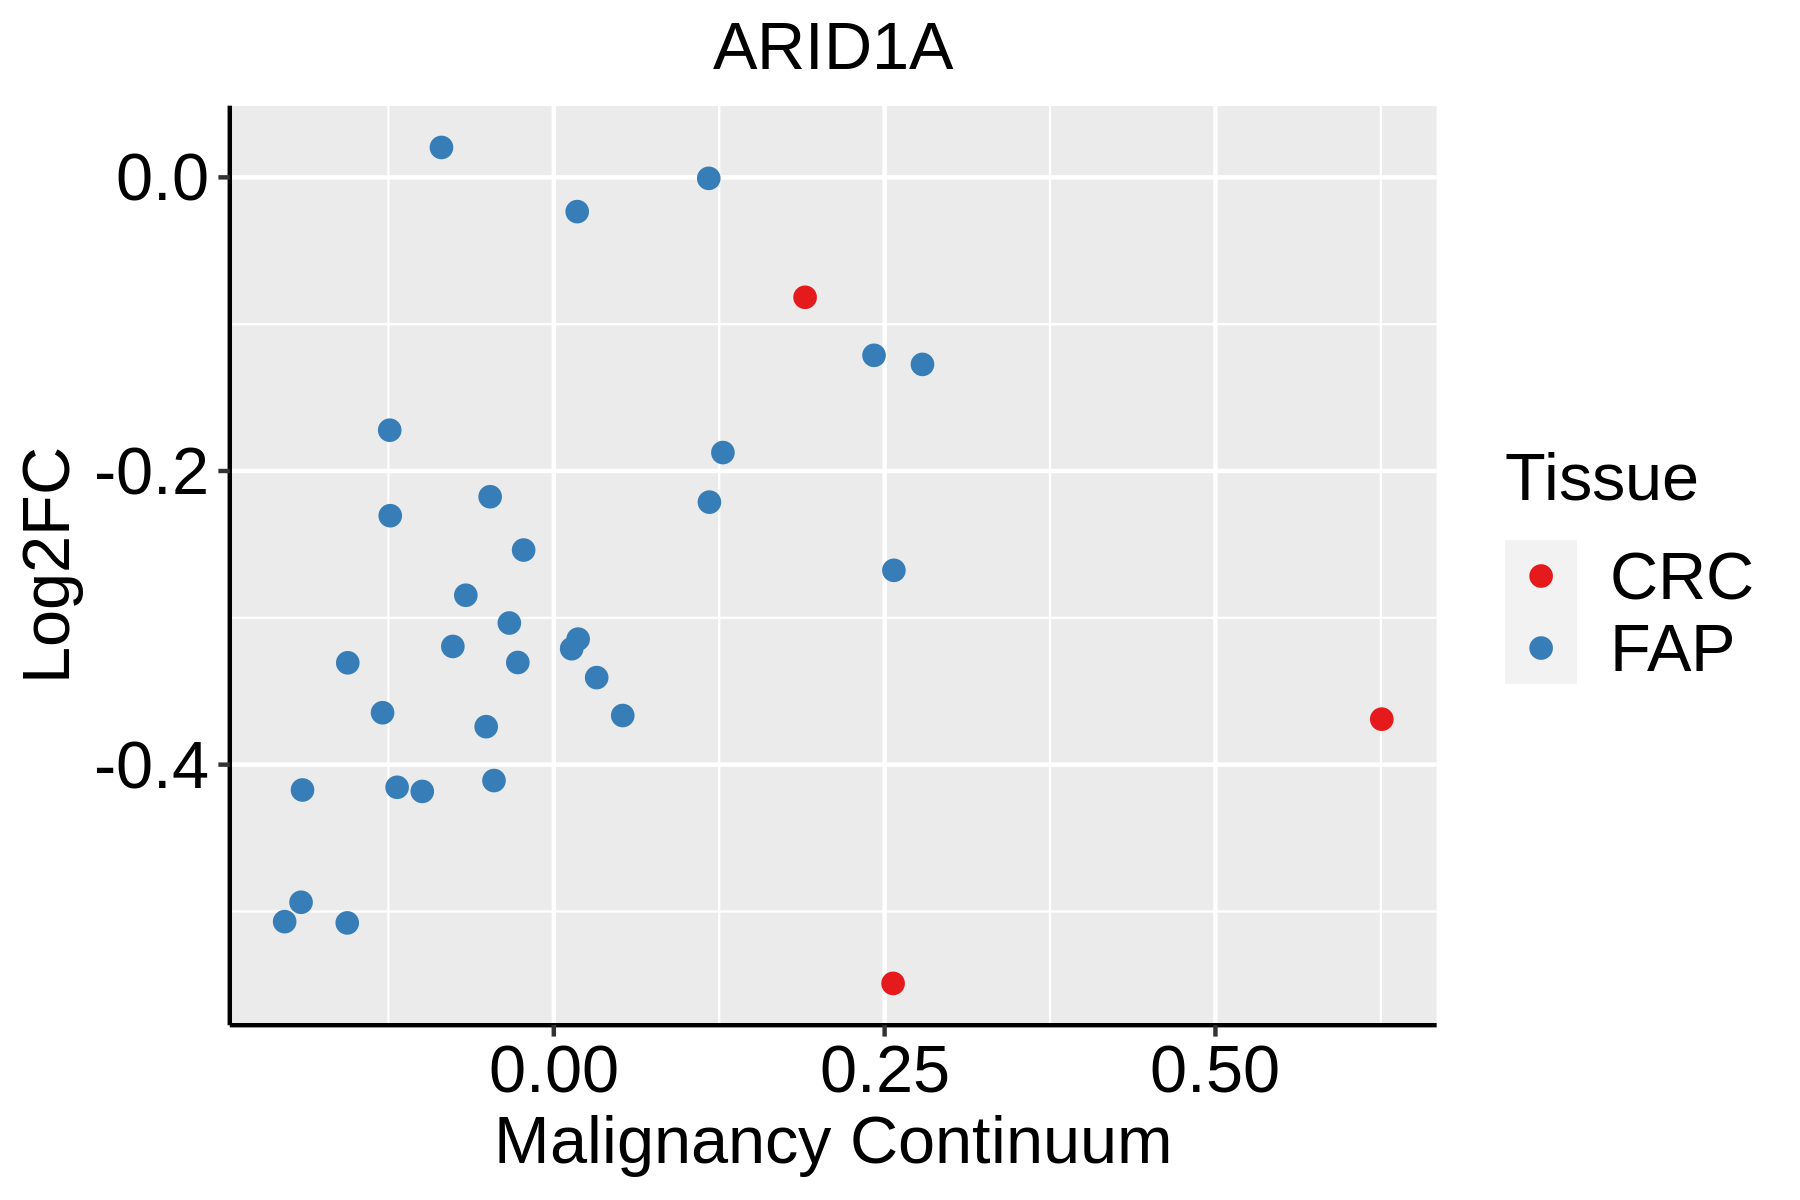 | FAP: Familial adenomatous polyposis |
| CRC: Colorectal cancer | ||
| Colorectum (HTA11) | 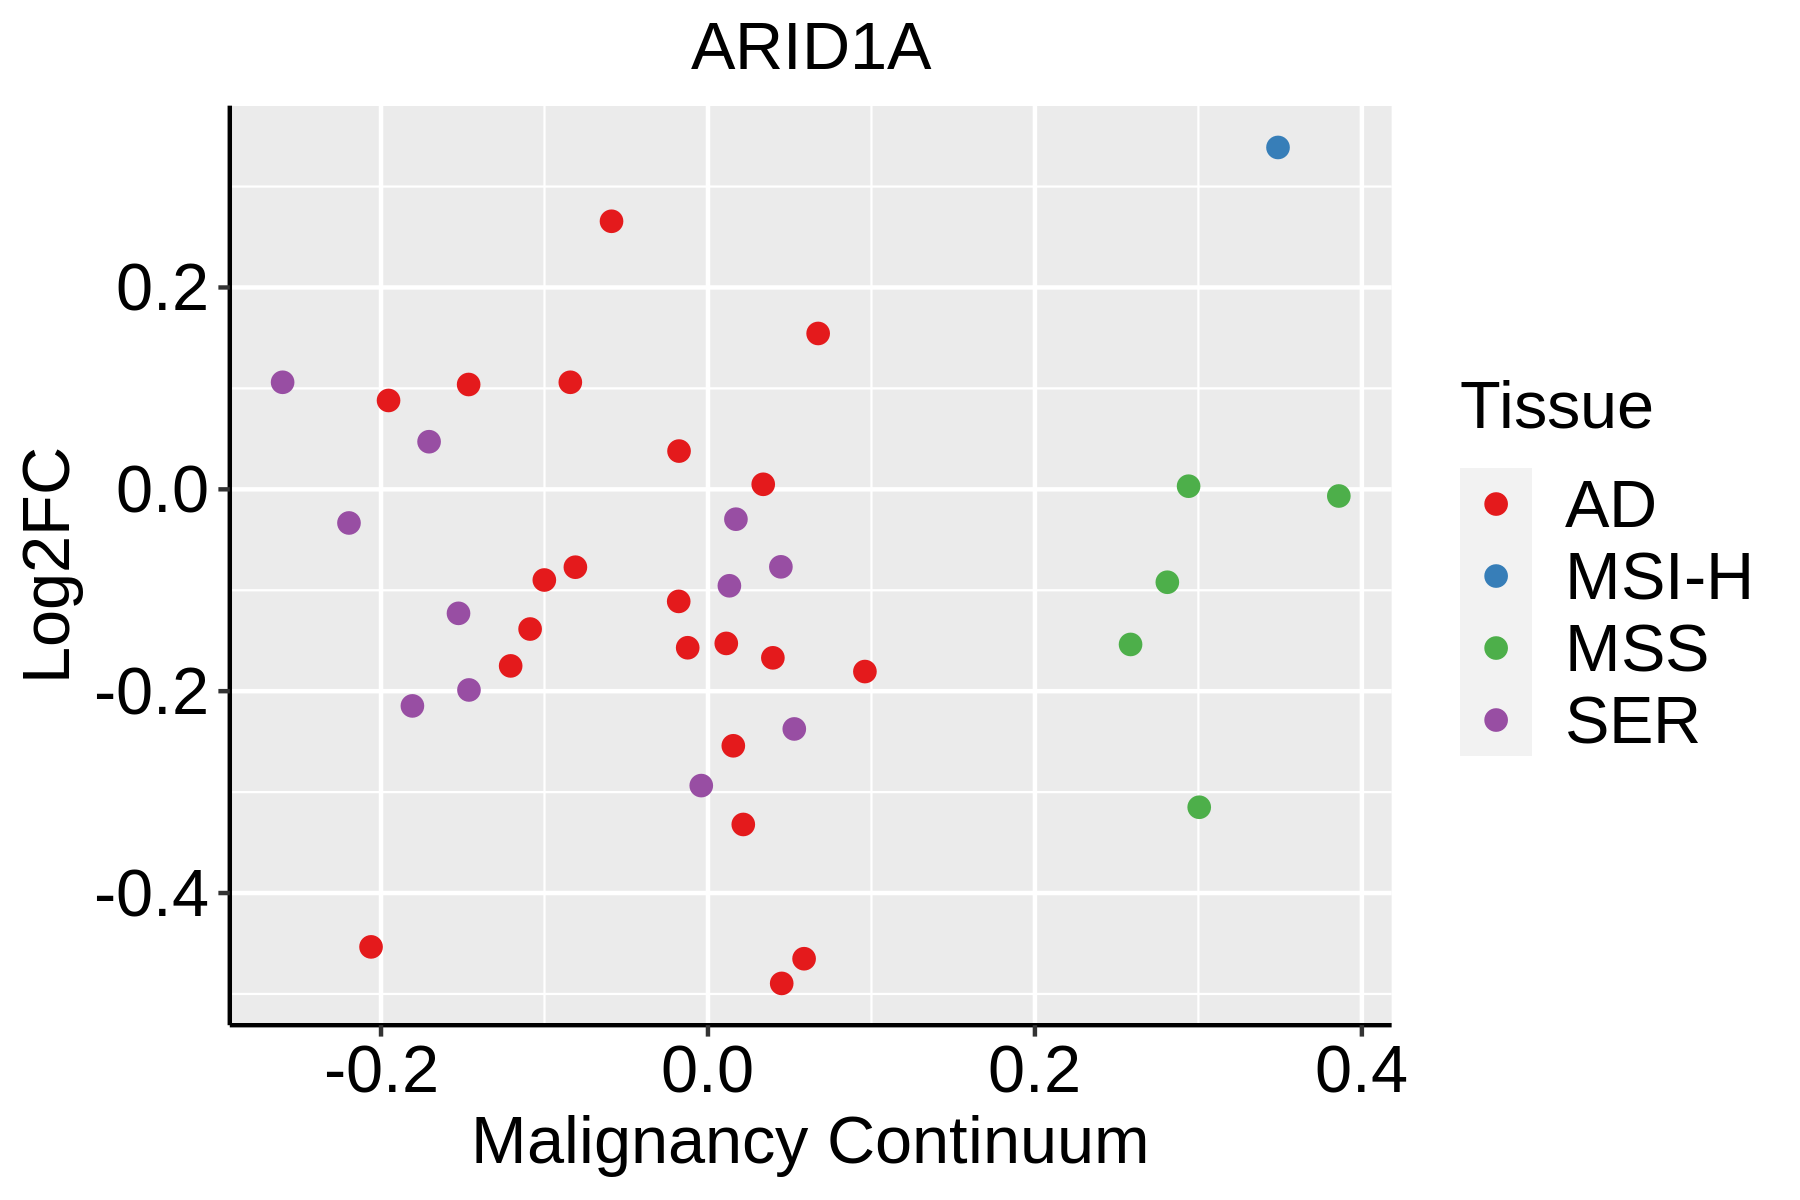 | AD: Adenomas |
| SER: Sessile serrated lesions | ||
| MSI-H: Microsatellite-high colorectal cancer | ||
| MSS: Microsatellite stable colorectal cancer | ||
| Esophagus |  | ESCC: Esophageal squamous cell carcinoma |
| HGIN: High-grade intraepithelial neoplasias | ||
| LGIN: Low-grade intraepithelial neoplasias | ||
| Liver |  | HCC: Hepatocellular carcinoma |
| NAFLD: Non-alcoholic fatty liver disease | ||
| Oral Cavity | 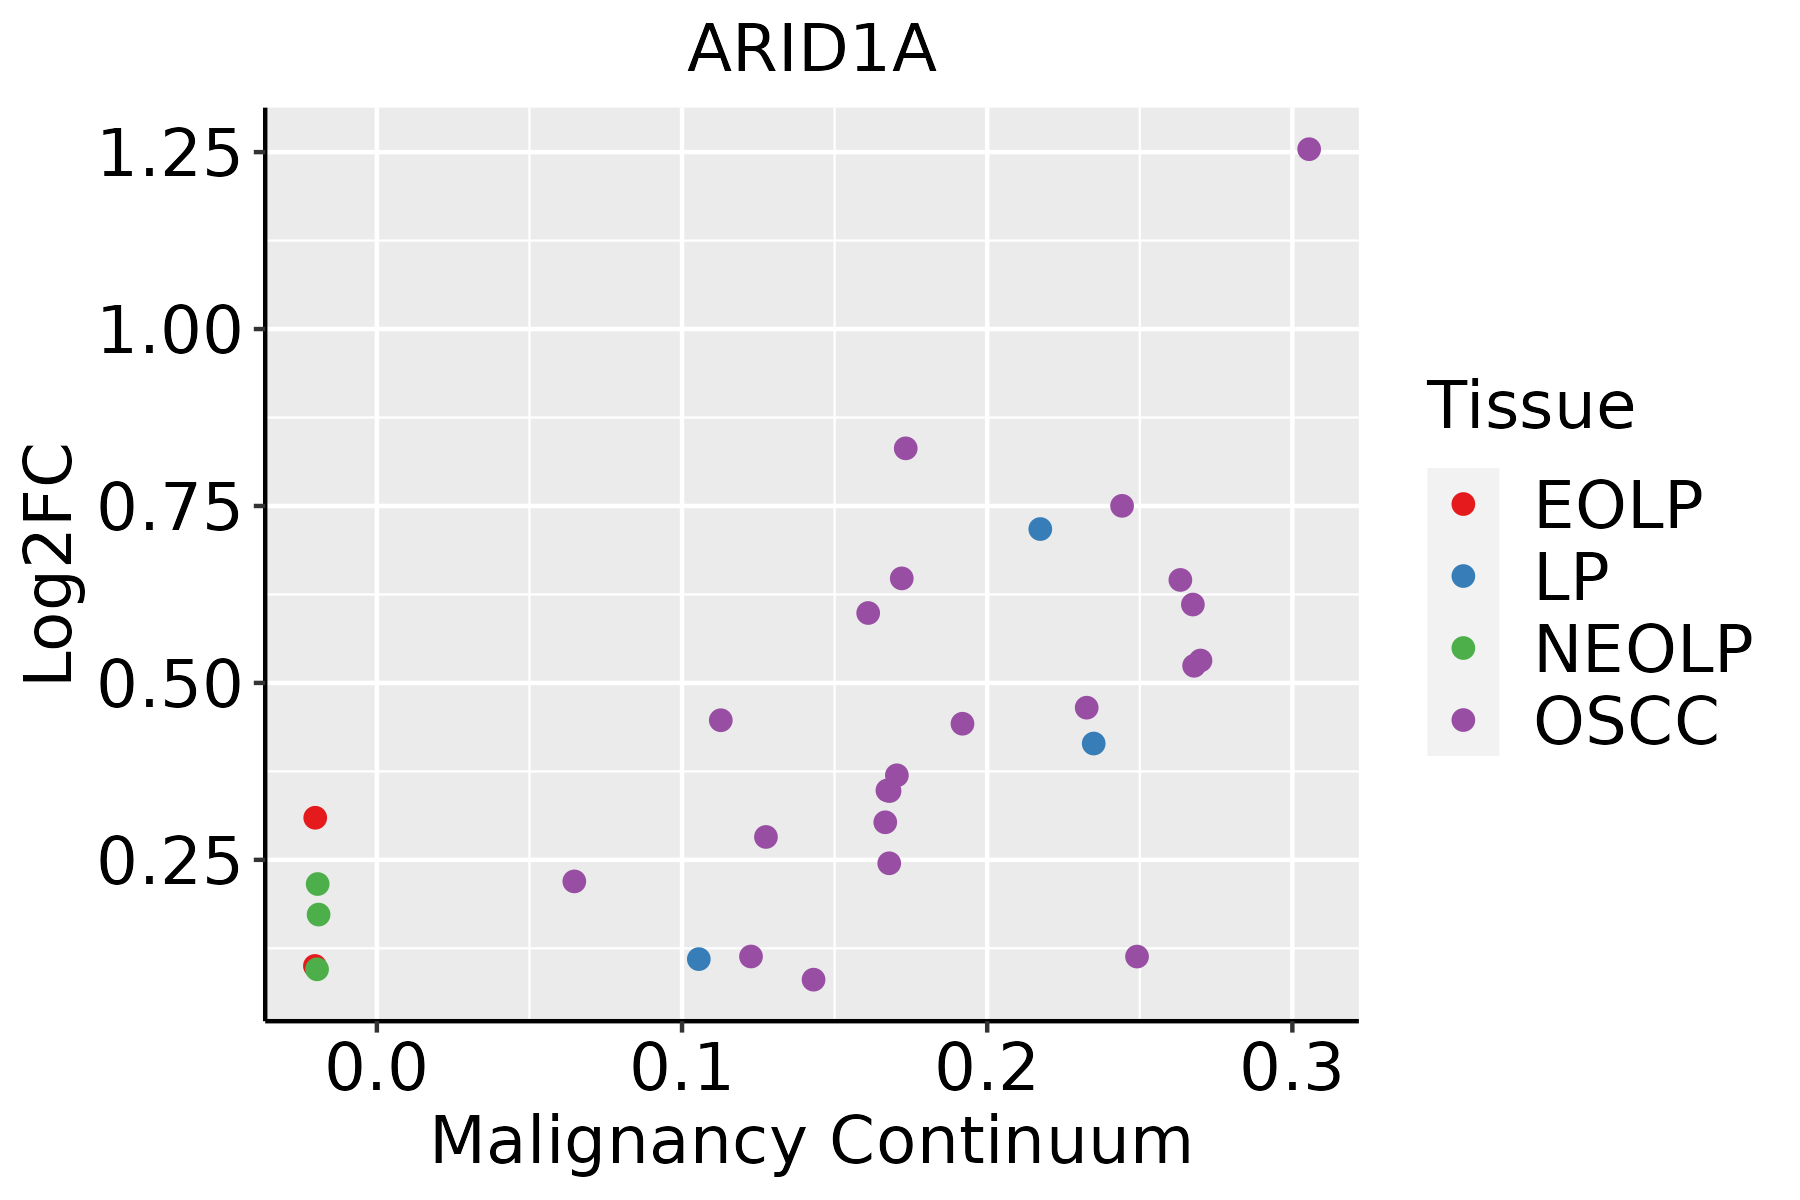 | EOLP: Erosive Oral lichen planus |
| LP: leukoplakia | ||
| NEOLP: Non-erosive oral lichen planus | ||
| OSCC: Oral squamous cell carcinoma | ||
| Prostate |  | BPH: Benign Prostatic Hyperplasia |
| Skin | 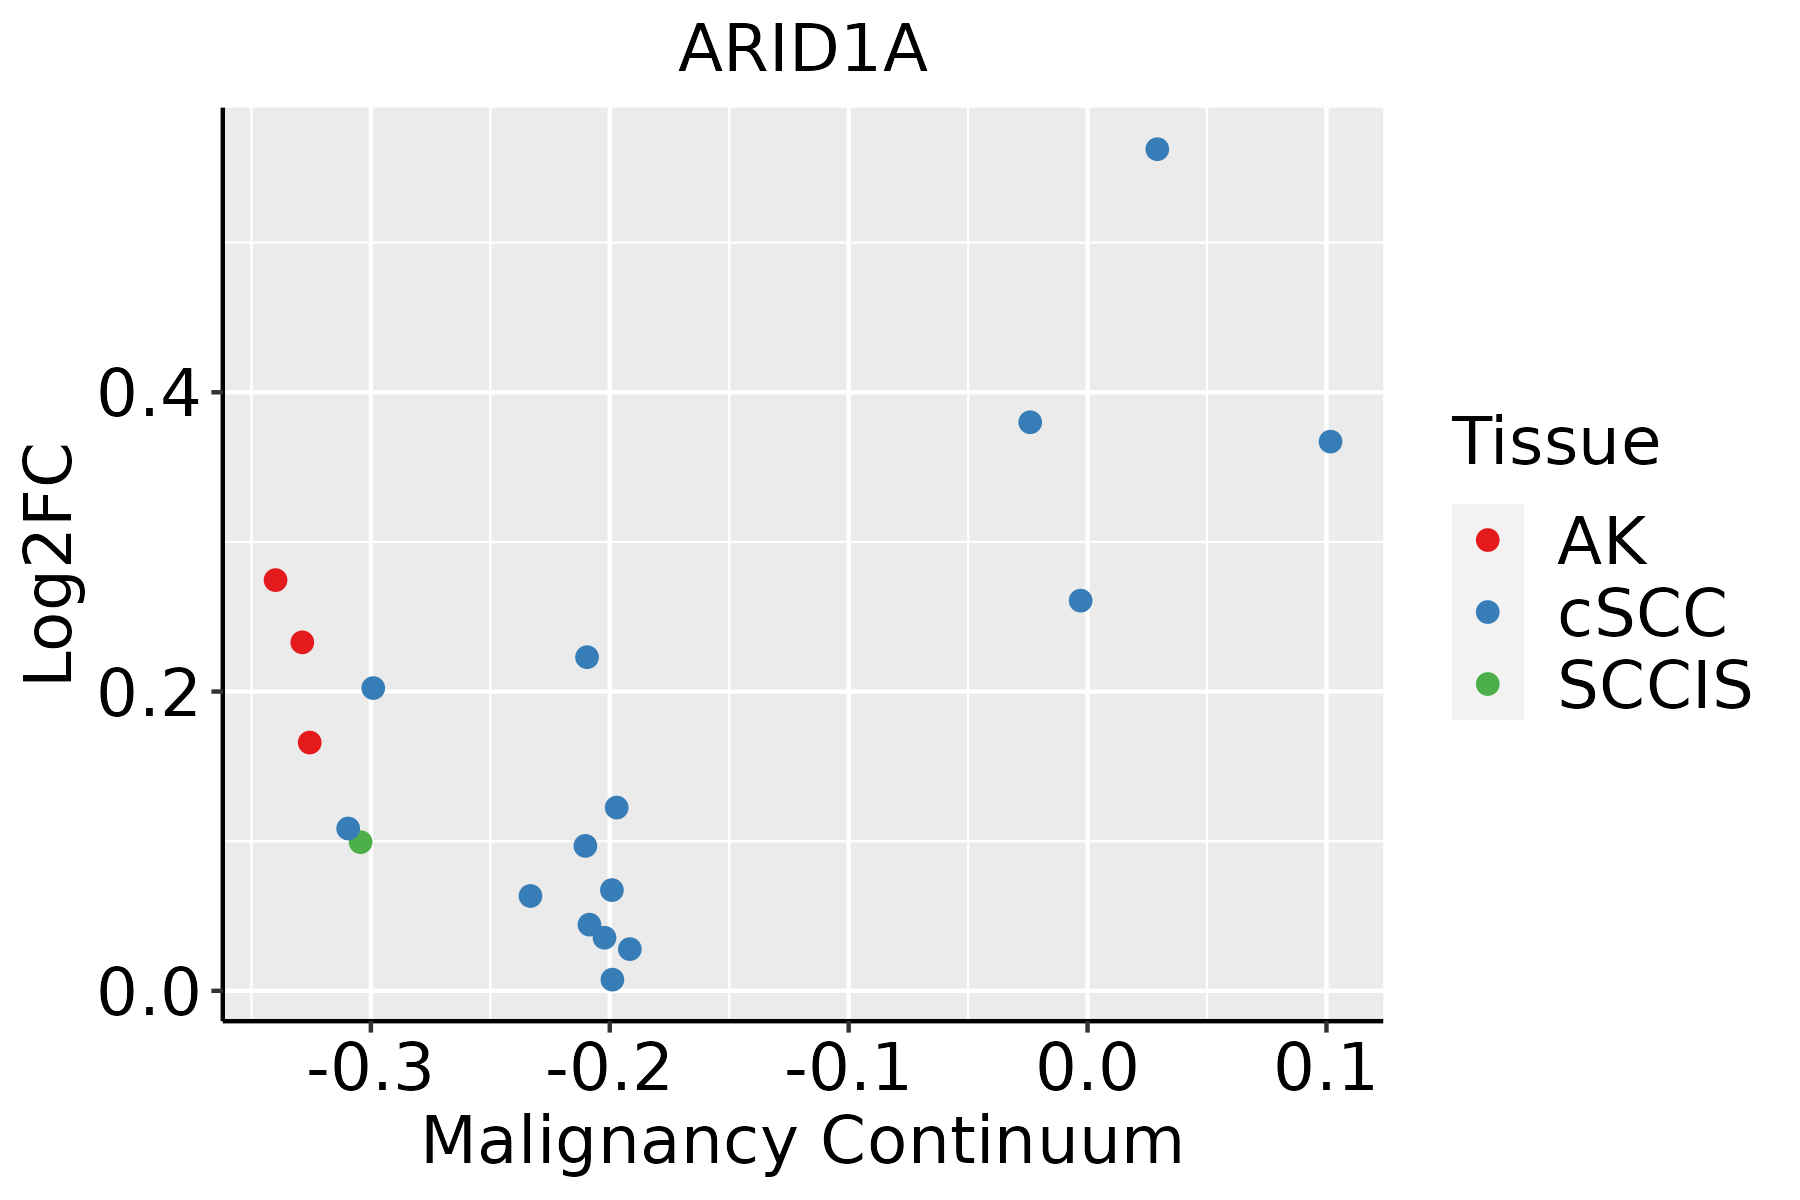 | AK: Actinic keratosis |
| cSCC: Cutaneous squamous cell carcinoma | ||
| SCCIS:squamous cell carcinoma in situ | ||
| Thyroid |  | ATC: Anaplastic thyroid cancer |
| HT: Hashimoto's thyroiditis | ||
| PTC: Papillary thyroid cancer |
| ∗log2FC in expression of this searched gene in stem-like cells from each diseased tissue sample relative to stem-like cells in normal samples in each tissue plotted against the malignancy continuum. Samples are colored based on if they are from different disease stage. |
Top |
Malignant transformation related pathway analysis |
| Find out the enriched GO biological processes and KEGG pathways involved in transition from healthy to precancer to cancer |
| Tissue | Disease Stage | Enriched GO biological Processes |
| Colorectum | AD |  |
| Colorectum | SER |  |
| Colorectum | MSS |  |
| Colorectum | MSI-H |  |
| Colorectum | FAP |  |
| ∗Top 15 enriched GO BP terms are showed in the bar plot of each disease state in each tissue. Each row represents a significant GO biological process which is colored according to the -log10(p.adjust). |
| Page: 1 2 3 4 5 6 7 8 9 |
| GO ID | Tissue | Disease Stage | Description | Gene Ratio | Bg Ratio | pvalue | p.adjust | Count |
| GO:004854510 | Cervix | CC | response to steroid hormone | 74/2311 | 339/18723 | 5.71e-07 | 2.09e-05 | 74 |
| GO:00305229 | Cervix | CC | intracellular receptor signaling pathway | 60/2311 | 265/18723 | 1.89e-06 | 5.97e-05 | 60 |
| GO:00063257 | Cervix | CC | chromatin organization | 78/2311 | 409/18723 | 5.40e-05 | 8.02e-04 | 78 |
| GO:002241110 | Cervix | CC | cellular component disassembly | 83/2311 | 443/18723 | 6.04e-05 | 8.68e-04 | 83 |
| GO:00713839 | Cervix | CC | cellular response to steroid hormone stimulus | 40/2311 | 204/18723 | 1.93e-03 | 1.42e-02 | 40 |
| GO:00305188 | Cervix | CC | intracellular steroid hormone receptor signaling pathway | 25/2311 | 116/18723 | 3.59e-03 | 2.30e-02 | 25 |
| GO:00063684 | Cervix | CC | transcription elongation from RNA polymerase II promoter | 17/2311 | 69/18723 | 3.65e-03 | 2.33e-02 | 17 |
| GO:00305218 | Cervix | CC | androgen receptor signaling pathway | 12/2311 | 44/18723 | 5.76e-03 | 3.30e-02 | 12 |
| GO:00329847 | Cervix | CC | protein-containing complex disassembly | 41/2311 | 224/18723 | 6.13e-03 | 3.48e-02 | 41 |
| GO:00063545 | Cervix | CC | DNA-templated transcription, elongation | 20/2311 | 91/18723 | 6.88e-03 | 3.74e-02 | 20 |
| GO:00063381 | Cervix | CC | chromatin remodeling | 45/2311 | 255/18723 | 8.33e-03 | 4.30e-02 | 45 |
| GO:0022411 | Colorectum | AD | cellular component disassembly | 147/3918 | 443/18723 | 8.53e-10 | 6.76e-08 | 147 |
| GO:0032984 | Colorectum | AD | protein-containing complex disassembly | 81/3918 | 224/18723 | 9.41e-08 | 4.65e-06 | 81 |
| GO:0071383 | Colorectum | AD | cellular response to steroid hormone stimulus | 73/3918 | 204/18723 | 6.31e-07 | 2.24e-05 | 73 |
| GO:0030522 | Colorectum | AD | intracellular receptor signaling pathway | 87/3918 | 265/18723 | 3.69e-06 | 1.03e-04 | 87 |
| GO:0043401 | Colorectum | AD | steroid hormone mediated signaling pathway | 51/3918 | 136/18723 | 6.52e-06 | 1.63e-04 | 51 |
| GO:0048545 | Colorectum | AD | response to steroid hormone | 104/3918 | 339/18723 | 1.33e-05 | 2.90e-04 | 104 |
| GO:0009755 | Colorectum | AD | hormone-mediated signaling pathway | 64/3918 | 190/18723 | 2.78e-05 | 5.24e-04 | 64 |
| GO:0030518 | Colorectum | AD | intracellular steroid hormone receptor signaling pathway | 43/3918 | 116/18723 | 4.61e-05 | 7.97e-04 | 43 |
| GO:0006325 | Colorectum | AD | chromatin organization | 119/3918 | 409/18723 | 4.85e-05 | 8.33e-04 | 119 |
| Page: 1 2 3 4 5 6 7 8 9 10 11 12 13 14 15 16 17 |
| Pathway ID | Tissue | Disease Stage | Description | Gene Ratio | Bg Ratio | pvalue | p.adjust | qvalue | Count |
| hsa0471420 | Cervix | CC | Thermogenesis | 76/1267 | 232/8465 | 4.29e-12 | 1.16e-10 | 6.85e-11 | 76 |
| hsa0522510 | Cervix | CC | Hepatocellular carcinoma | 40/1267 | 168/8465 | 1.52e-03 | 6.39e-03 | 3.78e-03 | 40 |
| hsa04714110 | Cervix | CC | Thermogenesis | 76/1267 | 232/8465 | 4.29e-12 | 1.16e-10 | 6.85e-11 | 76 |
| hsa0522513 | Cervix | CC | Hepatocellular carcinoma | 40/1267 | 168/8465 | 1.52e-03 | 6.39e-03 | 3.78e-03 | 40 |
| hsa04714 | Colorectum | AD | Thermogenesis | 120/2092 | 232/8465 | 2.76e-19 | 1.16e-17 | 7.37e-18 | 120 |
| hsa05225 | Colorectum | AD | Hepatocellular carcinoma | 59/2092 | 168/8465 | 1.50e-03 | 8.69e-03 | 5.54e-03 | 59 |
| hsa047141 | Colorectum | AD | Thermogenesis | 120/2092 | 232/8465 | 2.76e-19 | 1.16e-17 | 7.37e-18 | 120 |
| hsa052251 | Colorectum | AD | Hepatocellular carcinoma | 59/2092 | 168/8465 | 1.50e-03 | 8.69e-03 | 5.54e-03 | 59 |
| hsa047144 | Colorectum | MSS | Thermogenesis | 113/1875 | 232/8465 | 1.52e-19 | 4.62e-18 | 2.83e-18 | 113 |
| hsa052252 | Colorectum | MSS | Hepatocellular carcinoma | 56/1875 | 168/8465 | 5.04e-04 | 3.45e-03 | 2.11e-03 | 56 |
| hsa047145 | Colorectum | MSS | Thermogenesis | 113/1875 | 232/8465 | 1.52e-19 | 4.62e-18 | 2.83e-18 | 113 |
| hsa052253 | Colorectum | MSS | Hepatocellular carcinoma | 56/1875 | 168/8465 | 5.04e-04 | 3.45e-03 | 2.11e-03 | 56 |
| hsa047148 | Colorectum | FAP | Thermogenesis | 70/1404 | 232/8465 | 1.38e-07 | 3.08e-06 | 1.87e-06 | 70 |
| hsa052254 | Colorectum | FAP | Hepatocellular carcinoma | 43/1404 | 168/8465 | 1.78e-03 | 8.99e-03 | 5.47e-03 | 43 |
| hsa047149 | Colorectum | FAP | Thermogenesis | 70/1404 | 232/8465 | 1.38e-07 | 3.08e-06 | 1.87e-06 | 70 |
| hsa052255 | Colorectum | FAP | Hepatocellular carcinoma | 43/1404 | 168/8465 | 1.78e-03 | 8.99e-03 | 5.47e-03 | 43 |
| hsa052256 | Colorectum | CRC | Hepatocellular carcinoma | 37/1091 | 168/8465 | 6.38e-04 | 5.89e-03 | 3.99e-03 | 37 |
| hsa052257 | Colorectum | CRC | Hepatocellular carcinoma | 37/1091 | 168/8465 | 6.38e-04 | 5.89e-03 | 3.99e-03 | 37 |
| hsa0471439 | Esophagus | HGIN | Thermogenesis | 91/1383 | 232/8465 | 1.97e-17 | 5.36e-16 | 4.25e-16 | 91 |
| hsa04714114 | Esophagus | HGIN | Thermogenesis | 91/1383 | 232/8465 | 1.97e-17 | 5.36e-16 | 4.25e-16 | 91 |
| Page: 1 2 3 |
Top |
Cell-cell communication analysis |
| Identification of potential cell-cell interactions between two cell types and their ligand-receptor pairs for different disease states |
| Ligand | Receptor | LRpair | Pathway | Tissue | Disease Stage |
| Page: 1 |
Top |
Single-cell gene regulatory network inference analysis |
| Find out the significant the regulons (TFs) and the target genes of each regulon across cell types for different disease states |
| TF | Cell Type | Tissue | Disease Stage | Target Gene | RSS | Regulon Activity |
| ∗The dot plots of a searched regulon are shown for all cell subpopulations in each disease state of each tissue based on the regulon specific score inferred using pySCENIC and by calculating the average expression. |
| Page: 1 |
Top |
Somatic mutation of malignant transformation related genes |
| Annotation of somatic variants for genes involved in malignant transformation |
| Hugo Symbol | Variant Class | Variant Classification | dbSNP RS | HGVSc | HGVSp | HGVSp Short | SWISSPROT | BIOTYPE | SIFT | PolyPhen | Tumor Sample Barcode | Tissue | Histology | Sex | Age | Stage | Therapy Types | Drugs | Outcome |
| ARID1A | SNV | Missense_Mutation | novel | c.5834N>T | p.Pro1945Leu | p.P1945L | O14497 | protein_coding | tolerated(0.09) | probably_damaging(0.997) | TCGA-5L-AAT1-01 | Breast | breast invasive carcinoma | Female | <65 | III/IV | Hormone Therapy | letrozol | SD |
| ARID1A | SNV | Missense_Mutation | c.6427N>T | p.Arg2143Cys | p.R2143C | O14497 | protein_coding | deleterious(0) | probably_damaging(0.999) | TCGA-A1-A0SP-01 | Breast | breast invasive carcinoma | Female | <65 | I/II | Chemotherapy | SD | ||
| ARID1A | SNV | Missense_Mutation | c.5747N>G | p.Ser1916Cys | p.S1916C | O14497 | protein_coding | tolerated(0.29) | benign(0.007) | TCGA-A8-A07I-01 | Breast | breast invasive carcinoma | Female | >=65 | III/IV | Chemotherapy | 5-fluorouracil | CR | |
| ARID1A | SNV | Missense_Mutation | c.2644N>T | p.Gly882Trp | p.G882W | O14497 | protein_coding | deleterious(0) | probably_damaging(1) | TCGA-A8-A07R-01 | Breast | breast invasive carcinoma | Female | >=65 | III/IV | Ancillary | zoledronic | SD | |
| ARID1A | SNV | Missense_Mutation | novel | c.3331N>A | p.Glu1111Lys | p.E1111K | O14497 | protein_coding | deleterious(0.03) | probably_damaging(0.989) | TCGA-A8-A09A-01 | Breast | breast invasive carcinoma | Female | <65 | I/II | Hormone Therapy | tamoxiphen | SD |
| ARID1A | SNV | Missense_Mutation | c.3819G>A | p.Met1273Ile | p.M1273I | O14497 | protein_coding | deleterious(0.03) | benign(0.065) | TCGA-AC-A23H-01 | Breast | breast invasive carcinoma | Female | >=65 | I/II | Unknown | Unknown | PD | |
| ARID1A | SNV | Missense_Mutation | novel | c.2663G>A | p.Gly888Glu | p.G888E | O14497 | protein_coding | deleterious(0.04) | possibly_damaging(0.722) | TCGA-AR-A1AI-01 | Breast | breast invasive carcinoma | Female | <65 | I/II | Chemotherapy | cytoxan | PD |
| ARID1A | SNV | Missense_Mutation | novel | c.1388G>T | p.Gly463Val | p.G463V | O14497 | protein_coding | tolerated_low_confidence(0.05) | possibly_damaging(0.593) | TCGA-AR-A24X-01 | Breast | breast invasive carcinoma | Female | <65 | I/II | Hormone Therapy | tamoxiphen | SD |
| ARID1A | SNV | Missense_Mutation | c.3715N>A | p.Ala1239Thr | p.A1239T | O14497 | protein_coding | tolerated(0.12) | benign(0.214) | TCGA-BH-A0E7-01 | Breast | breast invasive carcinoma | Female | >=65 | I/II | Hormone Therapy | arimidex | SD | |
| ARID1A | SNV | Missense_Mutation | c.2542N>T | p.Pro848Ser | p.P848S | O14497 | protein_coding | tolerated(0.12) | benign(0.091) | TCGA-BH-A0EE-01 | Breast | breast invasive carcinoma | Female | >=65 | I/II | Chemotherapy | docetaxel | SD |
| Page: 1 2 3 4 5 6 7 8 9 10 11 12 13 14 15 16 17 18 19 20 21 22 23 24 25 26 27 28 29 30 31 32 33 34 35 |
Top |
Related drugs of malignant transformation related genes |
| Identification of chemicals and drugs interact with genes involved in malignant transfromation |
| (DGIdb 4.0) |
| Entrez ID | Symbol | Category | Interaction Types | Drug Claim Name | Drug Name | PMIDs |
| 8289 | ARID1A | CLINICALLY ACTIONABLE | NIVOLUMAB | NIVOLUMAB | 29736026 | |
| 8289 | ARID1A | CLINICALLY ACTIONABLE | GSK126 | 25686104 | ||
| 8289 | ARID1A | CLINICALLY ACTIONABLE | DASATINIB | DASATINIB | 27364904 | |
| 8289 | ARID1A | CLINICALLY ACTIONABLE | SORAFENIB | SORAFENIB | 29113912 | |
| 8289 | ARID1A | CLINICALLY ACTIONABLE | ATEZOLIZUMAB | ATEZOLIZUMAB | 29736026 | |
| 8289 | ARID1A | CLINICALLY ACTIONABLE | PEMBROLIZUMAB | PEMBROLIZUMAB | 29736026 |
| Page: 1 |

Copyright 2023-Present -The University of Texas Health Science Center at Houston |