Schematic overview of the cellular and molecular mechanisms involved in the cancer progression, including the proposed cellular and molecular mechanisms in cancer cells trajectory. AT1: alveolar type 1 cells; AT2: alveolar type 2 cells; AAH: atypical adenomatous hyperplasia; AIS: adenocarcinoma in situ; MIA: minimally invasive adenocarcinoma; IA: invasive adenocarcinoma; EMT: epithelial-mesenchymal transition

Home

Download

Statistics

Help

Contact

Center for Computational Systems Medicine
leaf

Gene summary

leaf

Malignant transformation analysis

leaf

Malignant transformation related pathway analysis

leaf

Cell-cell communication analysis

leaf

Single-cell gene regulatory network inference analysis

leaf

Somatic mutation of malignant transformation related genes

leaf

Related drugs of malignant transformation related genes

Gene: ARHGEF5

Gene summary for ARHGEF5

check button Gene summary.

Gene informationSpeciesHuman
Gene symbol

ARHGEF5

Gene ID

7984

Gene nameRho guanine nucleotide exchange factor 5
Gene AliasGEF5
Cytomap7q35
Gene Typeprotein-coding
GO ID

GO:0000165

UniProtAcc

Q12774


Top

Malignant transformation analysis

check button Identification of the aberrant gene expression in precancerous and cancerous lesions by comparing the gene expression of stem-like cells in diseased tissues with normal stem cells
check button Malignant transformation involving gene list.
Entrez IDSymbolReplicatesSpeciesOrganTissueAdj P-valueLog2FCMalignancy
7984ARHGEF5HTA11_2487_2000001011HumanColorectumSER9.17e-053.33e-01-0.1808
7984ARHGEF5HTA11_1938_2000001011HumanColorectumAD2.19e-022.66e-01-0.0811
7984ARHGEF5HTA11_78_2000001011HumanColorectumAD5.17e-032.06e-01-0.1088
7984ARHGEF5HTA11_347_2000001011HumanColorectumAD5.26e-072.99e-01-0.1954
7984ARHGEF5HTA11_411_2000001011HumanColorectumSER1.38e-025.76e-01-0.2602
7984ARHGEF5HTA11_2112_2000001011HumanColorectumSER2.77e-034.75e-01-0.2196
7984ARHGEF5HTA11_83_2000001011HumanColorectumSER4.95e-044.03e-01-0.1526
7984ARHGEF5HTA11_696_2000001011HumanColorectumAD1.94e-062.52e-01-0.1464
7984ARHGEF5HTA11_1391_2000001011HumanColorectumAD1.50e-104.34e-01-0.059
7984ARHGEF5HTA11_866_3004761011HumanColorectumAD3.27e-021.87e-010.096
7984ARHGEF5HTA11_10711_2000001011HumanColorectumAD2.96e-032.17e-010.0338
7984ARHGEF5HTA11_6818_2000001011HumanColorectumAD4.13e-022.92e-010.0112
7984ARHGEF5HTA11_6818_2000001021HumanColorectumAD1.34e-032.37e-010.0588
7984ARHGEF5HTA11_99999970781_79442HumanColorectumMSS7.78e-042.45e-010.294
7984ARHGEF5HTA11_99999965104_69814HumanColorectumMSS2.15e-033.04e-010.281
7984ARHGEF5HTA11_99999971662_82457HumanColorectumMSS4.15e-093.78e-010.3859
7984ARHGEF5HTA11_99999973899_84307HumanColorectumMSS4.56e-042.89e-010.2585
7984ARHGEF5LZE4THumanEsophagusESCC7.58e-114.61e-010.0811
7984ARHGEF5LZE5THumanEsophagusESCC4.77e-031.69e-010.0514
7984ARHGEF5LZE7THumanEsophagusESCC2.02e-053.22e-010.0667
Page: 1 2 3 4 5 6 

check button Transcriptomic changes along malignancy continuum.
TissueExpression DynamicsAbbreviation
Colorectum (GSE201348)The image shows the transcriptomic changes along malignancy continuum.log2FC in expression of this searched gene in stem-like cells from each diseased tissue sample relative to stem-like cells in normal samples in each tissue plotted against the malignancy continuum. Samples are colored based on if they are from different disease stage.FAP: Familial adenomatous polyposis
CRC: Colorectal cancer
Colorectum (HTA11)The image shows the transcriptomic changes along malignancy continuum.log2FC in expression of this searched gene in stem-like cells from each diseased tissue sample relative to stem-like cells in normal samples in each tissue plotted against the malignancy continuum. Samples are colored based on if they are from different disease stage.AD: Adenomas
SER: Sessile serrated lesions
MSI-H: Microsatellite-high colorectal cancer
MSS: Microsatellite stable colorectal cancer
EsophagusThe image shows the transcriptomic changes along malignancy continuum.log2FC in expression of this searched gene in stem-like cells from each diseased tissue sample relative to stem-like cells in normal samples in each tissue plotted against the malignancy continuum. Samples are colored based on if they are from different disease stage.
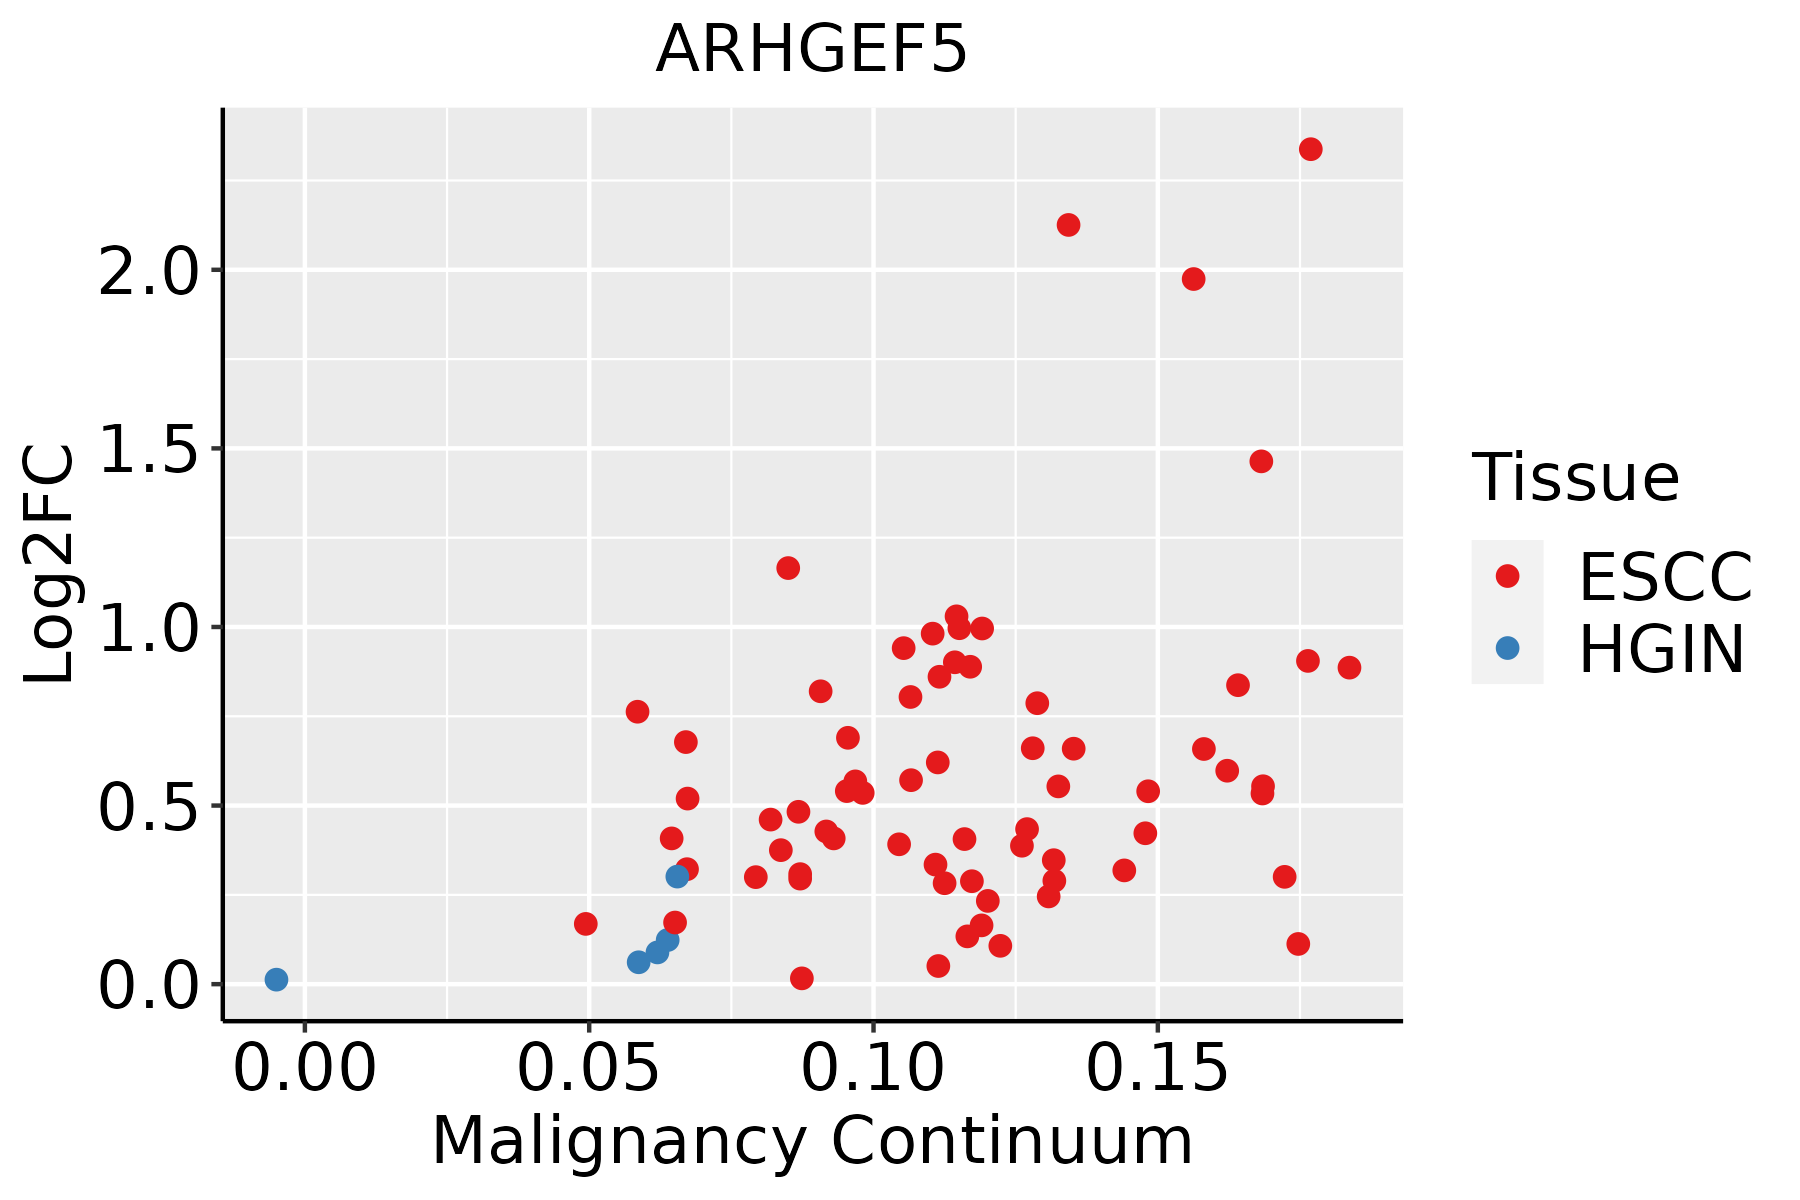
ESCC: Esophageal squamous cell carcinoma
HGIN: High-grade intraepithelial neoplasias
LGIN: Low-grade intraepithelial neoplasias
LiverThe image shows the transcriptomic changes along malignancy continuum.log2FC in expression of this searched gene in stem-like cells from each diseased tissue sample relative to stem-like cells in normal samples in each tissue plotted against the malignancy continuum. Samples are colored based on if they are from different disease stage.
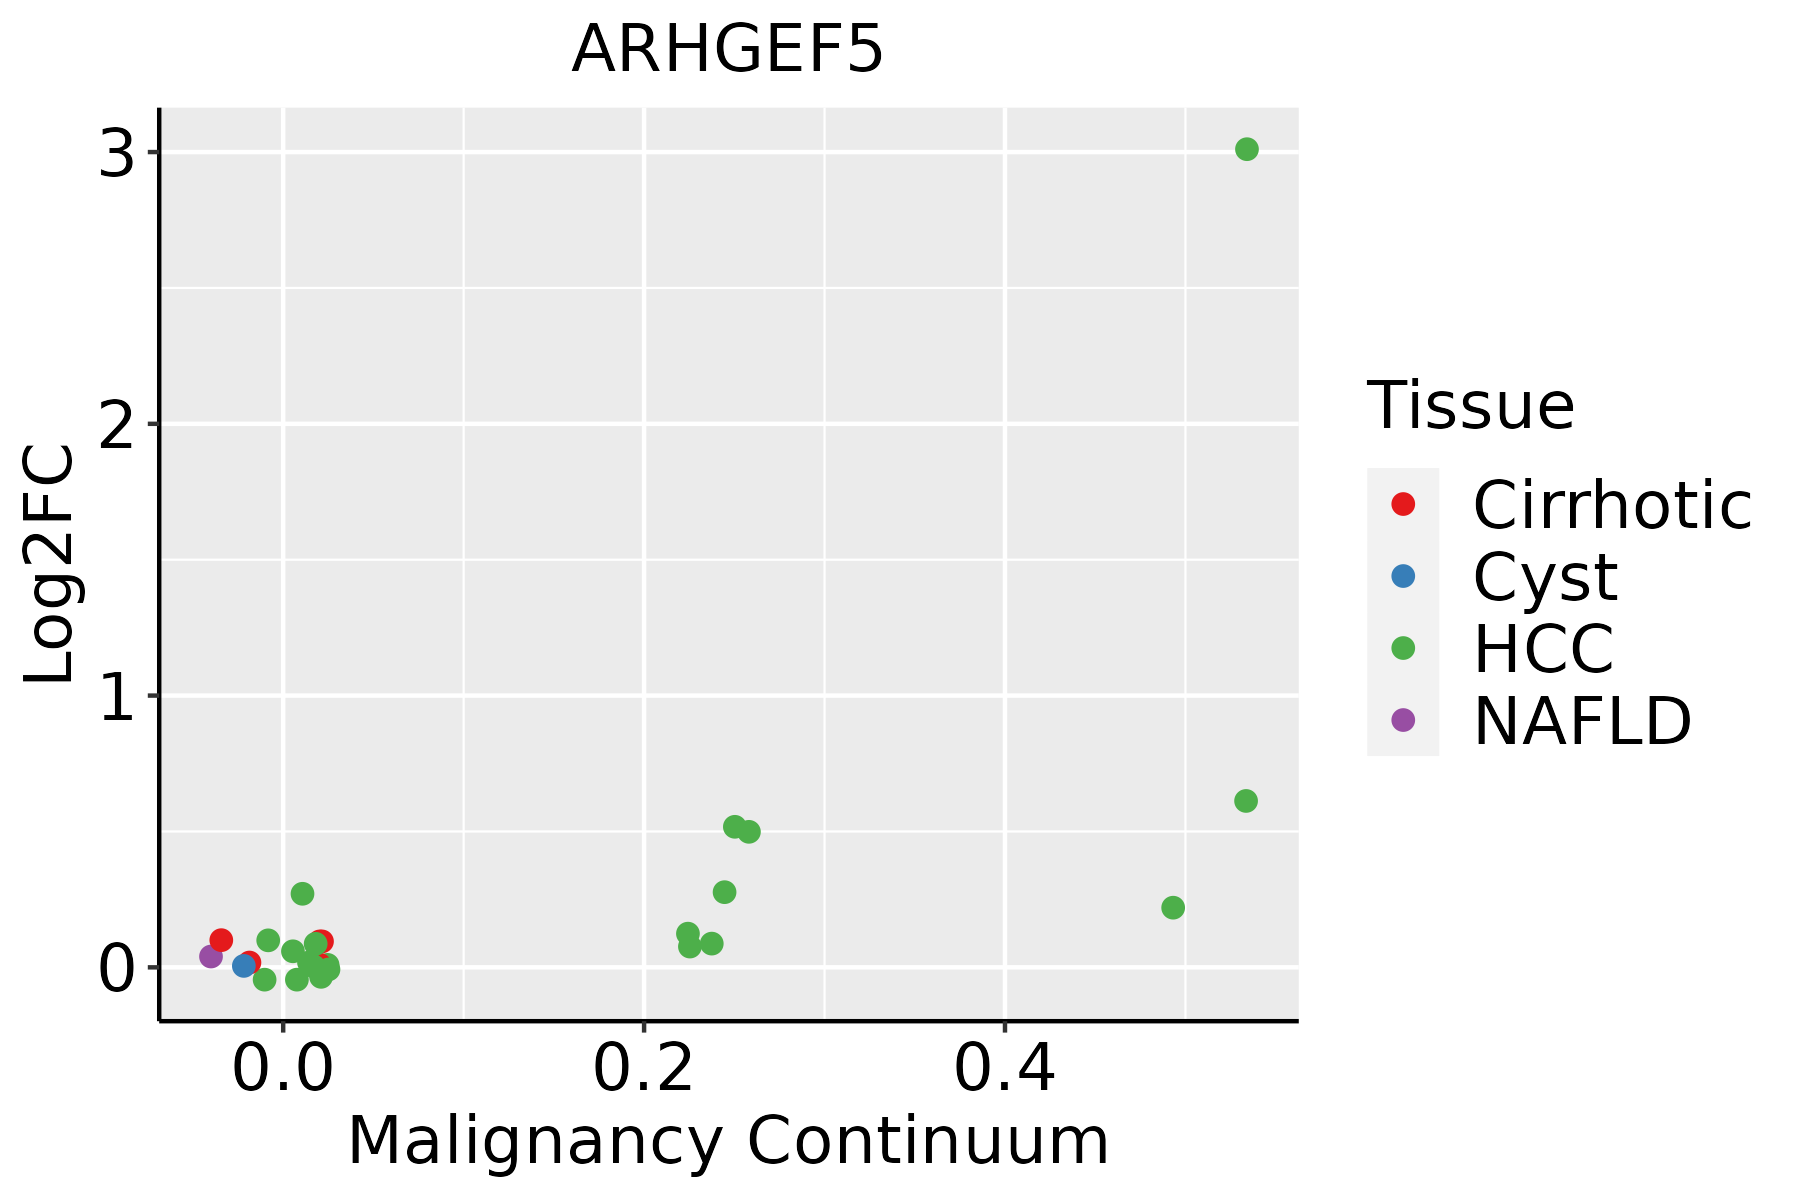
HCC: Hepatocellular carcinoma
NAFLD: Non-alcoholic fatty liver disease
Oral CavityThe image shows the transcriptomic changes along malignancy continuum.log2FC in expression of this searched gene in stem-like cells from each diseased tissue sample relative to stem-like cells in normal samples in each tissue plotted against the malignancy continuum. Samples are colored based on if they are from different disease stage.
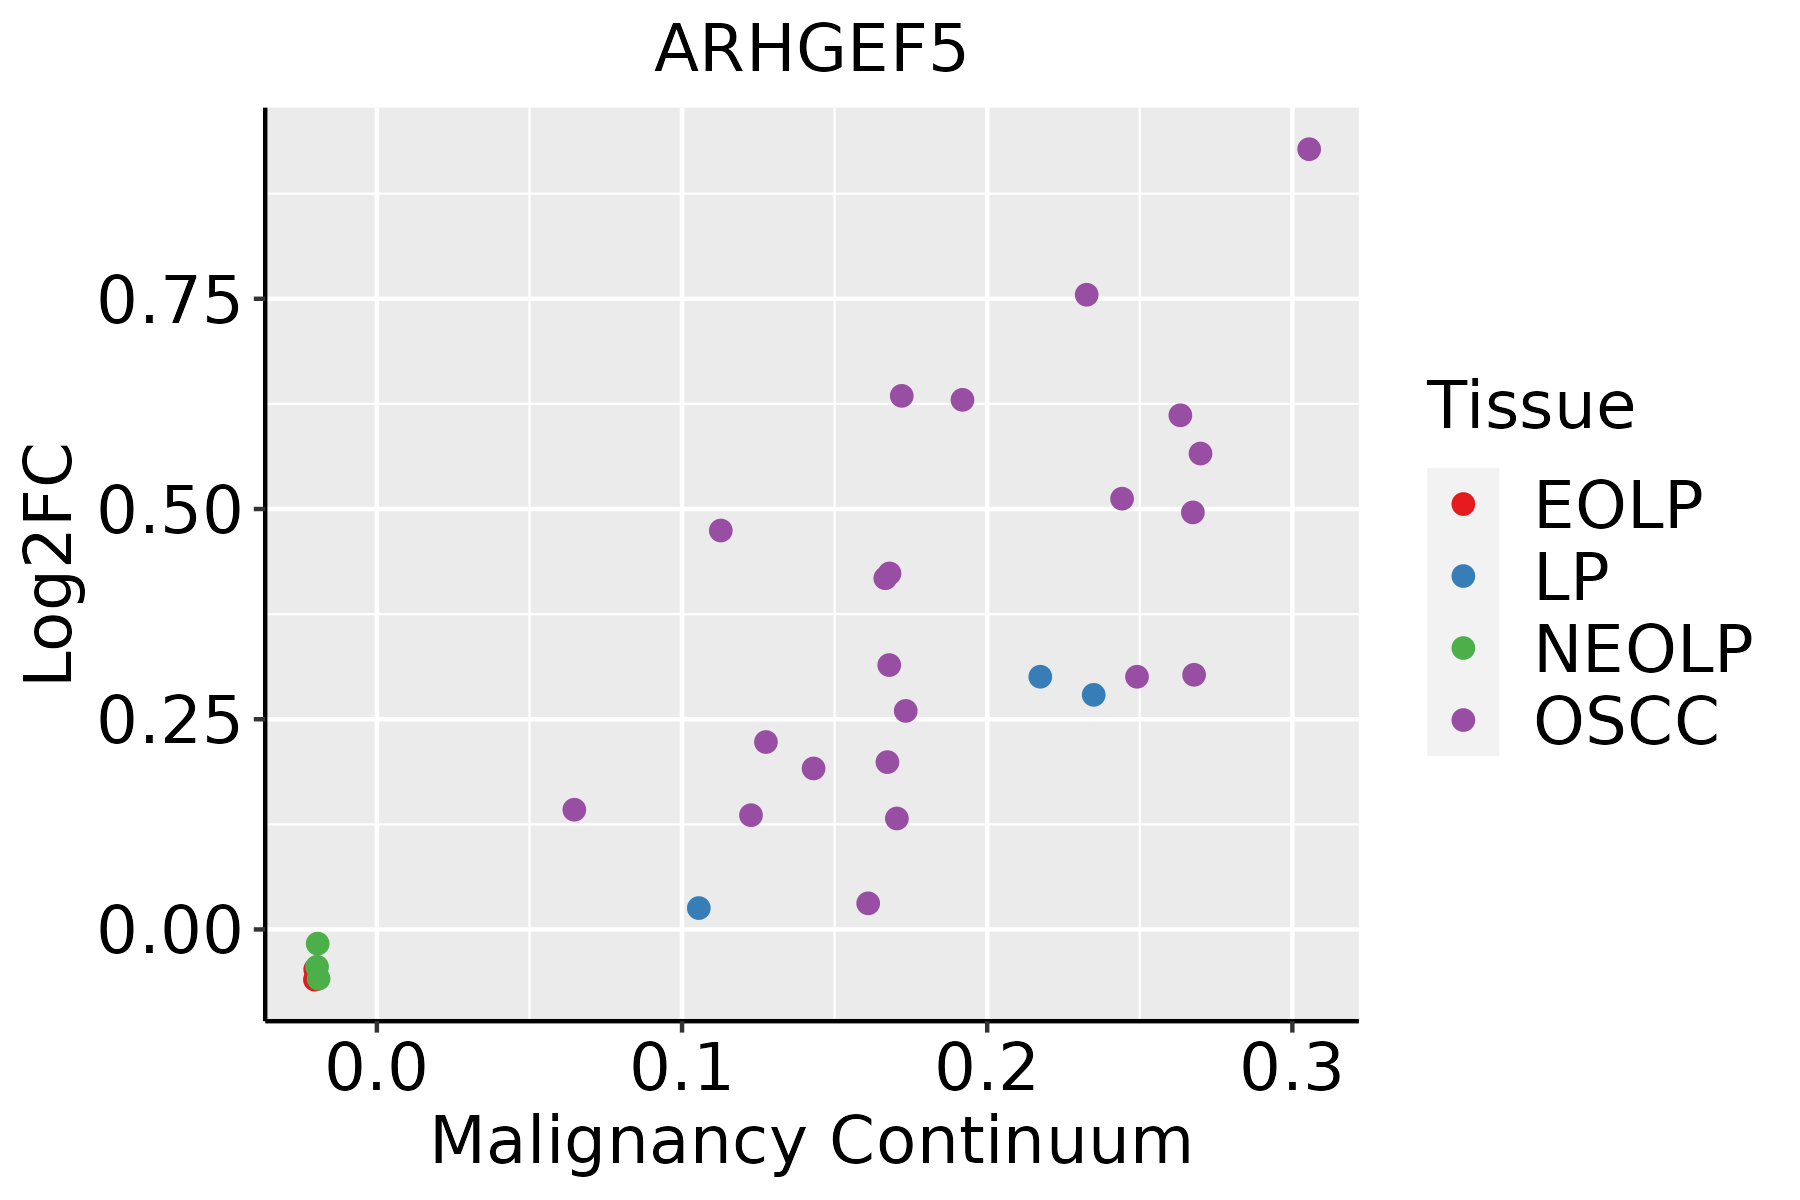
EOLP: Erosive Oral lichen planus
LP: leukoplakia
NEOLP: Non-erosive oral lichen planus
OSCC: Oral squamous cell carcinoma
ThyroidThe image shows the transcriptomic changes along malignancy continuum.log2FC in expression of this searched gene in stem-like cells from each diseased tissue sample relative to stem-like cells in normal samples in each tissue plotted against the malignancy continuum. Samples are colored based on if they are from different disease stage.ATC: Anaplastic thyroid cancer
HT: Hashimoto's thyroiditis
PTC: Papillary thyroid cancer
∗log2FC in expression of this searched gene in stem-like cells from each diseased tissue sample relative to stem-like cells in normal samples in each tissue plotted against the malignancy continuum. Samples are colored based on if they are from different disease stage.

Top

Malignant transformation related pathway analysis

check buttonFind out the enriched GO biological processes and KEGG pathways involved in transition from healthy to precancer to cancer
check button Figure of enriched GO biological processes.
TissueDisease StageEnriched GO biological Processes
ColorectumADGO analysis - Figure of enriched GO biological processes: Top 15 enriched GO BP terms are showed in the bar plot of each disease state in each tissue. Each row represents a significant GO biological process which is colored according to the -log10(p.adjust).
ColorectumSERGO analysis - Figure of enriched GO biological processes: Top 15 enriched GO BP terms are showed in the bar plot of each disease state in each tissue. Each row represents a significant GO biological process which is colored according to the -log10(p.adjust).
ColorectumMSSGO analysis - Figure of enriched GO biological processes: Top 15 enriched GO BP terms are showed in the bar plot of each disease state in each tissue. Each row represents a significant GO biological process which is colored according to the -log10(p.adjust).
ColorectumMSI-HGO analysis - Figure of enriched GO biological processes: Top 15 enriched GO BP terms are showed in the bar plot of each disease state in each tissue. Each row represents a significant GO biological process which is colored according to the -log10(p.adjust).
ColorectumFAPGO analysis - Figure of enriched GO biological processes: Top 15 enriched GO BP terms are showed in the bar plot of each disease state in each tissue. Each row represents a significant GO biological process which is colored according to the -log10(p.adjust).
∗Top 15 enriched GO BP terms are showed in the bar plot of each disease state in each tissue. Each row represents a significant GO biological process which is colored according to the -log10(p.adjust).
Page: 1 2 3 4 5 6 7 8 9 

check button Enriched GO biological processes.
GO IDTissueDisease StageDescriptionGene RatioBg Ratiopvaluep.adjustCount
GO:0007015ColorectumADactin filament organization167/3918442/187231.65e-167.94e-14167
GO:1902903ColorectumADregulation of supramolecular fiber organization139/3918383/187232.01e-123.19e-10139
GO:0032970ColorectumADregulation of actin filament-based process142/3918397/187234.05e-125.90e-10142
GO:0110053ColorectumADregulation of actin filament organization108/3918278/187235.02e-126.98e-10108
GO:1902905ColorectumADpositive regulation of supramolecular fiber organization85/3918209/187235.95e-116.33e-0985
GO:0032956ColorectumADregulation of actin cytoskeleton organization127/3918358/187231.03e-101.04e-08127
GO:0051495ColorectumADpositive regulation of cytoskeleton organization89/3918226/187231.61e-101.56e-0889
GO:1904951ColorectumADpositive regulation of establishment of protein localization112/3918319/187232.55e-091.80e-07112
GO:0051222ColorectumADpositive regulation of protein transport106/3918303/187238.45e-095.08e-07106
GO:0061572ColorectumADactin filament bundle organization60/3918161/187231.33e-064.23e-0560
GO:0043087ColorectumADregulation of GTPase activity110/3918348/187231.64e-065.03e-05110
GO:0051017ColorectumADactin filament bundle assembly58/3918157/187232.74e-067.89e-0558
GO:0051056ColorectumADregulation of small GTPase mediated signal transduction94/3918302/187231.81e-053.76e-0494
GO:0031032ColorectumADactomyosin structure organization65/3918196/187234.17e-057.37e-0465
GO:0017038ColorectumADprotein import67/3918206/187236.34e-051.05e-0367
GO:0030038ColorectumADcontractile actin filament bundle assembly39/3918106/187231.22e-041.78e-0339
GO:0043149ColorectumADstress fiber assembly39/3918106/187231.22e-041.78e-0339
GO:0033674ColorectumADpositive regulation of kinase activity131/3918467/187231.28e-041.85e-03131
GO:0032231ColorectumADregulation of actin filament bundle assembly37/3918105/187234.82e-045.27e-0337
GO:1904591ColorectumADpositive regulation of protein import19/391843/187235.03e-045.43e-0319
Page: 1 2 3 4 5 6 7 8 9 10 11 12 

check button Enriched KEGG pathways.
Pathway IDTissueDisease StageDescriptionGene RatioBg Ratiopvaluep.adjustqvalueCount
Page: 1 

Top

Cell-cell communication analysis

check buttonIdentification of potential cell-cell interactions between two cell types and their ligand-receptor pairs for different disease states
LigandReceptorLRpairPathwayTissueDisease Stage
Page: 1 

Top

Single-cell gene regulatory network inference analysis

check buttonFind out the significant the regulons (TFs) and the target genes of each regulon across cell types for different disease states
TFCell TypeTissueDisease StageTarget GeneRSSRegulon Activity
∗The dot plots of a searched regulon are shown for all cell subpopulations in each disease state of each tissue based on the regulon specific score inferred using pySCENIC and by calculating the average expression.
Page: 1 

Top

Somatic mutation of malignant transformation related genes

check buttonAnnotation of somatic variants for genes involved in malignant transformation
Hugo SymbolVariant ClassVariant ClassificationdbSNP RSHGVScHGVSpHGVSp ShortSWISSPROTBIOTYPESIFTPolyPhenTumor Sample BarcodeTissueHistologySexAgeStageTherapy TypesDrugsOutcome
ARHGEF5SNVMissense_Mutationnovelc.2579G>Tp.Gly860Valp.G860VQ12774protein_codingtolerated(0.09)benign(0.166)TCGA-A7-A6VX-01Breastbreast invasive carcinomaFemale>=65I/IIChemotherapydocetaxelCR
ARHGEF5SNVMissense_Mutationc.4748A>Gp.His1583Argp.H1583RQ12774protein_codingdeleterious(0.04)benign(0.163)TCGA-A8-A08P-01Breastbreast invasive carcinomaFemale>=65III/IVChemotherapy5-fluorouracilCR
ARHGEF5SNVMissense_Mutationnovelc.3595N>Tp.His1199Tyrp.H1199YQ12774protein_codingdeleterious(0)probably_damaging(0.998)TCGA-AC-A23H-01Breastbreast invasive carcinomaFemale>=65I/IIUnknownUnknownPD
ARHGEF5SNVMissense_Mutationnovelc.1059G>Tp.Glu353Aspp.E353DQ12774protein_codingtolerated(0.12)benign(0.143)TCGA-AN-A046-01Breastbreast invasive carcinomaFemale>=65I/IIUnknownUnknownSD
ARHGEF5SNVMissense_Mutationrs774773903c.44C>Gp.Ser15Cysp.S15CQ12774protein_codingdeleterious(0)benign(0.053)TCGA-C8-A8HQ-01Breastbreast invasive carcinomaFemale<65I/IIUnknownUnknownSD
ARHGEF5SNVMissense_Mutationrs755202652c.3620N>Ap.Arg1207Glnp.R1207QQ12774protein_codingtolerated(0.19)benign(0.313)TCGA-D8-A1Y1-01Breastbreast invasive carcinomaFemale>=65III/IVHormone TherapytamoxiphenPD
ARHGEF5SNVMissense_Mutationnovelc.907G>Ap.Gly303Serp.G303SQ12774protein_codingtolerated(0.33)benign(0.005)TCGA-2W-A8YY-01Cervixcervical & endocervical cancerFemale<65I/IIChemotherapycisplatinCR
ARHGEF5SNVMissense_Mutationc.394G>Cp.Glu132Glnp.E132QQ12774protein_codingtolerated(0.1)benign(0.086)TCGA-C5-A1BJ-01Cervixcervical & endocervical cancerFemale<65I/IIUnknownUnknownSD
ARHGEF5SNVMissense_Mutationrs746273665c.542G>Cp.Arg181Thrp.R181TQ12774protein_codingtolerated(0.61)benign(0.025)TCGA-DS-A7WI-01Cervixcervical & endocervical cancerFemale<65I/IIChemotherapycisplatinPD
ARHGEF5SNVMissense_Mutationrs761138536c.390N>Cp.Gln130Hisp.Q130HQ12774protein_codingdeleterious(0.01)benign(0.438)TCGA-IR-A3LI-01Cervixcervical & endocervical cancerFemale<65I/IIChemotherapycisplatinCR
Page: 1 2 3 4 5 6 7 8 9 10 11 

Top

Related drugs of malignant transformation related genes

check buttonIdentification of chemicals and drugs interact with genes involved in malignant transfromation
(DGIdb 4.0)
Entrez IDSymbolCategoryInteraction TypesDrug Claim NameDrug NamePMIDs
Page: 1