
|
|||||
|
 | |
| |
| |
| |
| |
| |
|
Gene: ARHGEF4 |
Gene summary for ARHGEF4 |
| Gene information | Species | Human | Gene symbol | ARHGEF4 | Gene ID | 50649 |
| Gene name | Rho guanine nucleotide exchange factor 4 | |
| Gene Alias | ASEF | |
| Cytomap | 2q21.1 | |
| Gene Type | protein-coding | GO ID | GO:0007154 | UniProtAcc | Q9NR80 |
Top |
Malignant transformation analysis |
| Identification of the aberrant gene expression in precancerous and cancerous lesions by comparing the gene expression of stem-like cells in diseased tissues with normal stem cells |
| Entrez ID | Symbol | Replicates | Species | Organ | Tissue | Adj P-value | Log2FC | Malignancy |
| 50649 | ARHGEF4 | CCI_1 | Human | Cervix | CC | 3.55e-09 | 8.25e-01 | 0.528 |
| 50649 | ARHGEF4 | CCI_2 | Human | Cervix | CC | 5.23e-08 | 1.06e+00 | 0.5249 |
| 50649 | ARHGEF4 | CCI_3 | Human | Cervix | CC | 4.60e-17 | 1.13e+00 | 0.516 |
| 50649 | ARHGEF4 | LZE4T | Human | Esophagus | ESCC | 2.45e-03 | 6.31e-02 | 0.0811 |
| 50649 | ARHGEF4 | LZE7T | Human | Esophagus | ESCC | 7.67e-04 | 3.99e-01 | 0.0667 |
| 50649 | ARHGEF4 | LZE22T | Human | Esophagus | ESCC | 5.05e-03 | 1.75e-01 | 0.068 |
| 50649 | ARHGEF4 | LZE24T | Human | Esophagus | ESCC | 2.26e-02 | 6.66e-02 | 0.0596 |
| 50649 | ARHGEF4 | LZE21T | Human | Esophagus | ESCC | 1.10e-02 | 5.19e-01 | 0.0655 |
| 50649 | ARHGEF4 | P1T-E | Human | Esophagus | ESCC | 4.64e-04 | 3.68e-01 | 0.0875 |
| 50649 | ARHGEF4 | P2T-E | Human | Esophagus | ESCC | 1.72e-03 | 2.22e-02 | 0.1177 |
| 50649 | ARHGEF4 | P4T-E | Human | Esophagus | ESCC | 4.42e-13 | 1.43e-01 | 0.1323 |
| 50649 | ARHGEF4 | P5T-E | Human | Esophagus | ESCC | 2.80e-10 | 1.09e-01 | 0.1327 |
| 50649 | ARHGEF4 | P9T-E | Human | Esophagus | ESCC | 5.83e-08 | 1.61e-01 | 0.1131 |
| 50649 | ARHGEF4 | P10T-E | Human | Esophagus | ESCC | 1.45e-13 | 2.31e-01 | 0.116 |
| 50649 | ARHGEF4 | P11T-E | Human | Esophagus | ESCC | 5.34e-03 | 8.42e-02 | 0.1426 |
| 50649 | ARHGEF4 | P12T-E | Human | Esophagus | ESCC | 3.47e-25 | 5.46e-01 | 0.1122 |
| 50649 | ARHGEF4 | P15T-E | Human | Esophagus | ESCC | 5.19e-21 | 5.23e-01 | 0.1149 |
| 50649 | ARHGEF4 | P20T-E | Human | Esophagus | ESCC | 2.86e-09 | 2.32e-01 | 0.1124 |
| 50649 | ARHGEF4 | P21T-E | Human | Esophagus | ESCC | 3.39e-10 | 1.74e-01 | 0.1617 |
| 50649 | ARHGEF4 | P22T-E | Human | Esophagus | ESCC | 1.09e-06 | 7.23e-02 | 0.1236 |
| Page: 1 2 3 4 |
| Tissue | Expression Dynamics | Abbreviation |
| Cervix | 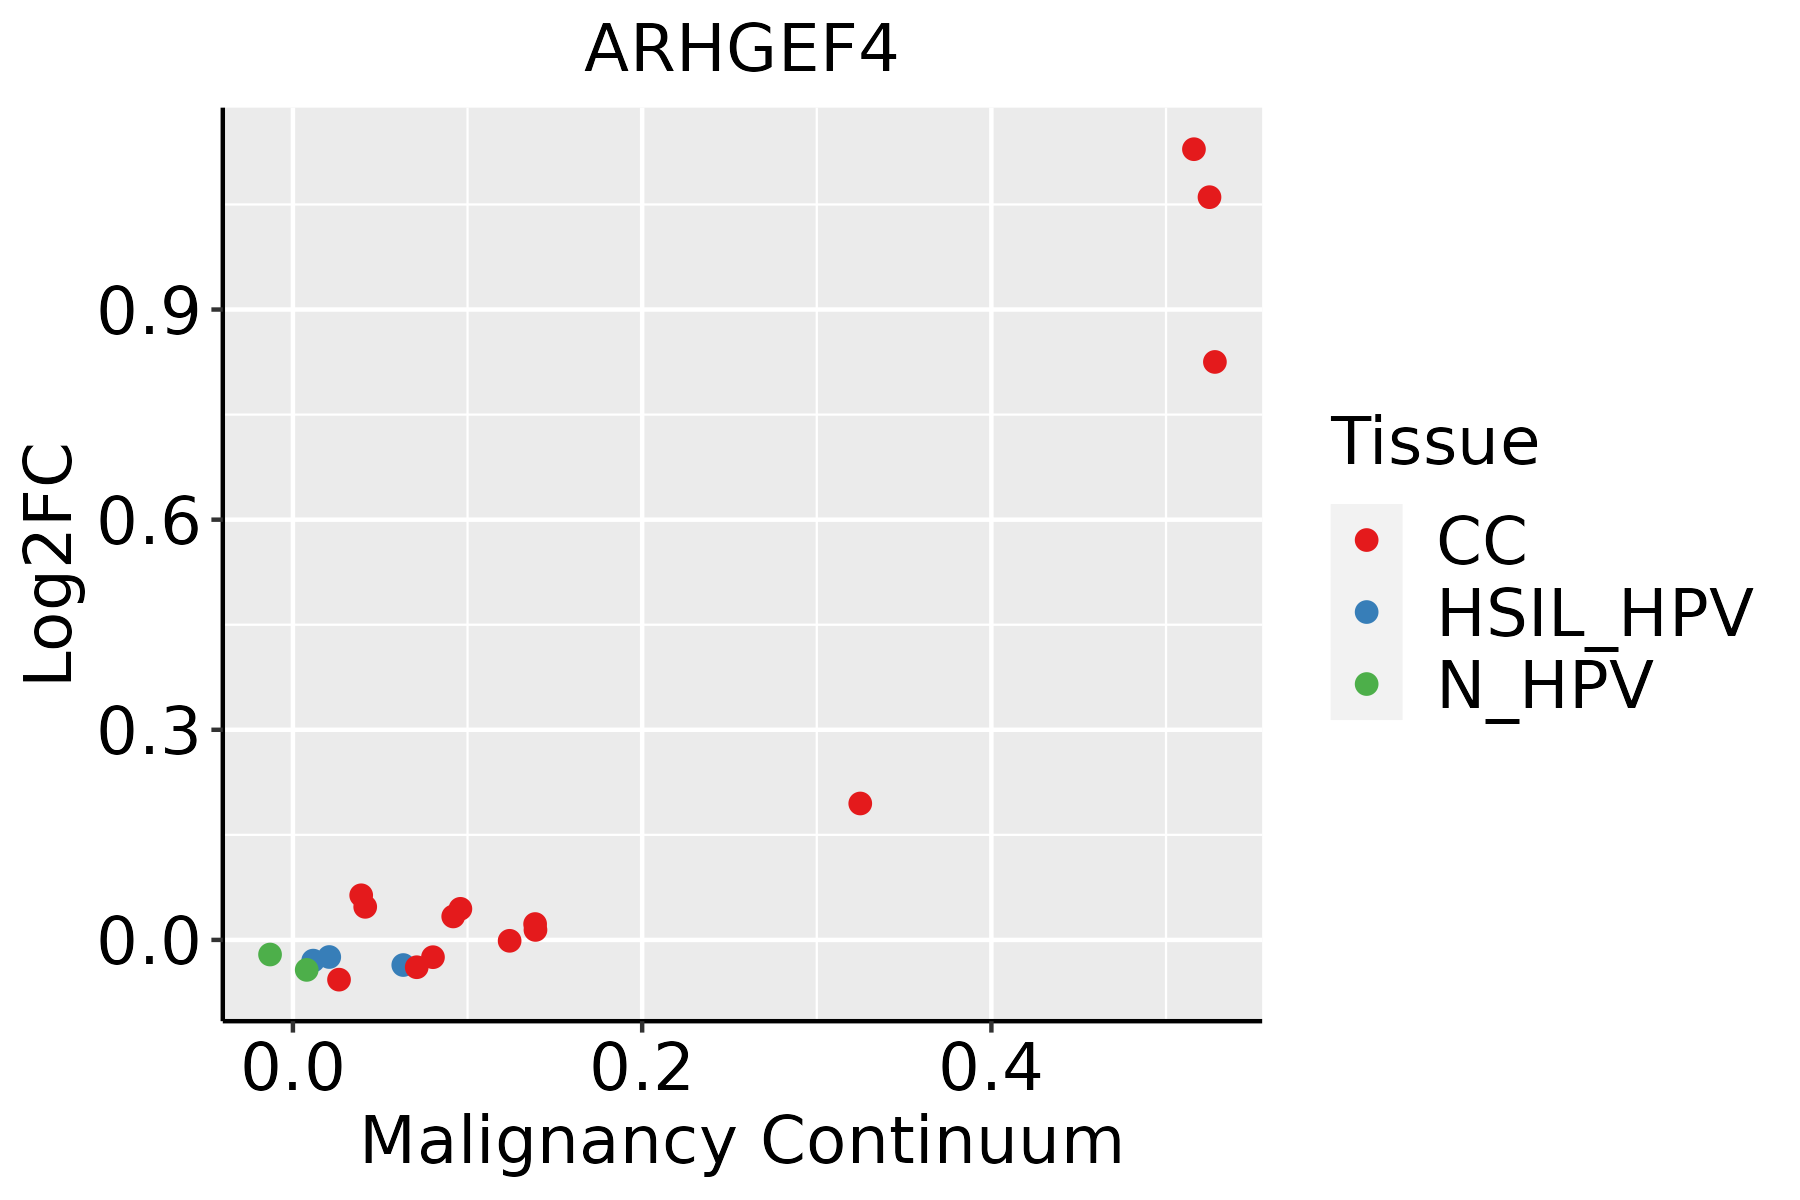 | CC: Cervix cancer |
| HSIL_HPV: HPV-infected high-grade squamous intraepithelial lesions | ||
| N_HPV: HPV-infected normal cervix | ||
| Esophagus |  | ESCC: Esophageal squamous cell carcinoma |
| HGIN: High-grade intraepithelial neoplasias | ||
| LGIN: Low-grade intraepithelial neoplasias | ||
| Oral Cavity | 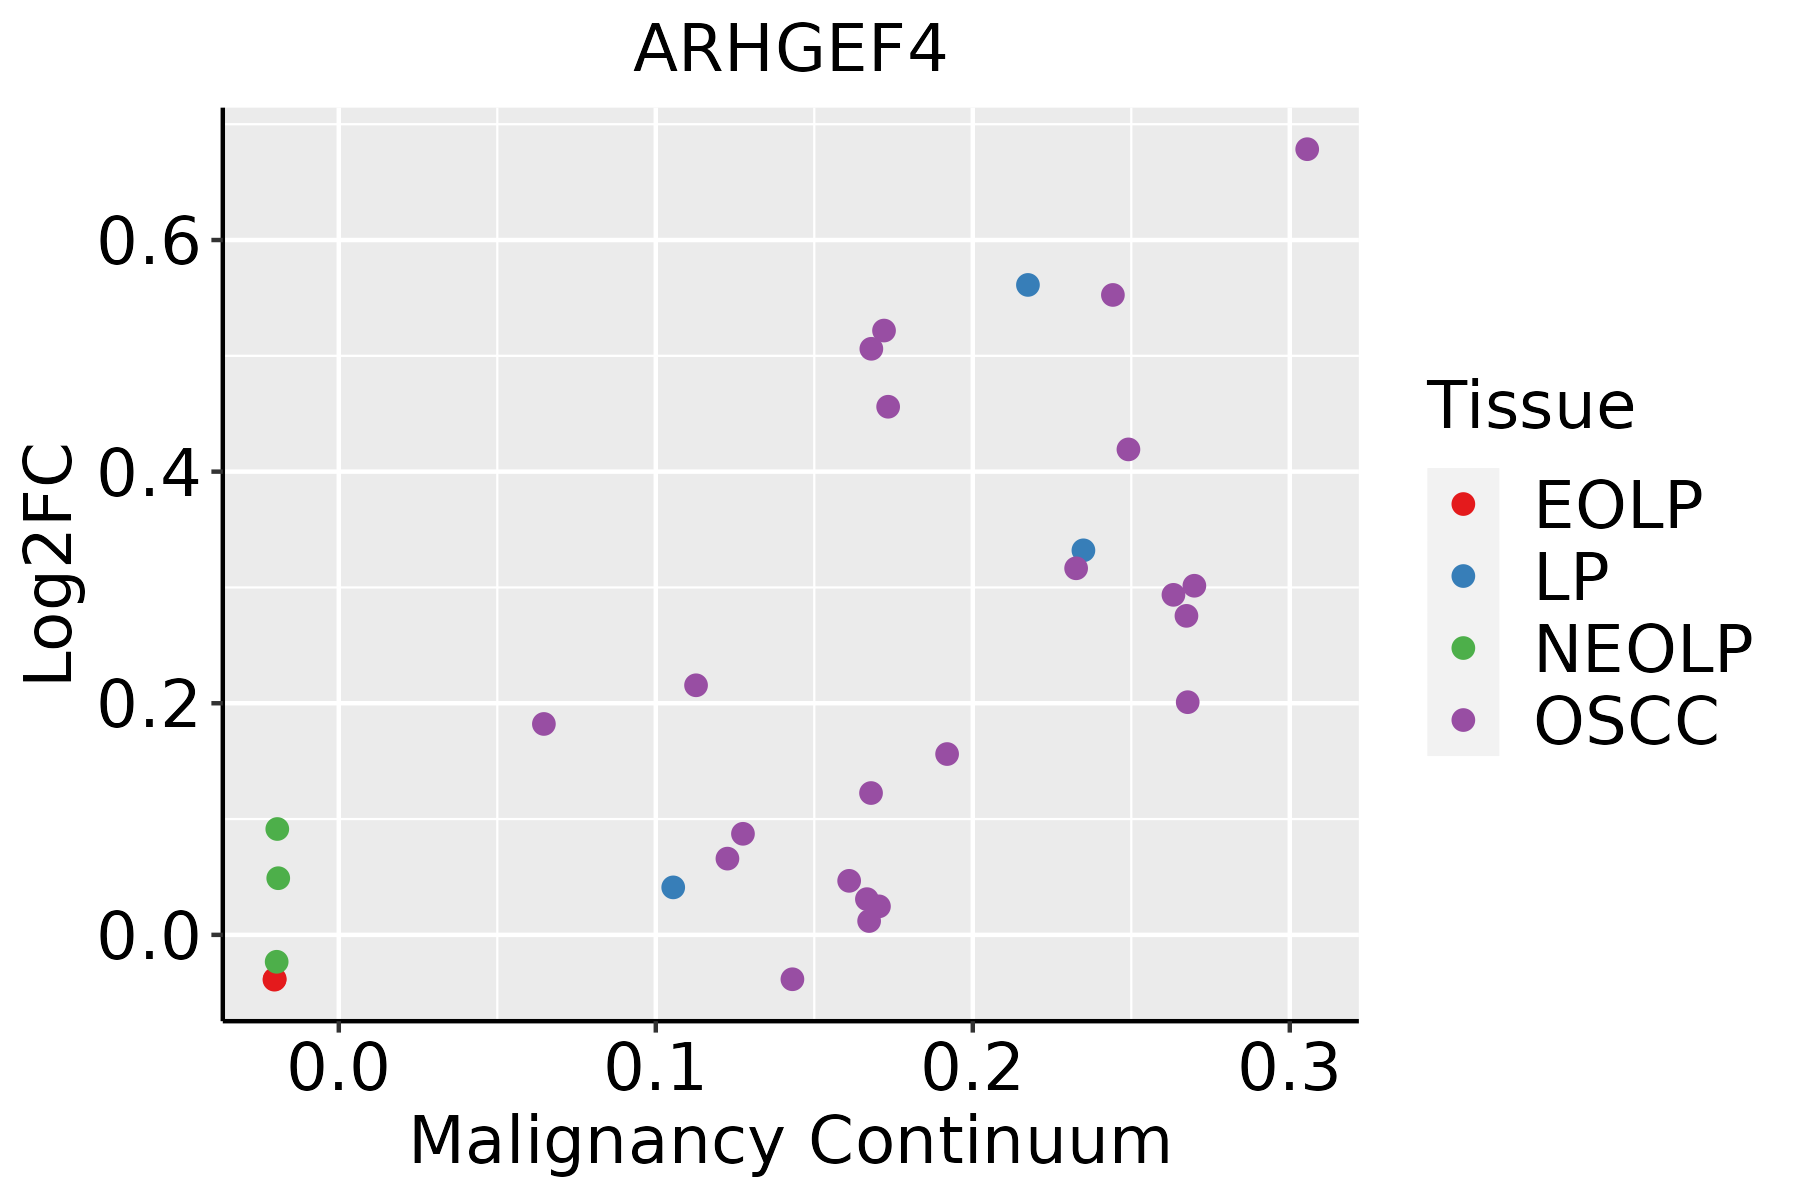 | EOLP: Erosive Oral lichen planus |
| LP: leukoplakia | ||
| NEOLP: Non-erosive oral lichen planus | ||
| OSCC: Oral squamous cell carcinoma |
| ∗log2FC in expression of this searched gene in stem-like cells from each diseased tissue sample relative to stem-like cells in normal samples in each tissue plotted against the malignancy continuum. Samples are colored based on if they are from different disease stage. |
Top |
Malignant transformation related pathway analysis |
| Find out the enriched GO biological processes and KEGG pathways involved in transition from healthy to precancer to cancer |
| Tissue | Disease Stage | Enriched GO biological Processes |
| Colorectum | AD |  |
| Colorectum | SER |  |
| Colorectum | MSS |  |
| Colorectum | MSI-H |  |
| Colorectum | FAP |  |
| ∗Top 15 enriched GO BP terms are showed in the bar plot of each disease state in each tissue. Each row represents a significant GO biological process which is colored according to the -log10(p.adjust). |
| Page: 1 2 3 4 5 6 7 8 9 |
| GO ID | Tissue | Disease Stage | Description | Gene Ratio | Bg Ratio | pvalue | p.adjust | Count |
| GO:00510566 | Cervix | CC | regulation of small GTPase mediated signal transduction | 75/2311 | 302/18723 | 1.54e-09 | 1.74e-07 | 75 |
| GO:00975817 | Cervix | CC | lamellipodium organization | 31/2311 | 90/18723 | 4.57e-08 | 2.76e-06 | 31 |
| GO:00300325 | Cervix | CC | lamellipodium assembly | 26/2311 | 72/18723 | 1.87e-07 | 8.48e-06 | 26 |
| GO:0051056 | Colorectum | AD | regulation of small GTPase mediated signal transduction | 94/3918 | 302/18723 | 1.81e-05 | 3.76e-04 | 94 |
| GO:00510562 | Colorectum | FAP | regulation of small GTPase mediated signal transduction | 78/2622 | 302/18723 | 3.25e-08 | 2.85e-06 | 78 |
| GO:00510563 | Colorectum | CRC | regulation of small GTPase mediated signal transduction | 69/2078 | 302/18723 | 3.34e-09 | 9.08e-07 | 69 |
| GO:009758116 | Esophagus | ESCC | lamellipodium organization | 53/8552 | 90/18723 | 7.92e-03 | 2.82e-02 | 53 |
| GO:005105610 | Esophagus | ESCC | regulation of small GTPase mediated signal transduction | 157/8552 | 302/18723 | 1.55e-02 | 4.98e-02 | 157 |
| GO:00510564 | Liver | NAFLD | regulation of small GTPase mediated signal transduction | 56/1882 | 302/18723 | 4.62e-06 | 1.75e-04 | 56 |
| GO:009758110 | Oral cavity | OSCC | lamellipodium organization | 54/7305 | 90/18723 | 4.39e-05 | 3.76e-04 | 54 |
| GO:00300328 | Oral cavity | OSCC | lamellipodium assembly | 41/7305 | 72/18723 | 1.53e-03 | 7.31e-03 | 41 |
| GO:009758115 | Oral cavity | LP | lamellipodium organization | 37/4623 | 90/18723 | 4.36e-04 | 4.18e-03 | 37 |
| GO:005105617 | Thyroid | PTC | regulation of small GTPase mediated signal transduction | 132/5968 | 302/18723 | 9.26e-06 | 1.04e-04 | 132 |
| GO:005105618 | Thyroid | ATC | regulation of small GTPase mediated signal transduction | 141/6293 | 302/18723 | 1.43e-06 | 1.77e-05 | 141 |
| Page: 1 |
| Pathway ID | Tissue | Disease Stage | Description | Gene Ratio | Bg Ratio | pvalue | p.adjust | qvalue | Count |
| hsa0481016 | Cervix | CC | Regulation of actin cytoskeleton | 64/1267 | 229/8465 | 2.24e-07 | 2.59e-06 | 1.53e-06 | 64 |
| hsa0481017 | Cervix | CC | Regulation of actin cytoskeleton | 64/1267 | 229/8465 | 2.24e-07 | 2.59e-06 | 1.53e-06 | 64 |
| hsa0481028 | Esophagus | ESCC | Regulation of actin cytoskeleton | 133/4205 | 229/8465 | 5.94e-03 | 1.48e-02 | 7.56e-03 | 133 |
| hsa04810112 | Esophagus | ESCC | Regulation of actin cytoskeleton | 133/4205 | 229/8465 | 5.94e-03 | 1.48e-02 | 7.56e-03 | 133 |
| hsa0481026 | Oral cavity | OSCC | Regulation of actin cytoskeleton | 129/3704 | 229/8465 | 7.14e-05 | 2.74e-04 | 1.40e-04 | 129 |
| hsa04810111 | Oral cavity | OSCC | Regulation of actin cytoskeleton | 129/3704 | 229/8465 | 7.14e-05 | 2.74e-04 | 1.40e-04 | 129 |
| Page: 1 |
Top |
Cell-cell communication analysis |
| Identification of potential cell-cell interactions between two cell types and their ligand-receptor pairs for different disease states |
| Ligand | Receptor | LRpair | Pathway | Tissue | Disease Stage |
| Page: 1 |
Top |
Single-cell gene regulatory network inference analysis |
| Find out the significant the regulons (TFs) and the target genes of each regulon across cell types for different disease states |
| TF | Cell Type | Tissue | Disease Stage | Target Gene | RSS | Regulon Activity |
| ∗The dot plots of a searched regulon are shown for all cell subpopulations in each disease state of each tissue based on the regulon specific score inferred using pySCENIC and by calculating the average expression. |
| Page: 1 |
Top |
Somatic mutation of malignant transformation related genes |
| Annotation of somatic variants for genes involved in malignant transformation |
| Hugo Symbol | Variant Class | Variant Classification | dbSNP RS | HGVSc | HGVSp | HGVSp Short | SWISSPROT | BIOTYPE | SIFT | PolyPhen | Tumor Sample Barcode | Tissue | Histology | Sex | Age | Stage | Therapy Types | Drugs | Outcome |
| ARHGEF4 | SNV | Missense_Mutation | c.1233N>A | p.Met411Ile | p.M411I | Q9NR80 | protein_coding | deleterious(0) | probably_damaging(0.979) | TCGA-A7-A6VY-01 | Breast | breast invasive carcinoma | Female | <65 | I/II | Chemotherapy | cyclophosphamide | CR | |
| ARHGEF4 | SNV | Missense_Mutation | novel | c.949N>T | p.Arg317Cys | p.R317C | Q9NR80 | protein_coding | deleterious(0) | probably_damaging(0.996) | TCGA-AC-A23H-01 | Breast | breast invasive carcinoma | Female | >=65 | I/II | Unknown | Unknown | PD |
| ARHGEF4 | SNV | Missense_Mutation | rs201813341 | c.383C>T | p.Thr128Met | p.T128M | Q9NR80 | protein_coding | tolerated(0.21) | benign(0.009) | TCGA-AR-A1AK-01 | Breast | breast invasive carcinoma | Female | >=65 | I/II | Hormone Therapy | anastrozole | SD |
| ARHGEF4 | SNV | Missense_Mutation | c.55G>T | p.Ala19Ser | p.A19S | Q9NR80 | protein_coding | tolerated_low_confidence(0.13) | benign(0.003) | TCGA-BH-A0B4-01 | Breast | breast invasive carcinoma | Male | >=65 | III/IV | Hormone Therapy | tamoxiphen | SD | |
| ARHGEF4 | SNV | Missense_Mutation | rs759872047 | c.712G>A | p.Asp238Asn | p.D238N | Q9NR80 | protein_coding | deleterious(0) | probably_damaging(0.979) | TCGA-BH-A18I-01 | Breast | breast invasive carcinoma | Female | <65 | I/II | Chemotherapy | taxotere | CR |
| ARHGEF4 | SNV | Missense_Mutation | c.886N>A | p.Glu296Lys | p.E296K | Q9NR80 | protein_coding | deleterious(0.02) | probably_damaging(1) | TCGA-C8-A274-01 | Breast | breast invasive carcinoma | Female | <65 | I/II | Hormone Therapy | tamoxiphen | SD | |
| ARHGEF4 | SNV | Missense_Mutation | novel | c.1087G>A | p.Ala363Thr | p.A363T | Q9NR80 | protein_coding | tolerated(0.06) | benign(0.062) | TCGA-2W-A8YY-01 | Cervix | cervical & endocervical cancer | Female | <65 | I/II | Chemotherapy | cisplatin | CR |
| ARHGEF4 | SNV | Missense_Mutation | c.1162N>A | p.Glu388Lys | p.E388K | Q9NR80 | protein_coding | deleterious(0) | probably_damaging(0.912) | TCGA-DR-A0ZM-01 | Cervix | cervical & endocervical cancer | Female | <65 | III/IV | Unspecific | Cisplatin | SD | |
| ARHGEF4 | SNV | Missense_Mutation | novel | c.436N>C | p.Asp146His | p.D146H | Q9NR80 | protein_coding | deleterious(0) | probably_damaging(0.984) | TCGA-VS-A958-01 | Cervix | cervical & endocervical cancer | Female | <65 | I/II | Chemotherapy | cisplatin | CR |
| ARHGEF4 | SNV | Missense_Mutation | c.871N>A | p.Glu291Lys | p.E291K | Q9NR80 | protein_coding | deleterious(0.01) | probably_damaging(0.999) | TCGA-A6-3809-01 | Colorectum | colon adenocarcinoma | Female | >=65 | I/II | Unknown | Unknown | SD |
| Page: 1 2 3 4 5 6 7 8 9 |
Top |
Related drugs of malignant transformation related genes |
| Identification of chemicals and drugs interact with genes involved in malignant transfromation |
| (DGIdb 4.0) |
| Entrez ID | Symbol | Category | Interaction Types | Drug Claim Name | Drug Name | PMIDs |
| Page: 1 |

Copyright 2023-Present -The University of Texas Health Science Center at Houston |